BTCUSDT.P - November 14, 2025BTCUSDT.P – 15m
Trend:
Price remains in a clear short-term downtrend, confirmed by the descending trendline that continues to act as resistance.
Current Structure:
Price is consolidating just above a nearby support area around 96,800–97,200.
A second, larger support area sits lower at 93,500–94,200, which may be tested if the current support fails.
Key Levels:
Resistance: 99,300–99,800, which aligns with the descending trendline. This is a strong area where sellers have previously reacted.
Support:
Immediate: 96,800–97,200
Major: 93,500–94,200
Scenarios:
Bullish:
A decisive break above the descending trendline combined with a move back above 99,300–99,800 would suggest a potential short-term trend reversal.
Bearish:
Failure to break the trendline and a drop below 96,800–97,200 would increase the likelihood of price moving down toward 93,500–94,200.
Momentum:
Recent candles show indecision and limited follow-through, indicating the market is waiting for a breakout or breakdown at this trendline–support intersection.
BTC-D

Bitcoin - is at cross road Bitcoin - is at cross road
price is at Key reistance pVAL which is a powerful area for a short but we need clear bull trap to trade it
that's why my short scenario possible in a cae of bull trap
Bullish plan - long in a case of squeezing up

$BTC crash. Where is the bottom?Bitcoin is crashing — and while it looks scary, it’s also one of those rare long-entry opportunities you’ll regret missing once the rebound kicks in.
Why is Bitcoin dumping?
1️⃣ A major hedge fund manager shut down his Bitcoin fund.
Historically, this kind of event often precedes bubble corrections, creating panic in the market.
2️⃣ The FED won’t publish inflation or unemployment numbers due to the government shutdown.
With no data, Powell can’t justify a rate cut.
The market is now pricing a “no-cut scenario,” which puts downward pressure on all risk assets — including crypto.
3️⃣ Structural consolidation.
I already posted about this:
- bullish short-term,
- bearish long-term
This is exactly what’s happening.
The macro downtrend should end around Q2 2026, meaning we’ll likely grind down or range until then.
Is this a bear market?
Not really.
Bitcoin probably won’t see an -80% crash ever again.
But a -30% correction? Absolutely possible.
What does the chart say?
The current correction has a support zone at $94–95k.
If that breaks, the next zone is $88k — less likely but still possible.
Between now and Q2 2026, we’ll get several relief bounces.
If you go long without leverage on strong support zones, you can ride these bounces safely.
Where is the opportunity?
Buy the fear, sell the greed — classic strategy.
Altcoins will bounce even harder than BTC:
CRYPTOCAP:PEPE , NYSE:FUN , DeFi coins, memecoins — these always react with double-digit rebounds.
The key idea
👉 The best entries happen when everyone is panic-selling.
👉 The best exits happen when everyone is euphoric.
Stay smart, stay patient.
DYOR.
#Bitcoin #CryptoCrash #BTC #Altcoins #CryptoTrading #CryptoAnalysis #CryptoMarket #CryptoInvesting #BTCPrice #BuyTheDip #MarketUpdate #TradingStrategy #TechnicalAnalysis #Macro #RiskManagement #HODL #CryptoNews

USDCAD still going DOWN.USDCAD is in a pullback and showing signs of pulling back down with about 1:2 RR.

$BTC VERY Close to Forming a BOTTOMReceiving the end of cycle calls / texts from normie friends - one of my best indicators.
Bullish Divergence on the Daily.
Need some closes above the EMA9 ~$103k to confirm.
Then $107,5 next up.

Bitcoin is Still Bearish (12H)Bitcoin still looks bearish | it seems to be inside wave C, and this upward move could be aimed at collecting sell orders and liquidating part of the short positions held by retail traders.
From the yellow circle, the price could get rejected toward TP1 and TP2.
Let’s wait and see what happens.
For risk management, please don't forget stop loss and capital management
When we reach the first target, save some profit and then change the stop to entry
Comment if you have any questions
Thank You

TradeCityPro | Bitcoin Daily Analysis #218👋 Welcome to TradeCity Pro!
Let’s dive into the Bitcoin analysis. Today, the market has started another upward move.
⏱ 1-Hour Timeframe
Yesterday, after breaking the support zone, Bitcoin made a downward move to the 10,2489 level. Now, it has started another upward movement.
The price is currently facing resistance at the 10,5020 level, and as you can see, it has experienced a strong rejection from this level, which has caused the bullish momentum to fade from the market.
This rejection at the 10,5020 level makes it a very important zone. If this level is broken, it will act as a strong trigger for a long position.
The first trigger for a long position:
The first trigger for a long position is the 10,5020 level. The next main trigger, which is our primary long trigger, is at 10,6644.
For a short position:
If the downward momentum continues, we can open a short position when the 10,2489 level is broken.
However, as long as the price is ranging between 10,2489 and 10,5020, I prefer not to open any new positions.

BITCOIN + BULLISH DIVBitcoin has weekly RSI bullish divergence which with passing 110.5k can push the price to new ATH

Market Sentiment Shifts: Fear & Greed, Liquidity & Next Cycle🌍 A truly global look at the market!
😱 The Fear & Greed Index has been sitting at 29 for the second day in a row, after recovering from 22–23 — even though the market has been trying to bounce for two days
That means all euphoria is dead — no more 10–15 random spikes a day.
📉 Short-term — not great.
📈 Long-term — that’s actually good.
⚠️ The index trying “get the bottom,” but historically major trend reversals happened around 10–15 points — keep that in mind.
💰 Meanwhile, index USDT.D looks ready for another big downward wave, which usually means stablecoins start flowing back into crypto 🐸
(Which ones? That’s the mystery for all, will see soon 😉)
🪙 A short bullish phase might last until spring 2026, or, if the cycle stretches, even until late 2026 – early 2027 😉
⁉️ But here’s the key question — where will the new money come from?
Because liquidating traders for $30–50B and then handing out “cashbacks” of $400–500M… that’s laughable 🐔
And expecting a March 2020-style buyback again? Unrealistic.
👉 Back then, people were locked at home, got freshly printed $, and instantly sent them to exchanges 💵
That was a real injection of fresh blood into the market — hundreds of billions.
Now? Nothing like that… or not yet 😉
🤔 What do you think — will a new wave of liquidity appear soon, or does the market still need more pain before the next leg up?
______________
◆ Follow us ❤️ for daily crypto insights & updates!
🚀 Don’t miss out on important market moves
🧠 DYOR | This is not financial advice, just thinking out loud

Solana Cup w/ HandleFor some reason everyone is bearish on SOL right now.
Breakpoint coming up.
Falling Wedge for the handle.
I'll see you at $400 bears.

BTCUSDT.P - November 11, 2025BTCUSDT.P is showing potential for a short-term bearish continuation after breaking below the ascending trendline support near $105,300. The pair has lost upward momentum, indicating potential downside movement toward the $103,530 partial profit zone and the $102,039 profit level. A stop level is positioned around $107,473–$107,714, marking the invalidation area for this bearish setup.
Risk Assessment: Moderate — The breakdown from trendline support favors further downside, but a sustained recovery above $105,600–$106,000 could signal a failed breakdown and shift sentiment back toward bullish consolidation.

BTCUSDT.P - November 13, 2025BTCUSDT.P has formed a consolidation base above $101,600, indicating accumulation and potential for further upside toward the $103,685 partial profit zone and the $105,297 profit level.
A decisive close above $103,700 would confirm bullish momentum continuation, while failure to hold above $100,700 could expose the pair to renewed selling pressure toward $99,200.
Risk Assessment: Moderate — The price structure suggests potential bullish recovery from oversold levels, but the setup remains vulnerable to downside continuation if support near $100,700–$100,000 fails to hold. Traders should consider moving stops to breakeven once the $103,685 level is reached to manage risk effectively.

BTC - The Best Gartley Reversal of ALL TIME??This Stuff is happening pretty quickly, trades need to enter, there isn't much time...I suspect...
This 1 hour Bullish Gartley is lining up perfectly to a reversal here. If this doesnt hold, a larger correction will form in a Crab. Lets see...

BTC/USD 4H chart 🧭 1️⃣ Market structure
• We see a clear upward channel (black trend lines) - the price has been moving within it for several days/weeks.
• Current price: ~USD 101,630, which is just above the lower border of the channel (dynamic support).
• Latest high: ~$107,360 - this is local resistance.
• Final low: ~$99,000 - this is key psychological and technical support.
➡️ Medium-term trend: still upwards, but currently in a downward correction wave 📉 3️⃣ Technical indicators
🔸 Stochastic RSI (bottom panel)
• Both components (blue and orange lines) are close to the oversold zone (<20).
• This is a signal that sellers may be losing momentum, and a rebound from the lower support is possible in the coming hours.
⸻
⚖️ 4️⃣ Short-term scenarios (4H – 1D)
🟢 Bull scenario (probability around 60%)
• The rate remains above USD 101,400 (lower border of the channel).
• Stochastic RSI begins to rebound → buy signal.
• Potential move up to:
• USD 103,900 (first target)
• USD 105,900 (second target)
• USD 107,300 (main resistance)
➡️ Scenario invalidation: 4H candle close below USD 101,000.
⸻
🔴 Bear scenario (probability approx. 40%)
• Breakout of the USD 101,000 level with a 4H close below.
• Decline to $99,000-99,200 zone (major support).
• If this support breaks, next goals:
• $97,800
• $95,000
⸻
📊 5️⃣ Technical signal (4H)
➡️ Decision Zone: $101,000-$101,800
➡️ Technical signal: possible short-term rebound (RSI oversold, close to channel support).
➡️ Confirmation: 4H candle closing above USD 102,000 with volume - then a chance of a move to USD 104-106k.

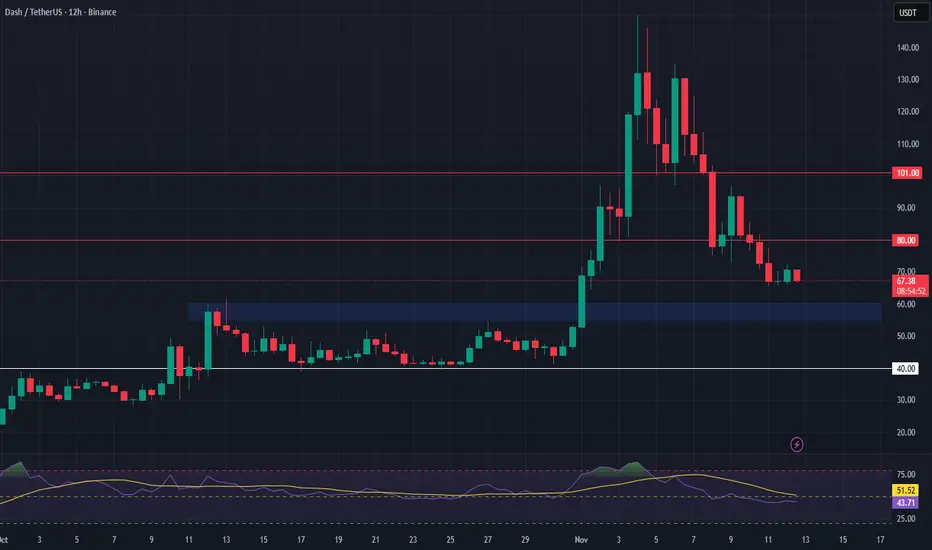
DASH – Watching for a Higher Timeframe ReversalWe’re looking for DASH to pull back and test the next major support zone before potentially reversing its trend back to the upside. This setup provides an opportunity to position early for a long spot trade once confirmation appears.
Trade Setup:
• Entry Zone: $55 – $60
• Take Profit Targets:
🥇 $80
🥈 $101
• Stop Loss: $40
$BTC - Market Update BINANCE:BTCUSDT | 8h
Key Levels:
local support: 102k
local resistance: 107k
After briefly dipping to $102k, Bitcoin rebounded toward $105k as U.S. shutdown concerns eased and risk appetite improved. However, if price forms another lower high and stalls again below the 107k resistance, momentum could quickly fade once more.
Holding 102k would be the first real sign of bulls slowly reclaiming control — but a clean break below that key support would likely open the door for another leg down toward the 94–90k zone.

BTC - Fear & GreedAs Bitcoin falls below $100,000, now is a good time to check the Fear & Greed index to map out the sentiment around the move, and to compare similar scores at other places in this bull run move.
As painful as it may be, buying the fear and selling the green is an effective strategy. Every local bottom since the start of 2023 has had a F&G score below 50:
Jan 26th 2023 - 26
March 10th 2023 - 34
June 14th 2023 - 46
Sept 11th 2023 - 40
July 7th 2024 - 29
Aug 5th 2024 - 26
Sept 6th 2024 - 22
Feb 26th 2025 - 21
March 10th 2025 - 20
April 8th 2025 - 24
Today - 16
As of writing the current fear and greed score is lower than it has been for nearly three years!
What is important to note is that bullish momentum has faded but structure remains (higher lows + higher highs). IF the pattern continues then this is a good place to buy historically, obviously that does not guarantee the same pattern will continue to play out but if the bull market is still alive then this level usually gets a bullish reaction.
The timing also adds another layer of complexity as the US Government shutdown is ending. Bitcoin is super reactive to liquidity, once the shut down began it is clear liquidity did drop resulting in price falling. This correlation implies an expected rise in liquidity and Bitcoins price along with it.
For the bears the target area is $89,000-$92,000. In my opinion this will cap the downside at least temporarily.

Bitcoin topped versus Gold 11 months ago.On the bright side the cyclical bear market of #BTC vs #GC is actually closer to the end, rather than just starting.
Bitcoin has already lost tremendous value vs the Analog SOV
With previous cyclical Bears lasting maximum 14 months.
Which by that time I believe one if not both of these targets will be met.
The troubling aspect is.
If BTC achieves target 2 --- then once could argue a Double top has formed.
And any subsequent bounce/recovery rally should be treated with suspicion.
And furthers declines and retest of this target 2, could open up the trapdoor for a SECULAR Bear market taking us into 2027 before any meaningful recovery can begin.
This is a merely observation of what has happened and what is currently unfolding with early (pre-coinbase launching) BTC investors unloading supply most of 2025 into their perceived six figure objective.
$100K was always the dream!
Will they buy back next bear?
I suspect only if it becomes cheap enough.
What is cheap for an OG?

BTC: The Key Buyer Zone Lies Even LowerThe 89,256 level remains a relevant demand zone across all timeframes — from monthly to daily. The 86,000–79,500 area is the key volume zone where a long-term buyer is most likely to appear.
Hello, traders and investors!
This analysis is based on the Initiative Analysis (IA) method.
Let’s take a look at the Bitcoin monthly chart and identify the zones where a buyer is likely to appear.
The last buyer initiative began at 74,508 and ended at 126,199.
The 50% level of this initiative — 100,353 — was already tested in November.
The key candle (marked on the chart as KC, the candle with the highest volume within the buyer initiative) sits at the base of the move.
Notably, this key candle formed as a manipulation (false breakout) of the 89,256 level.
For this reason, the 89,256 level remains highly relevant on the monthly timeframe — this is a zone where a long-term buyer may reappear.
During that manipulation, the key volume was accumulated in the 86,000–79,500 range (!).
On the weekly chart, the 89,256 level is also important — it represents the previous lower boundary of the weekly range, which is still relevant.
On the daily chart, this level remains meaningful as well, since it is an untouched target from the previous daily range (marked with a red line).
Thus, the area around 89,256 — together with the volume zone 86,000–79,500 — is a strong candidate for finding long setups.
Wishing you profitable trades!

ETH/BTCHere is the range I'm looking at for the ETH/BTC pair. A bounce in this box means buying Ethereum will be more profitable than Bitcoin.

Total Crypto Marketcap --- PLan Your Exit#TOTAL Crypto has already doubled from it's bear bottom, to it's most recent high.
We are almost in 2024, well into crypto summer now
time is really running out to prepare your portfolio for the inevitable Bull market euphoria phase.
I bring this chart up just to remind everyone, that this cycle has potential to be one of the worst in terms of multiple expansions we have seen so far.
We have gone from exploding 340X in one cycle.. to 33X the last cycle.
I expect this time round it will be a single digit multiplier.
We have to hope and pray we do indeed break the previous ATH , and we don't double top at 3 trillion.. of which there is no guarantee!
My realistic target is around 5 Trillion Dollars, which may sound pessimistic at only 3.5X from here ... but that means your Altcoins adding at least a Trillion dollars of value from here!
Optimistically i'm looking at around 7 trillion dollars, no mean feat!
BTC.d at 30% would equal BTC 2.1 Trillion or $110k per coin.

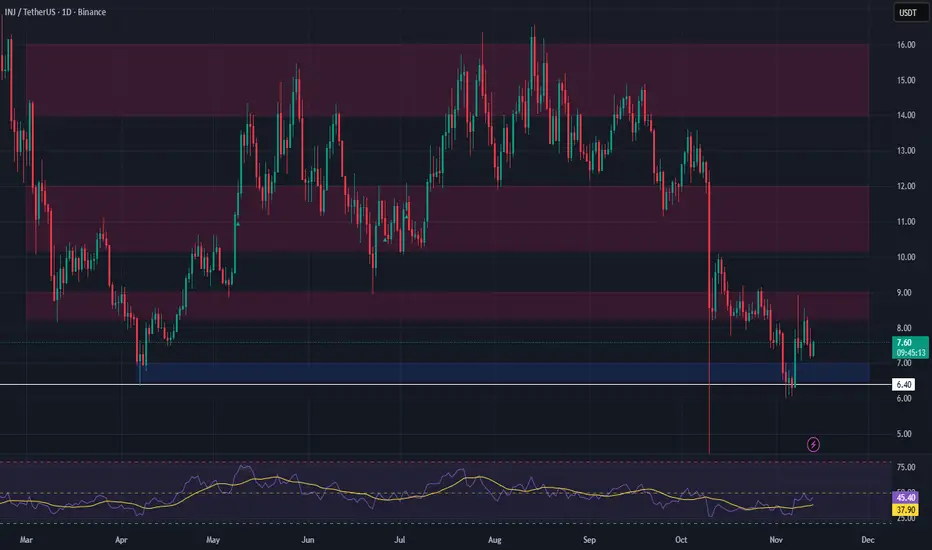
INJ Bullish Swing Setup: Higher Low Formation at Key SupportInjective (INJ) has made a strong impulsive move up, showing significant bullish strength in recent sessions. Price is now pulling back and appears to be forming a higher low, a classic swing continuation pattern in trending markets. This correction offers a potential long opportunity for traders anticipating the next leg higher.
📍 Entry Zone: $6.50 – $7.00
🎯 Take Profits:
• TP1: $8.25 – $9.00
• TP2: $10.20 – $12.00
• TP3: $14.00 – $16.00
🛡️ Stop Loss: Just below $6.40
Fractal Range Analysis (FRA) for Bitcoin (11/13/25)Fractal Range Analysis for BTC (11/13/25): At ICE (AVWAP) & under microtrend support. Look for short consolidation in this area as buyers attempt to hold the ICE (102.8). If not, we are falling back to 99K for SCLX mitigation. See video for details.
