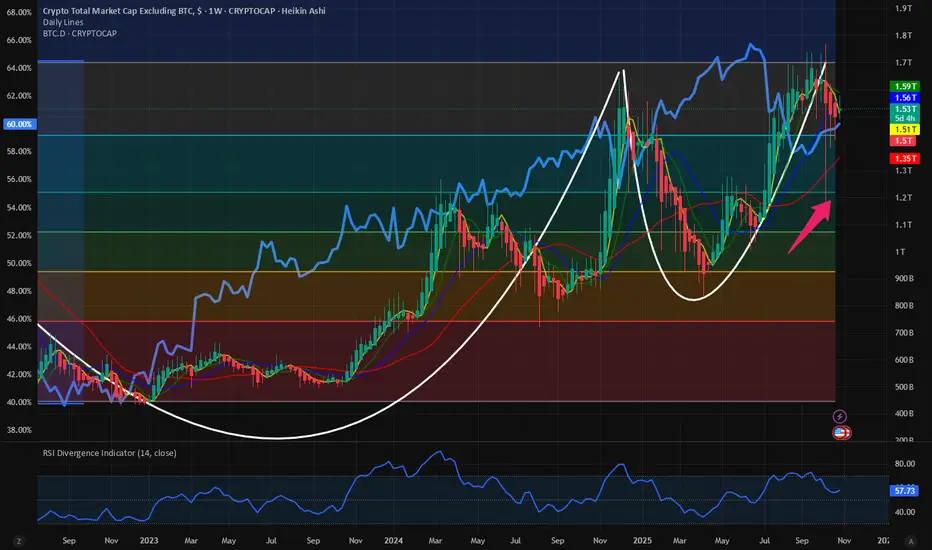
$TOTAL2 failed breakout. $BTC.D higher. Altcoins look weak.After the Oct 10th liquidation event in the crypto markets has left a significant mark in the overall Crypto markets. After the 16 Bn $ liquidation the momentum in the Altcoins has been broken and the Bitcoin Dominance has started its upward journey. In this space I have always maintained my position that the CRYPTOCAP:BTC.D has already had its cycle peak @ 66%.
CRYPTOCAP:BTC.D : Cycle tops are in. CRYPTOCAP:ETH.D : Bounce form the all-time lows for CRYPTOCAP:BTC.D by RabishankarBiswal — TradingView
Since then the CRYPTOCAP:BTC.D made a local low of 58%. Afetr the Oct 10th liquidation event the CRYPTOCAP:BTC.D is slowly creeping up and now it is already @ 60% which has been the majot reason behind the CRYPTOCAP:TOTAL2 failying to break above the Cup and handle pattern we have been follwing since months. We had set an interim target of 2.7 T $ in the CRYPTOCAP:TOTAL2 market cap. This indicates an upside of 60% from the current levels. These targets seems improbable to me with only a few months left in the cycle. In my opinion it will be an achievement if we can even achive the previous cycle highs of 1.71 T $ which is 12% higher from current levels. This needs a major upside in the BITSTAMP:ETHUSD Follow me here for more on BITSTAMP:ETHUSD price targets in the upcoming weeks.
Trade Set Up : CRYPTOCAP:TOTAL2 target revised downward to 1.71 T $ from 2.7 T $. CRYPTOCAP:BTC.D @ 66% remains as a hurdle. Final push higher by CRYPTOCAP:BTC.D before cycle ends.
BTC-D
Potential bearish drop off?The Bitcoin (BTC/USD) is reacting off the pivot, which is a pullback resistance and could reverse to the 1st support, which is a pullback suport.
Pivot: 117,517.82
1st Support: 106,827.77
1st Resistance: 125,464.41
Disclaimer:
The above opinions given constitute general market commentary, and do not constitute the opinion or advice of IC Markets or any form of personal or investment advice.
Any opinions, news, research, analyses, prices, other information, or links to third-party sites contained on this website are provided on an "as-is" basis, are intended only to be informative, is not an advice nor a recommendation, nor research, or a record of our trading prices, or an offer of, or solicitation for a transaction in any financial instrument and thus should not be treated as such. The information provided does not involve any specific investment objectives, financial situation and needs of any specific person who may receive it. Please be aware, that past performance is not a reliable indicator of future performance and/or results. Past Performance or Forward-looking scenarios based upon the reasonable beliefs of the third-party provider are not a guarantee of future performance. Actual results may differ materially from those anticipated in forward-looking or past performance statements. IC Markets makes no representation or warranty and assumes no liability as to the accuracy or completeness of the information provided, nor any loss arising from any investment based on a recommendation, forecast or any information supplied by any third-party.

AVAX/USDT – Watching for a Major Support Retest Before ReversalAVAX has been pulling back from recent highs, and we’re now eyeing the $15.00 – $16.50 zone as a critical support area. This level has acted as a strong demand zone historically, and a clean retest here could signal a potential reversal on higher time frames. We are waiting for confirmation before considering any long positions.
📍 Trade Setup (Spot)
Entry Zone: $15.00 – $16.50 (only after support confirmation)
Take Profit Targets:
TP1: $27.00 – $31.50
TP2: $36.00 – $41.00
Stop Loss: Below $13.80

Bitcoin Rally Heating Up – Watch This Zone Carefully!As the new week kicked off, Bitcoin ( BINANCE:BTCUSDT ) started to climb, fueled by a pump in the S&P500 index ( SP:SPX ) and the creation of a gap in the S&P500 index.
It seems Bitcoin has successfully broken above the 100_SMA(Daily) and 50_SMA(Daily) , as well as a Resistance zone($114,300-$113,000) .
In fact, Bitcoin has also formed a new CME Gap($113,495-$110,990) due to this S&P500 Index -driven surge.
Right now, Bitcoin is approaching the next key Resistance zone($118,740-$115,740) , Potential Reversal Zone(PRZ) , the Cumulative Short Liquidation Leverage($117,577-$116,731) , and the upper line of an ascending channel .
From an Elliott Wave perspective , by breaking this Resistance zone($114,300-$113,000) , Bitcoin has entered a new phase of wave counting. It appears to be completing microwave 4 of the main wave C . Overall, the corrective structure seems to be a Zigzag Correction(ABC/5-3-5) with an expanding leading diagonal in main wave A .
I expect that in the coming hours, after a pullback to the broken Resistance zone($114,300-$113,000) and those moving averages , Bitcoin might rise again at least up to the Potential Reversal Zone(PRZ) . There's a possibility of forming a larger ascending channel, but since we haven't confirmed a second top, we can't rely on that channel just yet.
Note: In general, the crypto market in the past couple of weeks has been heavily influenced by news around U.S.-China tariffs. Any headline can cause Bitcoin and other tokens to swing up or down, so keep an eye on those geopolitical headlines.
Cumulative Long Liquidation Leverage: $113,625-$112,175
Cumulative Long Liquidation Leverage: $106,033-$104,090
Note: If Bitcoin falls below the moving averages and the Resistance zone($114,300-$113,000) again, we can expect further declines.
Please respect each other's ideas and express them politely if you agree or disagree.
Bitcoin Analysis (BTCUSDT), 2-hour time frame.
Be sure to follow the updated ideas.
Do not forget to put a Stop loss for your positions (For every position you want to open).
Please follow your strategy and updates; this is just my Idea, and I will gladly see your ideas in this post.
Please do not forget the ✅' like '✅ button 🙏😊 & Share it with your friends; thanks, and Trade safe.

BTC Enters Breakdown Area — Volume Could Push Back Below $110KBTC Enters Breakdown Area — Volume Could Push Back Below $110K ⚠️
The previous volume that took BTC before 101K has some trends of this volume, which has a manipulation views, the volume before that did took BTC below 101K ended with a fakeout.
Bitcoin has entered the breakdown area, showing early weakness as price struggles to hold momentum near $115K.
The recent volume spike looks more like distribution pressure than accumulation, signaling that a correction phase could be forming.
📉 Current outlook:
Breakdown zone between $116.3K – $109.7K is active.
Volume is rising, but without strong upward continuation — a sign of selling absorption.
If this pattern holds, BTC could retest the $110K zone or drop slightly below in the next move.
📊 Observation:
The market is testing the upper side of the breakdown range but lacks follow-through.
A close back under $114K would confirm weakness and invite further downside momentum.
💬 Summary:
BTC is inside its breakdown area, and current volume suggests pressure may build to drive price back below $110K if buyers fail to reclaim control soon.

BITCOIN to 160kAccording to the 2 parallel long-term trend-lines , there is a chance the top one at 160k work as resistance again like 2024

Bitcoin Breakout or a Deeper Rest Ahead ?👋🏻 Hey everyone! Hope you’re doing great! Welcome to SatoshiFrame channel.
✨ Today we’re diving into the 4-Hour Bitcoin analysis. Stay tuned and follow along!
👀 We’re looking at Bitcoin on the 4-hour timeframe. Bitcoin is currently in a bullish correction and awaiting tomorrow’s news. It’s worth noting that this upward correction is happening below the key resistance level at $115,555. A breakout above this zone could allow Bitcoin to continue the bullish leg it has already started.
🧮 Looking at the RSI oscillator, Bitcoin’s momentum previously entered the overbought area but has now exited and is oscillating below the 70 zone, which now acts as the current resistance level.
✔️ Let’s pay closer attention to Bitcoin’s trading volume — as price approached its major resistance, volume increased. However, given the upcoming news, this wasn’t enough to break resistance, and Bitcoin was rejected from that zone, pulling slightly downward. This downward move isn’t very strong and is accompanied by weak corrective momentum.
✍️ The current Bitcoin scenarios have been updated — you can now focus more closely on these scenarios in the next part of the analysis.
🟢 Long position scenario: A breakout above the key resistance level at $115,555, combined with rising buy volume and an RSI swing above the 70 zone, could mark the end of the correction and continuation of the bullish move.
❤️ Disclaimer : This analysis is purely based on my personal opinion and I only trade if the stated triggers are activated .

DIA enters breakdown trendDIA has officially entered a breakdown phase after losing its key short-term structure and falling back into the breakdown volume zone.
The sharp rejection from the $0.86 level triggered heavy selling pressure, confirming a shift in short-term trend momentum.
📉 Current outlook:
Price is now consolidating between $0.60 – $0.38 within the breakdown range.
Volume is elevated, suggesting distribution rather than accumulation.
Unless DIA reclaims $0.65+, the trend remains bearish.
📊 Observation:
This move resembles a post-hype correction where early buyers exit and liquidity thins out.
The next key level to monitor for reaction sits near $0.38 support — a potential short-term base if selling slows down.
💬 Summary:
DIA is currently trading in a breakdown trend, with risk leaning to the downside until structure rebuilds above $0.65.

BTC/USDT: Symmetrical Breakout and Channel ContinuationHi guys!
Bitcoin has successfully broken out of a symmetrical triangle, confirming a bullish continuation pattern after several days of consolidation. The breakout was followed by a clean retest of the triangle’s upper boundary, which now acts as support.
Currently, the price is moving inside a rising parallel channel, showing a healthy bullish structure with higher highs and higher lows. As long as BTC maintains above the midline of this channel, the short-term trend remains upward.
In the coming sessions, price may continue oscillating within this ascending channel, forming a series of higher lows before reaching the next key resistance around $118,682 , and potentially extending toward the triangle’s measured target at $122,56 7.
On the downside, a confirmed close below the channel’s lower line would be the first sign of weakening momentum and could lead to a deeper pullback toward $112,000–$113,000.
Important levels:
Support: $114,000 / $112,500
Resistance: $118,682 / $122,567
Trend: Bullish above $114,000

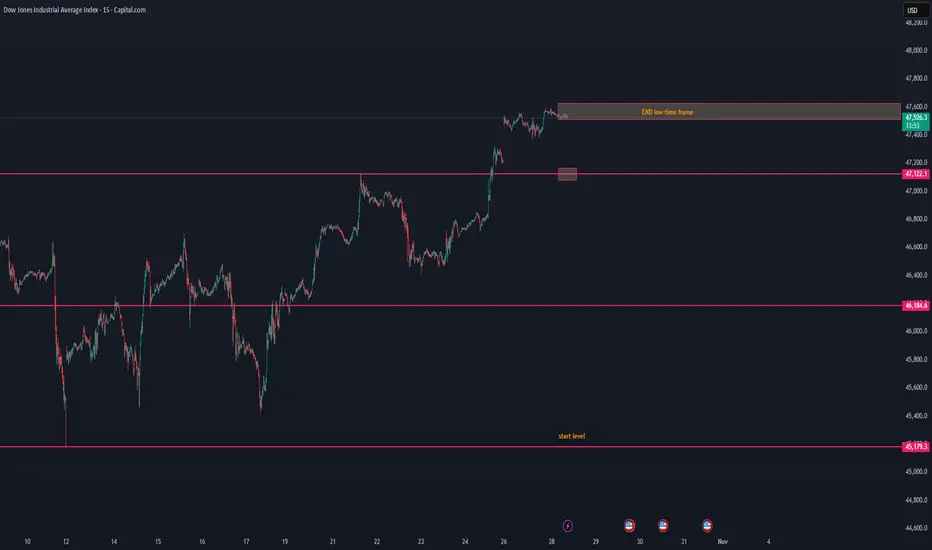
US30 lost its low time frame — possible breakdown aheadUS30 lost its low time frame — possible breakdown ahead ⚠️
US30 has lost its low time frame structure, showing early signs of weakness after the recent push to 47.5K.
The current price action suggests that momentum is fading, and sellers may start to take control.
📉 Short-term view:
Structure break below 47.5K zone confirms loss of bullish control.
The next visible support area sits around 47.1K, followed by 46.1K.
With time, price could continue to drift down toward the start level near 45.1K if buyers fail to defend.
📊 Observation:
Volume has started to cool off, and price is trading below the short-term EMA range — a typical setup before a gradual downward retrace.
💬 Summary:
US30 lost its low time frame momentum and looks to break down step by step toward the start level zone. We’ll monitor if buyers can react near 47.1K or if this becomes a broader correction phase.
BTC USD (T)🟢 Main scenario (healthy correction and continuation of growth)
The price is pulling back to the EMA50 / EMA100 (around 113.4k–112.8k).
In this zone — especially near 112.8k — you can look for long confirmations such as a pattern, volume spike, or false breakout downward.
After a rebound, the next targets are: 115.5k → 116.3k (Weekly High),
If this level breaks — a possible move toward 117k–118k.
🔴 Less likely, but possible scenario (deep correction)
If the price consolidates below EMA100 (≈112.8k),
the move may deepen toward the Equilibrium zone (111.0–110.5k).
There will again be a chance for a strong long entry, but only after confirmation.

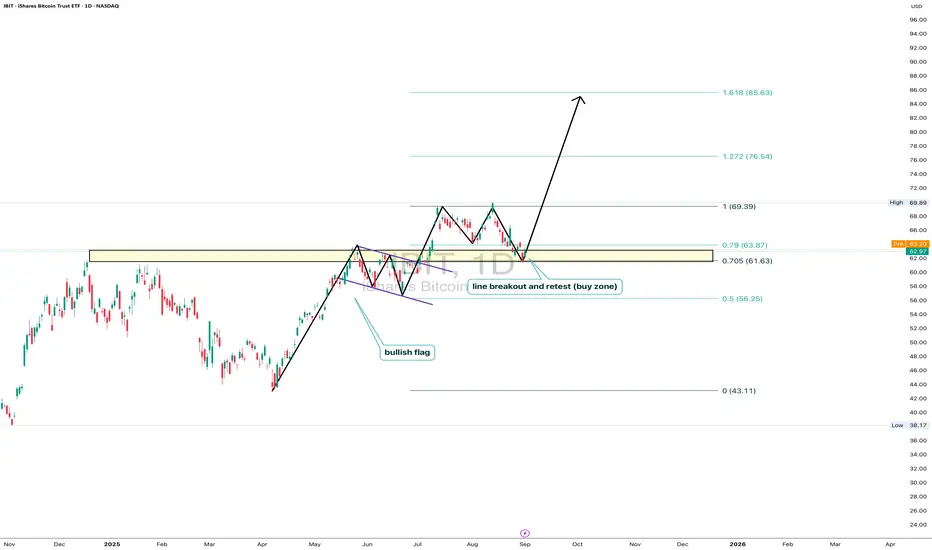
IBIT: ready for liftoffOn the daily chart, iShares Bitcoin Trust (IBIT) trades at $62.97, testing the key 0.705–0.79 Fibo zone ($61.63–63.87). This area marks a breakout and retest line, forming a clear buy zone. The technical structure remains bullish: after breaking out and pulling back, price holds potential to move toward $69.39, with Fibo extensions targeting $76.54 and $85.63. Volumes confirm buyer activity on dips, and the bullish flag pattern supports the continuation of the upward trend.
Fundamentally , the main driver is bitcoin itself, with institutional demand for BTC ETFs staying strong. Large funds continue accumulating positions, while expectations of a softer Fed tone add pressure on the dollar, fueling capital inflows into crypto. This strengthens the bullish case for IBIT.
Tactical plan: watch $61.6–63.8 as the key entry zone. Holding above opens the path toward $69.3, followed by $76.5 and $85.6. The scenario breaks only if price falls below $61.
And let’s be honest: IBIT isn’t just a ticker - it’s the “accelerate bitcoin” button for your portfolio.
Bearish reversal off major resistance?The Bitcoin (BTC/USD) has rejected off the pivot and could drop to the 1st support, which is a pullback support.
Pivot: 109,139.03
1st Support: 109,172.55
1st Resistance: 119,893.62
Disclaimer:
The above opinions given constitute general market commentary, and do not constitute the opinion or advice of IC Markets or any form of personal or investment advice.
Any opinions, news, research, analyses, prices, other information, or links to third-party sites contained on this website are provided on an "as-is" basis, are intended only to be informative, is not an advice nor a recommendation, nor research, or a record of our trading prices, or an offer of, or solicitation for a transaction in any financial instrument and thus should not be treated as such. The information provided does not involve any specific investment objectives, financial situation and needs of any specific person who may receive it. Please be aware, that past performance is not a reliable indicator of future performance and/or results. Past Performance or Forward-looking scenarios based upon the reasonable beliefs of the third-party provider are not a guarantee of future performance. Actual results may differ materially from those anticipated in forward-looking or past performance statements. IC Markets makes no representation or warranty and assumes no liability as to the accuracy or completeness of the information provided, nor any loss arising from any investment based on a recommendation, forecast or any information supplied by any third-party.

Red Alert !... ETH got rejected at the topHi guys,
If you zoom out of ETH you'll notice that its moving sideways on the Weekly/Monthly chart
Which can be bullish or bearish at the same time BUT recently we've seen the price gets rejected at the top of the sideways channel on three different monthly candles which is a red alert in my book.
Now I'm not saying that its going down a 100% but not breaking out of the channel is a very bad sign and could mean the signal for a major drop to the lows of the channel.
Not to mention the 4 years cycle of bitcoin is due and all realistic traders are expecting Bitcoin to drop to the previous all time high at 69000$ and if that happens all alt coins will go down too.
Crypto twitter is insanely bullish (very bad sign) and almost all big markets including US stock market and Gold are at all time high and extreamly over valued so don't listen to the greedy social media or the news and listen to reason and common sense here.
Risk management is advised so stay safe out there and let me know what do you guys think my this.

$BTC — CME Gap Fill First?CRYPTOCAP:BTC | 4h
We pushed all the way into this internal range liquidity 116k.
Price is hovering in short-term consolidation after tagging local resistance, showing early signs of exhaustion as momentum starts to fade.
Watching this lower timeframe demand, either bounce or fill that cme gap at 112.6–112k before another 117–118k upthrust.

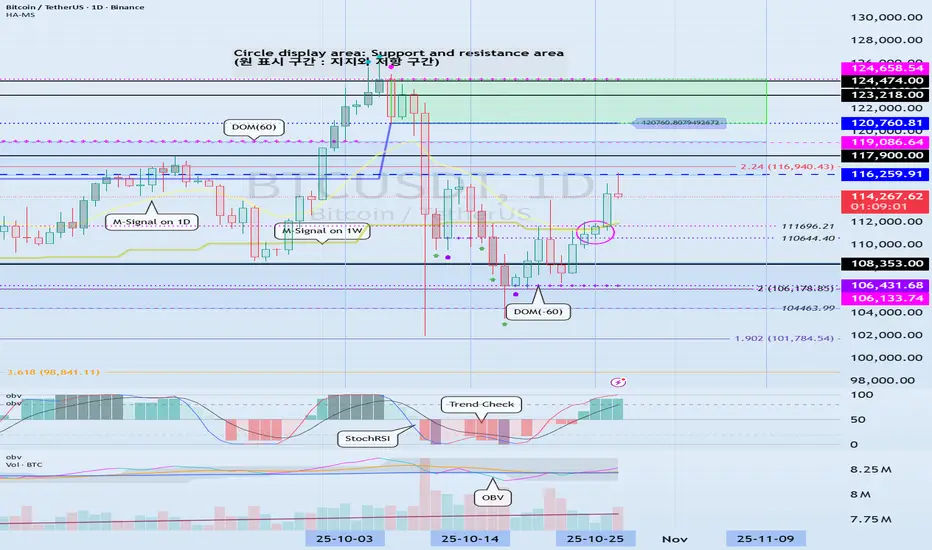
Examples of Chart Interpretation Methods
Hello, fellow traders!
Follow us to get the latest information quickly.
Have a great day!
-------------------------------------
#BTCUSDT
To break above a key point or range and continue the uptrend,
1. The StochRSI indicator must be trending upward. Ideally, it should not enter the overbought zone. 2. The On-By-Signal (OBV) indicator must show an upward trend. If possible, it should remain above the High Line.
3. The TC (Trend Check) indicator must show an upward trend. If possible, it should remain above the 0 level.
Currently, only the TC indicator satisfies the above conditions.
Therefore, if the price remains above the 110644.40-111696.21 range and the above conditions are met, we should see if the price rises above 116259.91 and remains there.
If the On-By-Signal (OBV) indicator remains above EMA 1 and EMA 2 and rises above the High Line, further upside is likely.
However, if the K indicator of the StochRSI indicator enters the overbought zone and the slope changes, the upside may be limited.
When the TC (Trend Check) indicator touches its highest point, there's a high probability of forming a new high, so you should consider a response plan.
Summary of the above:
Support Zone: 110644.40-111696.21
Resistance Zone: 116259.91-119086.64 (up to 124658.54)
------------------------------------
#ETHUSDT
As mentioned in the BTC chart description, ETH is also showing similar movements.
However, the OBV indicator is just about to break above EMA 1 and EMA 2, so if it finds support near 4109.80, there's a possibility of further upside.
-------------------------------------
#ZECUSDT
Based on the BTC chart description, ZEC is likely to continue its upward trend.
The chart is broken due to the sudden surge, making it difficult to determine the duration of volatility.
--------------------------------------------
#XRPUSDT
The key is whether the price can find support at key support and resistance levels and rise above 2.9092.
------------------------------------------
Ultimately, trading will be based on the support and resistance levels drawn on the 1M, 1W, and 1D charts.
However, it is recommended to use auxiliary indicators to confirm whether to initiate a trade.
The basic trading strategy is to buy in the DOM(-60) ~ HA-Low range and sell in the HA-High ~ DOM(60) range.
However, if the price rises in the HA-High ~ DOM(60) range, a step-up trend is likely, while if the price falls in the DOM(-60) ~ HA-Low range, a step-down trend is likely.
Therefore, a fractional trading strategy is recommended.
In this context, the coin (token) currently closest to buying is XRP.
-
Thank you for reading to the end.
I wish you successful trading.
--------------------------------------------------
BTC/USD 1h short-term🧭 General context
• Bitcoin price is ~$114,470.
• The short-term trend remains upwards, which is confirmed by the black trendline.
• The last upward impulse brought the price from ~ USD 111,000 to ~ USD 117,000.
• Currently, the price is testing the support zone after a short correction.
⸻
📊 Key technical levels
• Resistances (green):
• USD 117,815 – local peak, strong resistance (potential TP for longs).
• USD 116,545 – medium resistance, possible retest in the short term.
• $115,518 – lower resistance, bulls decision point.
• Support (red):
• USD 114,667 – currently tested level (important intraday support).
• USD 113,545 – another strong support (close to trendline).
• USD 111,915 – the limit after which the upward trend may reverse.
⸻
⚙️ Trendline
• The trend line runs from approximately USD 110,000 and connects subsequent lows.
• The price is currently close to the trendline, so:
• Rebound → continuation of the upward trend,
• Breakout → possible decline to 113,500 or lower (up to USD 111,900).
⸻
📈 Oscillator (Stochastic RSI)
• It is located close to the oversold zone (approx. 8 p.m.).
• This means that the market is close to a potential rebound - a bullish signal (if the %K and %D lines cross upwards).

BITCOIN CLEAR REJECTION|SHORT|
✅BTCUSD made a liquidity grab above the previous high, price sharply rejected from the 4H supply area, confirming a fakeout and shift in order flow. The market structure suggests redistribution, with inefficiency below acting as the draw on liquidity. Expect short-term delivery toward $114,000. Time Frame 4H.
SHORT🔥
✅Like and subscribe to never miss a new idea!✅

LTC: long position!The month of trading proved to be good (LTC).
The general trend shows an increase in prices, with the last buy signal being given in the range of 92-94 USDT, after which the price continued to move up to the current level of about 102.39 USDT

BITCOIN SIGNAL: SHOCKER TARGET REVEALED!!! (warning) Yello Paradisers! Enjoy the video!
And Paradisers! Keep in mind to trade only with a proper professional trading strategy. Wait for confirmations. Play with tactics. This is the only way you can be long-term profitable.
Remember, don’t trade without confirmations. Wait for them before creating a trade. Be disciplined, patient, and emotionally controlled. Only trade the highest probability setups with the greatest risk to reward ratio. This will ensure that you become a long-term profitable professional trader.
Don't be a gambler. Don't try to get rich quick. Make sure that your trading is professionally based on proper strategies and trade tactics.

BTC $115,200 TARGET BREAKOUT: The Ultimate Long SignalThe Logic Behind $115,200: This analysis pinpoints the critical multi-year resistance/supply zone at $115,200. A confirmed close above this level is the ultimate trigger for the next parabolic leg up in the Bitcoin cycle. Our proprietary provides a filtered, no-noise signal specifically for this major breakout level. Key Features: * Precision Entry: Alerts only on the confirmed breach of the 115,200 supply * Risk Management: Includes projected Take Profit 1 & 2 targets * Filtered Noise: Uses to validate the move Action: Set your alerts and prepare for liftoff! The market structure dictates that this level is make-or-break for a new All-Time High pursuit.

Bitcoin Analysis 4 HoursBitcoin Time Frame 4 Hours
Currently between two 4-hour balances
Supports 114 and 112 and resistances 118 and 120
Liquidity ranges are characteristic
As long as we are above the green balance, we tend to rise, especially since the bearish balance (red) has not yet pulled back and for further correction and low liquidity hunt, we bet on a 4-hour candle below 111, so for now, there is more upside and pullback with buyer support in the market for resistances

BTCUSD SELL IDEACurrent price: around $114,976
Recent structure: The price made a CHoCH after forming a lower high around $115,600, signaling a potential shift from bullish to bearish momentum.
BOS confirmation: A break of structure downward confirms sellers taking control.
Supply zone: A red zone above ~$115,400–$116,000 shows a bearish supply area, where price could retrace to before continuing lower.
Expected move: A short-term pullback (retracement) toward ~$115,200–$115,400 before a continuation down toward the demand zone near $113,200–$112,800.
📉 Sell idea summary:
Bias: Bearish
Entry zone: ~$115,200–$115,400 (after retracement)
Target: ~$113,200
Stop loss: Above ~$115,600
