BTC: buyers have brought the price back into the range.This analysis is based on the Initiative Analysis (IA) method.
Hello traders and investors!
On the 4-hour timeframe, the buyer has brought the price back into the range and absorbed the seller’s attack bar at the lower boundary.
A buyer initiative is developing on the 4H chart, with a target at 93,160.
It’s possible that buyers will manage to break the upper boundary of the range, which is currently at 93,836.
On the daily timeframe, the price touched the 89,256 level, and a new range is starting to form. Within this range, the nearest seller target is 89,253.
Key levels for potential long setups are buyer defenses at 89,253 and 86,116.
Sellers can look for short setups if the upper boundary of the range is defended by the seller on the 4-hour timeframe, with a target at 89,256.
Wishing you profitable trades!
Btc-e

Bitcoin is testing 89,000. False breakout?Bitcoin is testing 89,000
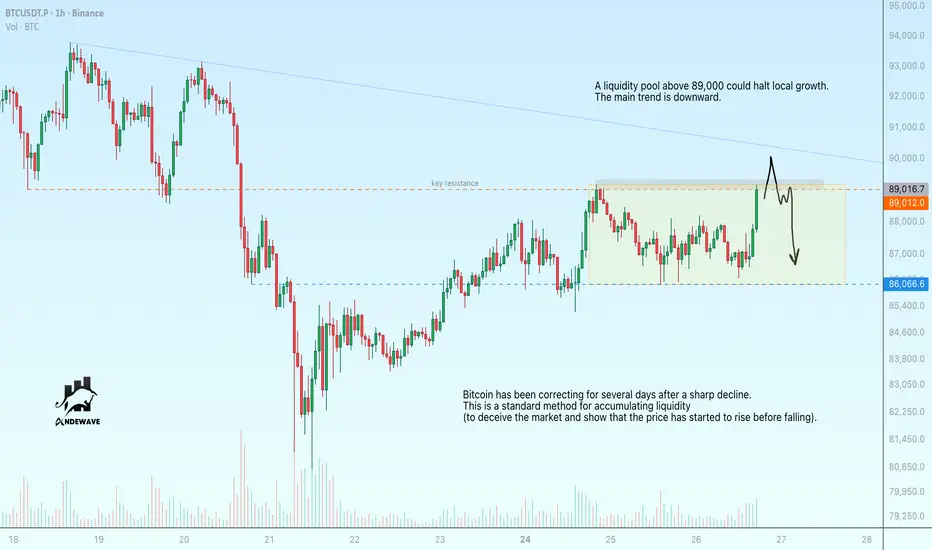
A liquidity pool above 89,000 could halt local growth. The main trend is downward.
Bitcoin is undergoing a correction over several days after a sharp decline.
This is a standard tactic for accumulating liquidity (to deceive the market and show that the price has started to rise before falling).
A false breakout could reverse the local movement from upward to downward and send the price to 86K-83.5K
BTC Bounce Looks Corrective – Bottom Not In Yet1. Recap of My Last BTC Outlook (5 November)
In the 5th November analysis, I noted that the 106k support zone was under pressure, and if that level failed, the next meaningful target would be 90k — because 100k, despite being psychological, should not offer much after technical break.
That played out perfectly:
- 106k failed
- 100k offered nothing but a small rebound
- BTC dropped straight into the 90k zone
And then continued even deeper, almost touching 80k before rebounding
We’re now trading around 87,500, after a textbook corrective bounce.
2. Is the Bottom In?
➡️ In my opinion, no. Definitely not.
And here’s where I apply my usual contrarian filter:
Whenever I start hearing the same voices saying the same thing —
“Bitcoin bottom is in! Bitcoin up only!”
— I immediately become cautious.
These are the same people who never consider the other side of the market.
A broken compass can show the right direction once in a while, but it’s still broken.
3. Technical Picture – Nothing Bullish Here
- Yes, the bounce from 80k is normal and expected.
- Yes, BTC can easily retrace 10–15k after a large drop.
- But nothing in the current structure suggests a meaningful bottom.
What we have right now is:
- A classic corrective rebound
- Weak impulse
- No break back above of important resistance
- No reversal pattern
- No shift in market bias
It looks exactly like what price should do after a violent leg down — not like a new bull trend.
This is the type of rebound where retail screams “moon,” but professionals simply prepare for another sell.
4. My Outlook – Bearish Until BTC Reclaims 100k With Conviction
My plan is simple and level-driven:
Preferred Sell Zone:
- 92k → This is where I want to sell, ideally on a weak rally
Downside Targets:
- 80k → Recent low and first logical stop
- 75k → Major structural support and second target
Bearish outlook is invalidated ONLY if:
➡️ BTC reclaims 100k with conviction (not a wick, not a temporary spike)
Until that happens, every rally is a potential shorting opportunity.
5. Conclusion – Still Bearish, Despite the Bounce
BTC has done exactly what it was supposed to do:
- Drop to 90k
- Overshoot to 80k
- And bounce in a corrective manner
Nothing about this price action signals a bottom.
If anything, it signals more downside ahead — once the corrective rally into 92k completes.
Bias: Bearish
Approach: Sell rallies
Invalidation: Break and hold above 100k with conviction
Until then, the narrative “bitcoin up only” remains a meme, not analysis. ⚠️

BTCUSDT.P - November 27, 2025On the 15-minute chart for Bitcoin, price is in a strong short-term uptrend, marked by a steep series of higher highs and higher lows culminating in a parabolic push into local resistance around 91,800–92,300. The latest candles show upper wicks and a loss of follow-through, indicating fading bullish momentum and the risk of a pullback. A corrective move toward the nearest intraday support band around 89,700–90,100 would be a normal retracement within the broader advance, and aggressive longs may look to reduce risk while conservative traders wait for a reaction at that support zone before re-entering.

USDJPY Just Broke Out — Early Trend Reversal or Fake Strength?1. Market Structure – Dow Theory Perspective
On the H1 chart:
- Price has consistently printed Lower Highs – Lower Lows, forming a descending channel.
- The most recent move shows:
+ A higher low (HL) forming at the bottom of the channel
+ A clear break of structure (BOS) at the upper trendline
This signals a transition phase, where sellers are losing momentum and buyers are starting to dominate.
According to Dow Theory:
➡ A trend changes when the market forms a higher high followed by a higher low.
USDJPY is currently in that exact phase.
2. Breakout Confirmation
The breakout from the channel is valid because:
✔ The candle closed above the trendline
✔ Volume increased slightly on breakout
✔ Price retested the broken structure (blue arrow) and bounced cleanly
This adds strong confirmation that the breakout is not a fakeout.
3. Key Zones to Watch
🔹 Support Zone
Located around the lower channel and green zone — this is the origin of the bullish rejection. As long as USDJPY holds above this zone, the bullish scenario remains intact.
🔹 Strong Resistance Zone
Marked at the top of the chart — multiple liquidity pools exist here. TP2 and TP3 align with these resistance levels.
4. Bullish Scenario – Primary Outlook
After the breakout, the market is expected to follow a classic break → retest → continuation pattern:
🎯 TP1: 156.832
First liquidity target — where the first wave of profit-taking is likely.
🎯 TP2: 156.984
A stronger resistance level — aligns with prior price congestion.
🎯 TP3: 157.200+
Located at the strong resistance zone.
If buyers maintain momentum, this is the final upside extension.
This aligns perfectly with bullish structure + breakout momentum.
5. Technical Summary
-Breakout from descending channel ✔
- Higher low formation → early trend reversal ✔
- Retest confirmation ✔
- Clear upside liquidity targets ✔
Everything aligns with a bullish continuation scenario for USDJPY.
🔥 Conclusion
USDJPY has broken out of its descending channel, signaling a potential short-term bullish reversal. As long as price holds above the retest area, the market favors an upward move toward TP1 → TP2 → TP3.
This is a clean structure-based opportunity for trend traders and breakout traders alike.

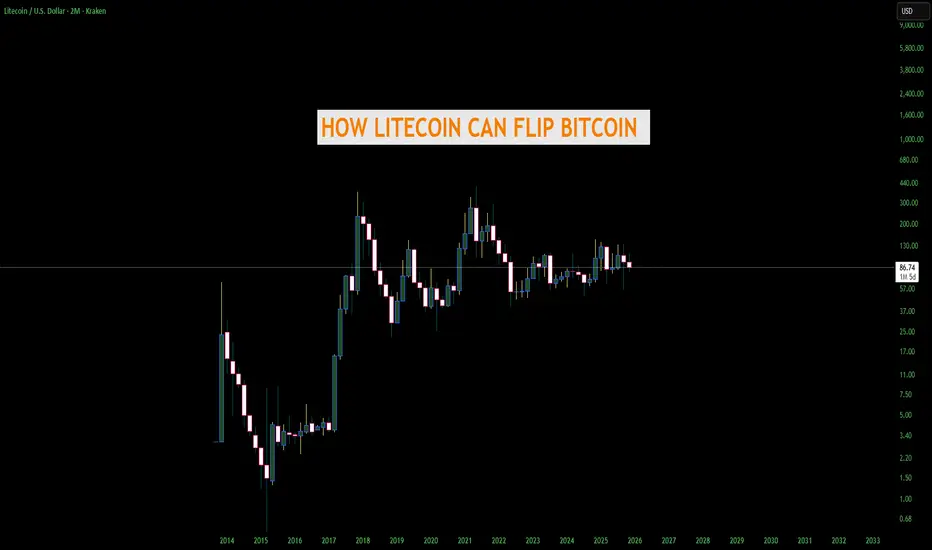
THE DAY LITECOIN FLIPS BITCOIN AND BECOMES #1 - AND HOWGrok helped me with this but regardless this is a great read. Not financial advice
1. Bitcoin fees explode again (> $50–$200 per transaction)
LTC stays under 5¢ and 4× faster → merchants & users flee to “digital silver” for actual payments
-Historical precedent: May 2017 & Dec 2017 fee madness → LTC pumped from $4 → $375 in weeks; repeated in May 2021 → $410 ATH
2. Bitcoin blocks stay full for months (Ordinals / Runes / BRC-20/ and now unlimited SPAM clog the chain again)
People rediscover Litecoin as the cheap, fast, on-chain alternative that actually works for daily spending
-Historical precedent: 2023–2024 Ordinals era → LTC quietly 3×–4× while BTC was practically unusable for small amounts
3. Major nation/state bans or heavily restricts Bitcoin mining or self-custody
LTC is smaller, less of a political target → miners add Scrypt rigs, capital rotates
-Historical precedent: China 2021 mining ban → Litecoin hashrate and price both spiked hard in the following months
4. A confirmed 51% attack or large double-spend actually happens on Bitcoin
Trust in BTC’s immutability shatters overnight → Litecoin (merged-mined with Dogecoin) suddenly has higher combined attack cost and looks safer
-Historical near-miss: 2018–2019 51% attack fears on smaller chains sent LTC up +150% in pure rotation plays
5. Credible quantum-break announcement or real progress scare (2026–2030 timeline moves up)
Litecoin’s MWEB addresses are already quantum-resistant + dev team can soft-fork faster than Bitcoin’s politics allow
-Historical precedent: 2023–2024 quantum FUD alone gave privacy coins and quantum-ready projects 3–10× pumps
6. Litecoin ETF (e.g., Canary Capital's) faces post-launch outflows or SEC-mandated tweaks due to BTC ETF dominance, while Bitcoin ETFs pull in record inflows
BTC ETFs become the unchallenged "institutional safe bet," capping BTC's retail upside → sidelined investors, retail traders, and altcoin funds rotate into the now-proven LTC ETF as the "next logical step" for legacy alts (with Canary/Grayscale already live and showing strong early volume)
-Historical precedent: ETH ETFs in 2024 saw initial outflows vs. BTC's inflows → ETH still 2–3×'ed on rotation; SOL's 2025 ETF launch pumped despite similar early teething issues
7. Lightning Network suffers major centralization scandals, hub failures, or routing collapses
People remember Charlie Lee’s original pitch: simple, fast, cheap, on-chain money with no layer-2 headaches
-Historical precedent: 2023–2025 Lightning UX complaints repeatedly drove spikes in LTC daily transaction volume and price
8. Bitcoin loses the “first-mover narrative” to a new nation-state adoption
Example: a major country (Brazil, Argentina, Indonesia, etc.) announces it will use Litecoin instead of Bitcoin for remittances or reserves because LTC is 4× faster and 100× cheaper.
-Precedent: El Salvador 2021 BTC adoption pumped Bitcoin; a “Litecoin country” would do the same or more for LTC.
9. PayPal, Venmo, Cash App, or Stripe re-activates Litecoin for instant zero-fee withdrawals/deposits
They all supported LTC years ago and dropped it only because of 2018 bear market. One click to flip it back on → instant 50–100 million new users.
-Precedent: PayPal adding BTC in 2020 → +300 % pump in weeks; LTC would explode harder because it’s actually usable on their rails.
10. Dogecoin merges fully with Litecoin (merged-mining → full auxiliary chain)
-Precedent: DOGE pumps in 2021 dragged LTC up 4–6× every single time. A real technical merger would be 10× stronger.
11. Major exchange or custodian loses billions in Bitcoin (think FTX 2.0 but only BTC exposed)
Users rush to self-custody the one big coin that still has sub-$0.01 fees and 2.5-minute confirmations → Litecoin.
-Precedent: FTX collapse 2022 → LTC was one of the only coins people could actually withdraw fast and cheap.
12. SEC or European regulator classifies Bitcoin as a “security” or “commodity with special rules” but explicitly says Litecoin is a commodity/currency
Institutions that were forced to sell BTC rotate the exact same thesis into LTC overnight.
-Precedent: XRP SEC case resolution in 2023 caused instant 3× pump; same mechanics.
13. Bitcoin Core development stalls or splits again (Blocksize Wars 2.0)
Big-blockers and users frustrated with ossification move money and hashrate to the chain that kept Charlie Lee’s original “faster, lighter” vision alive.
-Precedent: 2017 Bitcoin Cash hard fork → LTC price went parabolic as the “peaceful middle ground.”
14. Global remittance giants (Western Union, MoneyGram, Wise) quietly switch backend rails to Litecoin
They already tested LTC in 2017–2019. A single press release announcing “instant global transfers for pennies” using Litecoin would add billions in real volume.
-Precedent: Ripple/XRP partnerships in 2018 caused 10× pumps even when adoption was tiny. Real adoption would be insane for LTC.
Bulls Will Take BTC to 100k Then Become Leftover Turkey Dinner!Trading Fam,
First things first, Happy Thanksgiving to my U.S. followers. I hope your holiday is blessed as you enjoy time with friends and family.
Let's get to the chart.
As noted numerous times in previous posts, BTC is now in a longer-term bearish trend. There are many indicators that have shown us this.
Our first signs came when my indicator flashed a rare sell signal
This coincided with the third touch of our Pi Cycle Top Trendline
It also formed what I thought at the time might be the "spring" of our Wyckoff Market Cycle pattern
After these first three important indicators flashed, I waited for a drop below the support (RED descending TL) of our bearish megaphone pattern. That happened.
Finally, we almost synchronized that drop with the drop below our 350 SMA
I have a target down of 72-76k. We almost reached that but we were stopped by 80k support. That RED ascending TL prints on the weekly starting with one of our tops in April of 2021!
We bounced off of this trendline, using it as strong support. It should be and I expected this bounce! Now, I am expecting we should go to at least 100-102k. Even that is a very underwhelming target. I will NOT be impressed at all if the bulls should succeed at hitting it. This, at least, should be expected!
If we don't hit that target, I will be wrong about how bearish I should have been. Even the "Buy the Dip" Viagra being sold by all these whales as exit liquidity will not have worked for these bulls. What a disappointment they will have become! And my target of 72-76k will still be in play.
But you can all see that I have a question mark there. See, the thing is, what happens when Michael Saylor's Microstrategy goes underwater? Microstrategy owns nearly 650k BTC at an avg cost of 74.5k. Current strategy is: issue shares → raise debt → buy BTC → repeat. If BTC falls below 74.5k it could become: buy back shares → lower debt → sell BTC → repeat. If this occurs, BTC could drop even further. My next serious support is not found until around 46k! Therefore, we have to keep a serious eye on this area of 72-76k if we do in fact visit it.
Now, if bulls do beat 102k and then 110k after that, I think I can admit I was wrong. I missed my downside target by a whopping 4k! I will admit defeat even though I was a small fraction of a coin off. Honestly, I hope I am wrong. I hope the market is revived and Santa gives you all the profit you ever wanted for the Christmas season. But the grinch in me thinks not.
So, play this rally as you like. Personally, I think it's an early gift to some of you who were not expecting this or just didn't believe it would occur. You now have your second chance to exit. This is a contrarian view. I know. But think about who might be propagating the "Buy the Dip" memes. I alluded to it above. If I were a whale and wanted to exit without crashing the market how would I best do this? Ding, ding, ding. That's right. I'd market the hell out of "Buy the Dip". It would become the meme of the hour. Retail would buy it up and hopefully provide the exit liquidity I need. This might be my only way out if I were looking for it.
Something to think about.
✌️Stew

QUICK ANALYSIS (1H) — BTC BOUNCED FROM RESISTANCE✅ 1. Breakout from the downward trendline
On the chart, I see:
a yellow downward trendline—it has been broken,
the candlestick dynamically breaks through it and closes above it.
➡️ This is the first signal of a shift in momentum to upward.
✅ 2. Price is testing the 200 SMA (blue)
BTC is currently:
touching the 200 SMA,
bounces slightly downward—a classic reaction to strong resistance.
➡️ Until we break through the 200 SMA, the market remains in a downtrend.
🟩 3. Nearest resistance levels (green levels on your chart):
90,400 USDT – current resistance (reaction already visible)
92,500 USDT – next important level
93,200–94,000 USDT – strong supply zone
94,900 USDT – strong level from previous bounces
➡️ The closer the price gets to 94–95k, the greater the chance of a downward rebound.
🟥 4. Nearest support levels
From your red levels:
88,700 USDT – first level of defense
87,500 USDT – key support
85,500 USDT – major local bottom
84,150 USDT – extreme support
➡️ If BTC returns below 87.5k, the correction will deepen.
📊 5. RSI — Neutral-Bullet
RSI ~ 55,
Not yet overbought,
RSI trend is increasing.
➡️ There is room for further upward movement.
📉 6. MACD — Bullish Signal
MACD has crossed the signal line upward,
the histogram is rising.
➡️ Upward momentum, shorting here is risky.

Downside protected, upside unprotected — BTC to 500kThere's a ton of intriguing action unfolding with Bitcoin right now. Several cycle low indicators I track have started firing off around the $80K mark—pretty wild if you ask me. Let's break them down step by step.
1. 2-Week RSI Signal
It's a straightforward fact: the two-week RSI is sitting at 42, a level that has consistently marked cycle lows in the past. So, at $80K, we've got our first major cycle low signal.
2. Fear & Greed Index
Historically, after a cycle top, the first wave down has driven the Fear & Greed Index to a reading of 10 in the last two cycles.
The rest of the time? It's signalled cycle lows or major bottoms ahead of massive rallies.
#### What This Means: History Rhyming (Again)
This setup screams repetition—Bitcoin has now topped out after exactly 1,064 days, mirroring the last two cycles. On this first corrective wave, Fear & Greed has already plunged to 10. But here's where it gets really telling: layer in the Sharpe ratio for some nuance.
As the chart shows, the Sharpe ratio has dipped into negative territory—a rare event that *only* occurs during true cycle lows.
Invalidation & Bear Market Confirmation
The chart makes it crystal clear: Bitcoin is primed to echo the last cycle's playbook, with a full rejection at the 0.382 Fibonacci retracement. In the prior two cycles, after the initial drop from the cycle high, any subsequent rally completely fizzled out right there at 0.382.
If Bitcoin fails to rally and close decisively above that level by mid-January 2026, the odds skyrocket for a full-blown bear market. Keep an eye on it—this could be the pivot that defines the next leg.
What do you think then?
500k or 67k by October 2026?
Still fully on the upside boat. Risk is heavily skewed to the top side, not down

Bitcoin Corrected, What’s Next?Back in July, I did a tutorial identifying the 120,000 level as a potential peak for Bitcoin, with the possibility of an open correction. Bitcoin subsequently formed a double top before pulling back to its recent low.
In my view, Bitcoin should continue to trend along this parallel channel.
We will discuss why this is the case, and also what may come next for Bitcoin after this correction.
Mirco Bitcoin Futures and Options
Ticker: MBT
Minimum fluctuation:
$5.00 per bitcoin = $0.50 per contract
Disclaimer:
• What presented here is not a recommendation, please consult your licensed broker.
• Our mission is to create lateral thinking skills for every investor and trader, knowing when to take a calculated risk with market uncertainty and a bolder risk when opportunity arises.
CME Real-time Market Data help identify trading set-ups in real-time and express my market views. If you have futures in your trading portfolio, you can check out on CME Group data plans available that suit your trading needs www.tradingview.com

MSTR long-term TAStrategy is strictly bearish, and it's been bearish since the end of September, there's no bottom as of yet, it's hard to tell when will it stop falling, the blue lines is an approximate channel for consolidation but we need more time to see.
Due to excessive selling it may have a small jump in a short-term but it needs way more time to stop falling.

SOL to Bottom Out Around $103-104SOLANA – Eyes on the Final Flush? 🔥 Key Confluence at $103–$104
Solana is approaching what might be the most important support zone of this entire macro structure. Several major technical factors are all pointing to the same potential bottom area:
🟢 1. Head & Shoulders Breakdown Target
The measured move from the H&S pattern puts the projected downside right into the $103–$104 zone, creating a textbook target alignment.
🟠 2. Long-Term Trendline Support (Orange)
Price is now dropping toward a multi-year rising trendline that has held since early 2024.
This line has acted as major dynamic support across multiple cycles, and SOL is now coming back to retest it.
🟣 3. Fibonacci 0.886 Retracement
The 0.886 retrace of the full macro move lands perfectly in the same area.
This fib level is often where deep retracements reverse during strong bullish expansions.
📉 Current Structure
– Breakdown from right shoulder confirmed
– Momentum still down, but seller exhaustion showing up
– Volume declining on the drop → typical late-stage correction behavior
📌 Key Zone to Watch
$103–$104 (Green Box)
This is my “high-probability reaction zone” where I expect Solana to bottom or at least produce a significant bounce.

TradeCityPro | Bitcoin Daily Analysis #232👋 Welcome to TradeCityPro!
Let’s dive into the Bitcoin analysis. This week has been a range-bound week for Bitcoin, and this range still continues.
⏳ 1-Hour Timeframe
The market conditions haven’t changed much compared to yesterday. Bitcoin has simply continued its range-bound movement.
⚡️ We had a resistance zone at 89,000, which the price had previously touched. In the subsequent move, the price has not been able to reach this level again, indicating a lack of buying strength.
🧩 Considering the decrease in volume and the weakening of the red candles, the chances of reaching 89,000 in this leg are quite low.
💥 The RSI oscillator has reached the momentum support zone for the price at 41.31.
🎲 If this level is broken, we can say that the bullish momentum will completely disappear, and the market will need to form a new structure.
✅ The loss of bullish momentum does not necessarily mean the end of the uptrend or the beginning of a downtrend. It simply means that the market’s momentum has faded, and we will need to wait and see what happens in the new structure.
💡 If the RSI stabilizes below this level, we can open a short position after breaking 85,770 and a long position after breaking the 89,000 level.
📊 However, if the RSI maintains its momentum and gets supported, we can enter a position earlier with the trigger at 87,942.
✨ The 87,942 trigger is considered risky, so I recommend paying attention to the volume. If the volume confirms the move, you can open the position after the breakout.
❌ Disclaimer ❌
Trading futures is highly risky and dangerous. If you're not an expert, these triggers may not be suitable for you. You should first learn risk and capital management. You can also use the educational content from this channel.
Finally, these triggers reflect my personal opinions on price action, and the market may move completely against this analysis. So, do your own research before opening any position.

Bitcoin Target 60K - Here's why (...you should hedge now)🔱 Bitcoin is behaving like a model student when it comes to the fork framework. 🔱
The first re-test at the white centerline, followed by a drop down to the red centerline, and then to the white lower median line parallel was already impressive. And the story isn’t over yet!
In the past days we’ve seen a re-test at the white L-MLH. Bitcoin failed to trade its way back into the fork. That leaves further price losses as the likely outcome.
The next targets are:
👉 the 1/4 level at around 76,000
👉 the white warning line at about 70K–72K
👉 the final move to the red L-MLH at around 60K
This decline would go hand in hand with continued sell-offs in the major indices like the Nasdaq and S&P 500. It would also support my previous post regarding a massive rise in TLT.
(props to @coinwide for the heads-up!)
🚨 A hedge would be appropriate now, before the VIX ignites its rocket and option prices explode.
Wish you all the best out there!

Ethereum Outlook: Downtrend Nearing Exhaustion?The crypto market continues to slide, with Ethereum struggling to regain footing. While the short-term trend remains bearish, we may be closer to the end of this decline than the start. Still, wide price swings are likely, and traders should remain cautious.
🔻 Key Breakdown
Ethereum has lost the critical $3,300–$3,400 support, which now flips to resistance. This zone had been a strong base, and its loss introduces technical headwinds that could limit near-term upside.
📉 Next Support to Watch
The $2,600–$2,800 range is the next major support. A test of this zone could offer clues about trend exhaustion or continuation.
🔮 2026 Outlook Still Bullish
Despite the short-term weakness, the macro view hasn’t changed. We expect Ethereum to revisit all-time highs by 2026, with the potential to test the $6,000 area.
📌 Stay focused on key levels and watch for signs of reversal before assuming a bottom is in.

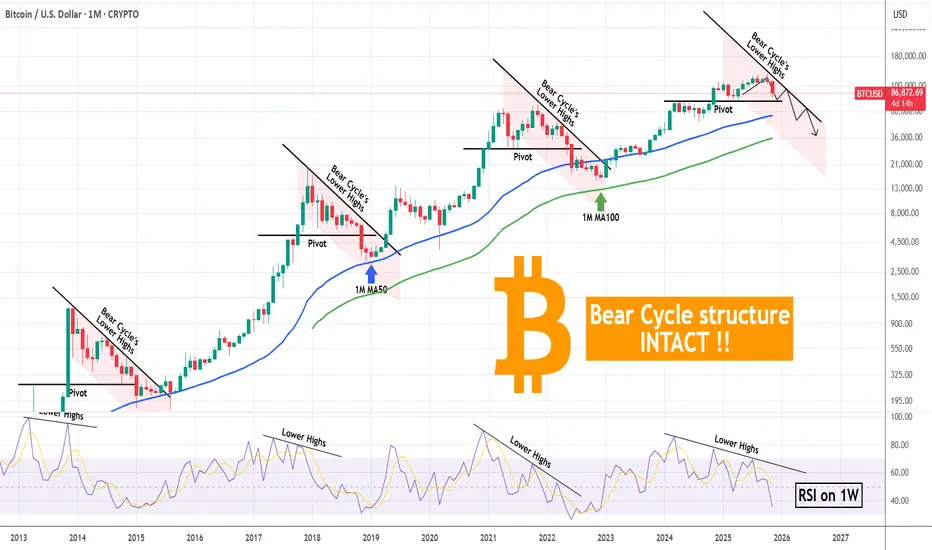
BITCOIN structure follows all previous Bear Cycles. Be prepared.Bitcoin (BTCUSD) is experiencing a short-term rebound, whose possibility of taking place we discussed last week. This rebound can technically test and get rejected on a trend-line that all previous Bear Cycles did, the Lower Highs trend-line.
As you can see, that trend-line has been present during all cyclical corrections, essentially being the Bear Cycle's natural Resistance level. Basically the whole structure of every Bear Cycle has been similar, displaying also a Pivot trend-line, which was either a previous High or a Support and once broken, strong sell-off continuation towards the Cycle's bottom. The first two Cycle's (since 2014), bottomed on their 1M MA50 (blue trend-line), while the last one near the 1M MA100 (green trend-line).
Right now the market almost hit that Pivot and a short-term rebound and rejection on the Lower Highs trend-line, may initiate Phase 2 by February 2026.
Notice also the similar 1W RSI Lower Highs structure among the Bear Cycles, being a Bearish Divergence early call for the Bull Cycle Top.
Based on all the above, it shouldn't be surprising if BTC bottoms near or on its 1M MA100 this time also, even though (as explained on previous analyses), it would be a good idea to start buying after roughly $60000 breaks.
So do you think the Bear Cycle structure of the previous years will be repeated? Feel free to let us know in the comments section below!
---
** Please LIKE 👍, FOLLOW ✅, SHARE 🙌 and COMMENT ✍ if you enjoy this idea! Also share your ideas and charts in the comments section below! This is best way to keep it relevant, support us, keep the content here free and allow the idea to reach as many people as possible. **
---
💸💸💸💸💸💸
👇 👇 👇 👇 👇 👇
Bitcoin BTC Bearish Momentum: My Trade Plan ExplainedI’m keeping a close eye on Bitcoin (BTC) right now. On the 4H timeframe, price action remains firmly in a sustained bearish trend. I’m anticipating a possible continuation to the downside.
If BTC holds at the current level and fails to retrace into the imbalance highlighted on the 1H chart — and we see a bearish rotation with a clean break in market structure — I’ll be watching for a potential short setup.
⚠️ Not financial advice.

BITCOIN bounceBitcoin broke down from the long-term rising wedge and now could bounce to around 110k before deciding whether to go higher or enter a new bear market.

Bearish momentum to conninue?Bitcoin (BTC/USD) has rejected off the pivot which acts as a pullback resistance and could drop to the pullback support.
Pivot: 89,628.69
1st Support: 81,683.82
1st Resistance: 93,927.62
Disclaimer:
The opinions given above constitute general market commentary and do not constitute the opinion or advice of IC Markets or any form of personal or investment advice.
Any opinions, news, research, analyses, prices, other information, or links to third-party sites contained on this website are provided on an "as-is" basis, are intended to be informative only, and are not advice, a recommendation, research, a record of our trading prices, an offer of, or solicitation for, a transaction in any financial instrument and thus should not be treated as such. The information provided does not involve any specific investment objectives, financial situation, or needs of any specific person who may receive it. Please be aware that past performance is not a reliable indicator of future performance and/or results. Past performance or forward-looking scenarios based upon the reasonable beliefs of the third-party provider are not a guarantee of future performance. Actual results may differ materially from those anticipated in forward-looking or past performance statements. IC Markets makes no representation or warranty and assumes no liability as to the accuracy or completeness of the information provided, nor any loss arising from any investment based on a recommendation, forecast, or any information supplied by any third party.

IREN charges up after the pullbackThe price of IREN pulled back to the lower boundary of the expanding channel and touched the 100 period moving average on the 8 hour chart. The 48 zone acted as support earlier and buyers are showing interest there again. A base is forming. A breakout above 62 can activate movement toward 76 and later 100 where the next expansion target sits.
IREN operates large scale data centers and high performance computing infrastructure including bitcoin mining and enterprise hosting. The key advantage of the company is access to low cost renewable energy which keeps hash rate costs low and allows stable scaling.
The fundamental picture on November 26 remains stable. The company continues to expand its data center capacity. Leverage stays low. The bitcoin network maintains strong activity which supports revenue. Hash rate competition increases but operators with cheap energy access like IREN gradually strengthen their market position.
As long as the price stays above the 48 zone and above the 100 period moving average the recovery structure remains valid. A confirmed move above 62 opens the path to 76 and then 100 . A move below 48 will return price to deeper consolidation.
Even miners need a pause to recharge but after such pullbacks energy normally returns very quickly.

Bitcoin Bull TrapDo not get fooled by this trap that is underway in BTC. Trump will start QE again soon in early December which will cause BTC and stocks to rise which will either form a head and shoulders pattern or a double top. I believe this rally will fail once Inflation starts to rise rapidly and possibly cause a spike in the 10-year interest rates. I think Nvidia and the Tech stocks crash once people realize they are "cooking the books" and lying about earnings. I believe the Fed will also finally stop with-holding important economic data from the public after the Government shutdown and will really get this market down trending. Possible swing trades to the upside are possible but if you are a longer term investor and do not want to ride this wave down I definably recommend getting out and be ready to pull the trigger on an Inverse BTC ETF. After this crash plays out fortunes will be made in the next bull run.

BTC: Buyer Zone Holds the PressureDaily buyer zone shows a successful test; 2H chart points to active buyer initiative with a target at 88,519.
This analysis is based on the Initiative Analysis (IA) method.
Hello, traders and investors!
On the daily timeframe, a buyer zone has formed at the end of the seller initiative. Yesterday, this buyer zone was tested by a seller bar on declining volume, which looks more like a test rather than active selling.
On the 2-hour timeframe, we have a sideways range with an active buyer initiative, and the nearest target is 88,519.
Yesterday, the seller attempted to push the price lower on increased volume, but the move stalled within the key volume area (87,000–86,000) of the daily buyer candle — the candle that formed the buyer zone on the daily chart.
Wishing you profitable trades!

BTC Cup and Handle Still Not CompleteAs you can see the SPX broke out of the cup and handle and completed the measured move. It then corrected back down to the top of the handle and resumed its uptrend. This is what is coming for Bitcoin. Bitcoin has only half way completed the cup and handle. Measured move to around 300k before correcting back down to 70k and then back off to the races. Hold onto your hats. That would be the most epic move of all time a straight shot from here to 300k no pullback then slam back down to 70k and then back up to 500k. Could happen fast dont underestimate Bitcoin.
Just my opinion not financial advice.
