XRP back to flying?XRP giving big confirmations for a reversal. Let's see if it can breaks the RESISTANCE before new years and achieve new highs for new years.
Btc-e

BTCUSDT.P - November 24, 2025Bitcoin recently formed a short-term ascending channel, showing improving momentum after a strong prior selloff. Price is currently consolidating near 86,900, with key support at 85,900 and 84,400, and resistance at 88,100 and 91,900. A breakout above 88,100 would signal additional bullish momentum toward 91,900, while any failure to hold above the rising trendline could trigger a retest of lower support levels. The current structure suggests neutral to slightly bullish momentum in the immediate term.

BRIEFING Week #47 : Monthly Reversal in ?Here's your weekly update ! Brought to you each weekend with years of track-record history..
Don't forget to hit the like/follow button if you feel like this post deserves it ;)
That's the best way to support me and help pushing this content to other users.
Kindly,
Phil

The Bitcoin Cycle: A guide to time the next major entryBitcoin could be approaching a cycle low in the next 3-9 months.
Zooming in on the weekly chart, you'll see that price tends to develop a horizontally defined resistance *after* hitting a cycle low and consolidating. Once price breaks out from that resistance, it triggers a buy signal. This is the type of action I want to see to get long with size.
On the topic of cycles, I'll use a paragraph from the first book I read that got me interested in financial markets.
From CYCLES: The Mysterious Forces That Trigger Events
How can one tell, in any given instance, whether or not a
regular rhythm that one discovers is caused by a real underlying
force or merely by chance? Let's begin with some common sense
and simple logic. If a cycle has repeated enough times, with
enough regularity and with enough strength, the chances are that
it is significant. Such regularity cannot reasonably be mere accident.
Bottom line: A cycle's reliability is based on how well it repeated that cycle in the past. I will assume the cycle in this post remains in play, and will use it as my guide to help time the next major entry. The key thing is to enter based on a signal rather than buy just because price is in the cycle low range. The cycle just adds to the weight of evidence and helps with timing - it is NOT the signal.

BTC prediction end of november 2025 I think we have reach the bottom and now it will go upwards to the upper green dotted line.
I hope this will be right 💪🏻🧑🎄🎄
Happy XMas trading for everyone 😇

Up to 200% on NTRNI hired NTRN today. For this token, the second half of the quarter opened above the 0.035 support, which gives a clear signal for growth. The first large investments have been made in recent days, but a stable trend can be expected by the end of the year with an attempt to consolidate in the range of 0.0750-1000. The main resistance is the 0.050-55 range. So far, it has not been taken against the background of a bearish trend that has gained a foothold on the indicators. Starting next week, the indicators will allow stable growth. If a new monthly candle opens above 0.05, further purchases will not be long in coming. The token has fallen to an extremely oversold position due to binance's speculation with the issue data. The actual number of tokens in circulation is still significantly lower, which gives great growth potential.
I'm also considering TURTLE CHESS HOOK VIC BMT MITO for work.

Crypto Total McapCrypto Total Mcap based ABCD correction. The first move was already predicted successfully - luck :)

TradeCityPro | Bitcoin Daily Analysis #229👋 Welcome to TradeCityPro!
Let’s dive into the Bitcoin analysis. Today, the market has made a deeper upward correction and is moving towards higher resistance levels.
⏳ 1-Hour Timeframe
After the downward move to the 82,214 zone, Bitcoin started a range and correction phase, and yesterday, it ranged between 82,214 and 85,209.
✨ After the price began to correct, a higher low was formed at 83,680, which allowed buyers to show some strength, and now the price has stabilized above 85,209.
✔️ This upward move continued to the 0.382 Fibonacci level, which I consider to be the first resistance level Bitcoin has reacted to.
⭐ If the price starts to drop from here and can stabilize below the 85,209 level, bearish momentum will return to the market, and we can get the first confirmation of a new downward wave.
🧮 The main confirmation for the start of this new wave will come after breaking the 82,214 level. Until then, any short position we open will be an early trigger.
🎲 Overall, Bitcoin has a very large support zone on the weekly timeframe, and this zone is between 75,000 and 90,000, where the price is currently located.
🔭 As long as the price is in this range, all positions are risky. Personally, I will reduce my risk, as traders’ win rates tend to decrease in such range-bound areas.
📊 For long positions, it’s still too early. I will wait until the price stabilizes above 89,604. This will be the first sign of buyer strength. The main confirmation for the bullish trend will come after stabilizing above 93,555.
❌ Disclaimer ❌
Trading futures is highly risky and dangerous. If you're not an expert, these triggers may not be suitable for you. You should first learn risk and capital management. You can also use the educational content from this channel.
Finally, these triggers reflect my personal opinions on price action, and the market may move completely against this analysis. So, do your own research before opening any position.

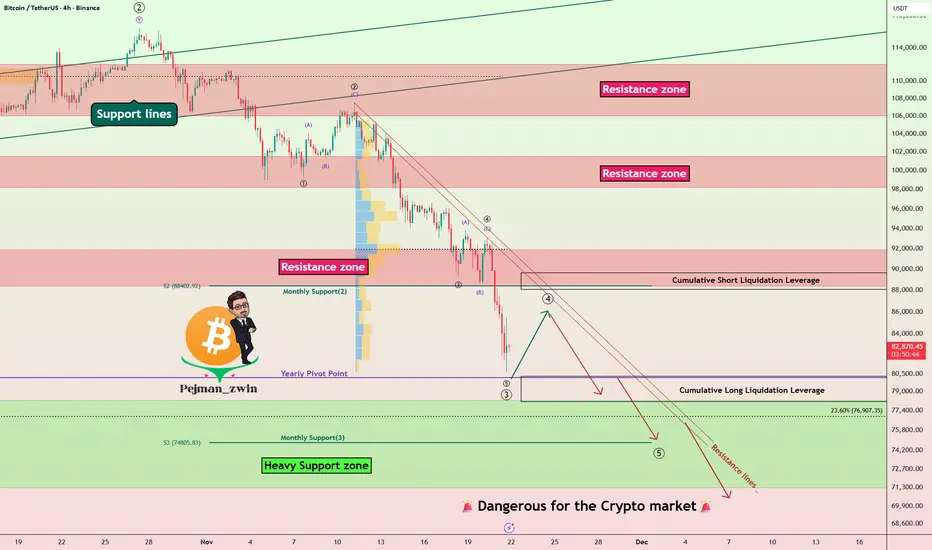
Bitcoin Hits Heavy Support Zone — Is the Next Big Crash Coming?Recently, Bitcoin ( BINANCE:BTCUSDT ) experienced another decline of over -10%, largely due to the sudden drop in the S&P 500( SP:SPX ). As I mentioned in previous ideas, in recent weeks, Bitcoin and the crypto market, especially Bitcoin, have shown a strong correlation with U.S. indices, particularly the S&P 500. This means that even technically sound analyses for Bitcoin can fail if we don’t consider these external factors, which is quite normal. Therefore, it’s crucial to incorporate all parameters—news, fundamentals, on-chain data, and relevant indices—to get an accurate Bitcoin analysis. This complexity can make things a bit challenging.
Over the past ten days, Bitcoin has swiftly broken through several support levels. Many factors have contributed to Bitcoin’s decline recently, but it’s now approaching a heavy support zone($78,300-$71,280). This zone is crucial because if Bitcoin loses it, we could see even larger declines, affecting altcoins as well. Altcoins, in general, haven’t matched Bitcoin’s gains in recent months, so a significant drop in Bitcoin could lead to severe losses for them. It’s essential to manage your investments carefully and stay alert.
From an Elliott Wave perspective, the recent decline suggests that Bitcoin might be in the midst of a five-wave downward, which isn’t positive news. There’s a chance that the heavy support zone($78,300-$71,280) might be breached. However, considering that weekends typically have lower trading volumes, it’s less likely that the support will break in the next couple of days. Still, we must remain vigilant and prepared for any scenario.
In terms of Elliott Waves, it seems Bitcoin has completed its main wave 3, and we might be looking at the completion of the wave 4 over the weekend, with another push towards the heavy support zone($78,300-$71,280) at the start of next week.
Also, the USDT.D% ( CRYPTOCAP:USDT.D ) chart looks bullish, which could not be good news for Bitcoin.
I expect that after a brief rebound, Bitcoin will resume its decline and test the heavy support zone($78,300-$71,280) again.
Cumulative Short Liquidation Leverage: $89,642-$88,079
Cumulative Long Liquidation Leverage: $80,263-$78,131
First Target: $78,523
Second Target: $75,123
Stop Loss(SL): $92,123(Worst)
Points may shift as the market evolves
Note: The S&P 500 also might face downward pressure in the coming days, which could further impact Bitcoin’s support levels. It’s essential to manage your investments carefully and wait for strong reversal signals in higher timeframes. You might miss out on some short-term gains, but it will allow for more confident entries later on.
Note: Tensions between the U.S. and Venezuela are escalating day by day. Should these tensions intensify to the point of direct confrontation, it could act as a trigger for another Bitcoin decline. It’s important to keep this in mind.
Note: Additionally, there have been some suspicious transfers involving the Mt. Gox exchange recently. It’s worth monitoring these developments closely.
💡 Please respect each other's opinions and express agreement or disagreement politely.
📌Bitcoin Analysis (BTCUSDT), 4-hour time frame.
🛑 Always set a Stop Loss(SL) for every position you open.
✅ This is just my idea; I’d love to see your thoughts too!
🔥 If you find it helpful, please BOOST this post and share it with your friends.
BTC: price enters the buyer zone (86,000–79,500)This analysis is based on the Initiative Analysis (IA) method.
Hello, traders and investors!
On the monthly timeframe, the last buyer candle with increased volume appeared a year ago — in November 2024. From that point, buyers attempted to resume the trend twice.
The first attempt — in January — formed the level 89,256.
The second attempt came after a manipulation of the 89,256 level between February and April 2025.
This led to the formation of a new buyer initiative with:
— upper boundary at 126,199,
— lower boundary at 74,508.
The current buyer target from this initiative is 109,608.
Now the price has returned to the volume accumulation zone created during that manipulation — the 86,000–79,500 range.
The blue band on the chart marks the minimal price range where 50% of the candle’s volume was accumulated.
The blue line marks the price of the maximum volume inside that candle.
The daily candle from 21.11 has entered the 86,000–79,500 range with the largest volume since April 2025.
(And April 2025 was exactly when the 89,256 level manipulation took place.)
This confirms buyer interest in this price zone.
This daily candle is part of the forming seller initiative.
The upper boundary of this seller initiative is 93,836, while the lower boundary is not yet defined, as the seller move has not been stopped by a buyer candle.
Any market scenario remains possible. With strong seller pressure, the price may fall below 74,508 (lower boundary of the monthly buyer initiative) or even below 66,835 (the low of the November 2024 buyer candle).
A consolidation phase is also possible — and even the most likely — but for that, we first need to see a buyer candle, followed by a return to 89,256 or higher.
We continue to monitor the situation.
Wishing you profitable trades!

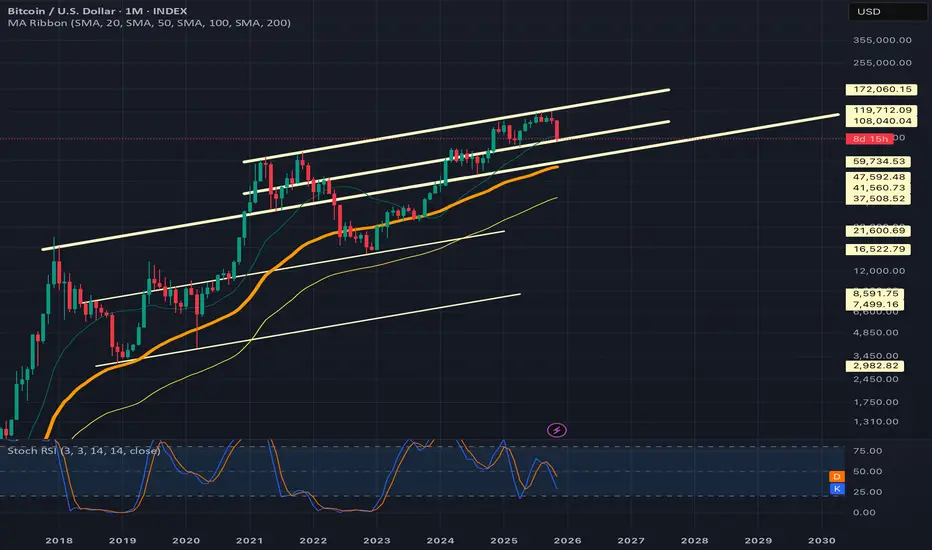
Bitcoin Time-Channel CyclesYellow = 1064d expansion
Green = 658d mean node
Blue = 364d compression
This chart documents a repeating BTC time-channel structure built from prior cycle highs and lows. The goal here is not to force a price prediction, but to show that Bitcoin has been respecting a consistent rhythm in time and slope across multiple market regimes. When the previous major ATL is used as the anchor, the next macro expansion phase has repeatedly aligned with a ~1064-day duration. That expansion window is displayed as the larger corridor, and it has now shown up cleanly from the 2015 ATL into the 2017 ATH, from the 2018 ATL into the 2021 ATH, and again from the 2022 ATL into the 2025 ATH..
Inside each 1064-day expansion corridor, a secondary time node appears at roughly 658 days, which is the golden-ratio contraction of the full expansion cycle. What’s notable is that price has not been randomly positioned at this midpoint in time. Instead, it has repeatedly migrated back to the mean of the rising channel near the 658 day mark, acting like a structural equilibrium reset within the broader uptrend. This “mean hit” behavior is visible across cycles and is one of the main reasons to watch time geometry alongside price geometry. After the mean-hit, the market has historically rotated into the final leg of the expansion phase before completing the cycle high.
Following each macro high, the bearish compression phase has clustered around ~364 days, shown as the blue corridor. These reset windows are materially shorter than the expansion windows, which matches the observed tendency for bullish advances to build over years while bearish phases compress into faster, more volatile declines. The expansion to compression ratio is close to 3:1, reinforcing the idea that the market “inhales” slowly and “exhales” quickly in time. The important takeaway is that the model is not asking price to obey a specific number; it’s showing how price has behaved inside repeating time-based corridors, with the mean of the channel acting as a magnet around the 658 day node.
This framework is shared as a structural study, not a guarantee. Markets can mutate, and no historical symmetry is permanent. However, when a time-channel sequence repeats cleanly across multiple cycles, it becomes a useful way to frame expectation, especially for identifying where equilibrium touches and regime shifts are statistically more likely to occur. If this rhythm continues to hold, future cycle windows can be mapped the same way, with the emphasis placed on time-based decision zones and mean reactions rather than on any single price target.

Bitcoin: Where Is The Bottom?Bitcoin sell off continues through the 90K to 88K support area. There have been no reversal confirmations on this time frame since I wrote my previous report. The reversal pattern that I was anticipating never even began to materialize. Trade opportunities were best found on the day trade time frames in my opinion. Why wasn't anyone calling for such a move back in August? All of the "experts" who seem to always know the future, until something like this comes along? This is why I don't forecast the future, instead I do my best to uncover potential risks which can lead to capturing potential opportunities.
88K is where I labeled Wave 1 of the broader 5th wave which I talked about for months. I warned investors that buying and attempting to hold above 100K was high risk. Bitcoin is NOW at prices worth monitoring for longer time horizon investing, BUT price has compromised the 88K overlap level. I interpret as we are no longer in the broader Wave 4 and instead, the Wave 5 of 5 is likely complete. There is a much lower chance that we get the dramatic rally into the 130Ks as a result.
This change in expectation is what guides how I gauge investment potential, which then shapes my strategy and goals. 73K is a MAJOR support level (previous all time high before the election) and it is now much more possible to be tested. IF there is any confirmed reversal before reaching this support, profit potential for SWING trades can be measured from the next series of resistances 95K, 100K, and 105K respectively. The 88K overlap suggests that Bitcoin is now in a broader Wave 2 which is likely to unfold in a long term range. A range low is more likely and has yet to be established. It could be 73K, it could be lower like in the 60Ks. SENTIMENT drives price over the short term which is why fundamentals alone are not enough.
There are many ways to begin accumulating Bitcoin inventory or acquiring exposure without buying Bitcoin itself. There's a entire collection of ETFs that track Bitcoin that have low cost fees. There are also other stocks that are highly correlated to Bitcoin but have their own unique characteristics which can enhance performance or help to mitigate some of the risks of buying Bitcoin itself. COIN is one of many examples. I would rather accumulate shares of a stock which is easily accessible and straightforward than accumulating Bitcoin itself simply out of convenience. I will talk more about this during my regular stream.
The illustration on my chart is ONE of many scenarios to consider for the coming weeks. While 73K is a possibility, I like it is a low probability that price will probe that low without attempting to retrace first. There is a pin bar in place but still lacking confirmation on this time frame. I believe there is a much higher chance of reversal from the current prices, BUT I do not expect an attempt at new all time highs any time soon. WAIT for confirmations, set profit objectives and keep expectations within the boundaries that are set forth by the PRICE STRUCTURE, not "experts" whose only agenda is to convert your attention into a paycheck.
Thank you for considering my analysis and perspective.

When Will Altcoin's Pump in 2025/26? BTC Dominance Analysis📊 BTC Dominance Breakdown — When Will Altcoins Start Pumping in 2025 or will it be 2026?
This chart shows BTC Dominance (BTC.D), which tells us how much of the total crypto market value is sitting in Bitcoin versus altcoins.
When BTC.D goes down, it means money is rotating into altcoins → that’s when altcoins pump.
Right now BTC.D is moving inside a clean down-trending channel, meaning the long-term direction already favors altcoins — but the timing depends on one key level.
✔️ The Key Idea
Before altcoins explode, BTC.D typically makes a retracement (a bounce upward) and then rejects from a major resistance line.
In this chart, that critical level is around 60% dominance.
📌 What Happens Next (Simple Version):
BTC.D might bounce back up toward 59–60% (green path on the chart).
This bounce is normal and usually happens before altcoins take over.
If BTC.D gets rejected at 60% and falls:
First target: 57%
Then continuation lower toward 53–55%
💡 Why this matters
A drop from 60% → 55% → 53% is historically the point where:
🔥 Altcoins start outperforming Bitcoin
🔥 Altcoin season begins
🔥 Money rotates heavily into mid-caps and small caps
⏳ So When Will Alts Pump?
If BTC.D follows this pattern, the first big altcoin push should start right after the 60% rejection, likely late December → February range.
The massive altcoin run comes when BTC.D breaks below 57%, which your chart suggests could happen early 2026, kicking off a sustained altseason.

BTC or Gold?Answer Gold!
The BTC/Gold ratio is on the verge of cracking here.
A crack here will trigger a sell-off in BTC relative to Gold.
This is a very simple, low risk, ratio trade.

BTCUSDT.P - November 23, 2025Bitcoin remains in a pronounced daily downtrend with persistent lower highs and lower lows, reflecting strong bearish momentum. The price is now targeting major support zones near 78,250 and 60,300. There is currently no indication of reversal; a sustained move above support would be necessary to suggest any bullish recovery. Until then, momentum and trend bias remain decisively bearish.

BTCUSD – Outlook for the Upcomming daysMonthly View
The monthly timeframe remains bullish overall, but Bitcoin has pulled back to gather strength, it can take previous monthly timeframe low's liquidity. This kind of move is typical when the market is gearing up to break a higher high. The broader structure hasn’t shifted—this is simply a deeper retracement inside a bullish narrative.
Weekly View
The weekly chart is showing a similar story. Price has been dropping consistently without giving even a single proper reversal. If BTC truly wanted to fall aggressively, it would normally make a move up first, trigger traders’ stop-losses near previous highs, and then dump. But this time, it didn’t do that.
This unusual behavior hints that the market may be preparing something different from what most traders expect.
Daily View
The daily timeframe is where things get really interesting. Bitcoin spent more than half the recent sessions moving sideways, collecting liquidity on both sides. After that, it dipped and formed a lower high—but that lower high hasn’t been broken yet.
According to my analysis, BTC is currently sitting in the Discount Zone, an area where buyers often start becoming active.
4-Hour View
On the 4H chart, I already had a clean short setup earlier, but now I’m watching for signs of a potential reversal. That reversal idea is not guaranteed, though—it becomes invalid if BTC fails to break the series of lower highs.
There’s also another scenario: BTC might refuse to break the lower highs and begin forming higher lows at the same time. If that happens, we’ll see a period of sideways consolidation. When the breakout finally comes—whichever direction it chooses—the move is likely to be powerful.
Final Thoughts
Based on my analysis, BTC is showing mixed but promising signals across the higher and lower timeframes. The monthly structure is still bullish, and this pullback looks more like preparation for a stronger push rather than a trend reversal. Weekly price action hasn’t shown any meaningful bounce yet, which is unusual—and that alone hints that the market might be setting up something unexpected.
On the daily chart, BTC has swept liquidity after moving sideways for quite a while, and now it’s resting in the Discount Zone, where smart money usually becomes active. The 4H timeframe already gave clean short opportunities earlier, but now the market is approaching a point where a reversal could begin—unless lower highs remain untouched.
If BTC starts forming higher lows without breaking lower highs, the market will likely slip into a compression phase. When price finally breaks out of that squeeze, the move—up or down—can be very strong.
Again, this is just my personal viewpoint. Please do your own analysis before investing. Your profits and losses are entirely your responsibility—I’m only sharing what the charts are suggesting to me right now. Stay alert to the reaction levels ahead; that’s where the next major direction will reveal itself.
----------------------------------------------------------------------------------------------
Thanks for checking out this analysis! If you enjoyed it, hit that follow button so you don’t miss future updates. And if this breakdown helped you out, drop a like 👍 and share your thoughts in the comments 💬—I always appreciate the feedback!

Why 90% of Traders Blow Their Account?-And How to NEVER Be One!What is Risk Management? ⚠️
In trading, it means evaluating, measuring, and reducing potential losses , while capital management focuses on preserving and growing your capital. The main goal is to ensure that even if several trades turn out to be losers, your entire account doesn't get wiped out. For example, always ask yourself before entering a trade: "How much am I willing to lose?" ❓ This helps maintain your trading psychology 🧠 and prevents emotional decisions 🚫.
Practical Risk Management Techniques:
Using Stop-Loss and Take-Profit : Always set a stop-loss 🛑 so the trade closes automatically if the market moves against you. Also, use trailing stops to adjust the stop as the market moves in your favor and lock in more profits 💹.
Position Sizing : Never risk more than 1-2% of your total capital on a single trade. For example, if your account is $10,000, risk a maximum of $100-200 💸. This is called the "2% rule" and helps keep your capital safe even after several consecutive losses 🔄.
Risk-Reward Ratio : Always aim for at least 1:2 – meaning for every 1 unit of risk, target 2 units of potential reward. For example, if you risk $100, aim for at least $200 in profit. This way, even if only 50% of your trades win 🏆, you'll still come out profitable overall.
Diversification : Spread your capital across different markets (like forex, crypto, and stocks) to ensure that risk in one market doesn't impact everything else. For example, allocate 30% to stocks 📊, 40% to forex 💱, and 30% to crypto 🪙.
⚠️This post is for educational purposes only.⚠️
What’s YOUR biggest risk management rule? Drop it in the comments!👇

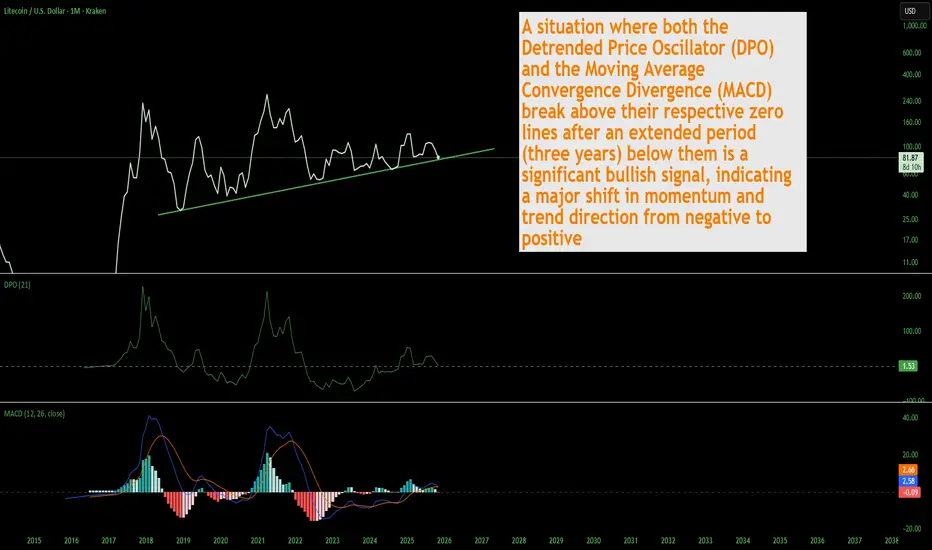
LTC Litecoin Poised For Something Big Macro Style I still see lots of people selling and capitulating. Thats ok that cant be prevented, most have no idea how markets work and those same people are afraid of their own shadow. The capitulation is almost over. I just want to point out the confluence of various indicators on the macro long term time frame pointing to a massive bull run for Litecoin. This is not financial advice just my opinion. Like and follow for more updates.
BTC Daily Analysisbased on our previous analysis bitcon made an announced ATHs and drop down from that point.
it is near our important support levels. we expect BTC ranges between its support and resistance levels.
in weekly timeframe we can't see any signs of downward movement.
if any of these levels breaks with ichimoku confirmation, i will update the analysis.

Saylor’s Master Plan at Risk? MSCI Drops the HammerMSCI May Exclude Crypto-Heavy Companies: What It Means for MicroStrategy and the Market
MSCI recently published a proposal that could dramatically reshape how global indices treat companies with large crypto exposure.
According to the framework, companies holding more than 50% of their market capitalization in digital assets may be excluded from national and international indices.
This sounds technical - but the consequences are huge.
What This Means in Practice
If the rule is implemented, companies like MicroStrategy, Bitfarms, Marathon, Hut8, Coinbase, or any firm holding a large percentage of crypto on their balance sheet, may:
be excluded from major indices,
lose exposure to institutional investors,
be off-limits for pension funds, insurers and conservative hedge funds,
face reduced liquidity and forced selling.
This is not a small development.
This is a structural shift.
🧩 Why MicroStrategy Is the Most Exposed
MicroStrategy’s business model has been extremely straightforward:
issue new shares
raise debt (including convertible notes)
use the proceeds to buy Bitcoin
rising BTC → rising MSTR
rising MSTR → more borrowing capacity
A perpetual loop.
But if MSTR gets excluded from key indices, the loop breaks:
passive funds must sell
institutional investors face compliance risk
liquidity dries up
volatility increases
borrowing costs rise
And remember:
MicroStrategy currently trades below the fair value of its Bitcoin holdings.
A forced outflow amplifies the structural imbalance.
⚠️ Why Institutions Bought MicroStrategy Instead of Bitcoin
Many funds legally cannot buy Bitcoin.
They also cannot buy high-risk crypto exchange stocks like Coinbase.
But they can buy:
reputable corporate debt
convertible notes
equity from a listed U.S. corporation
Michael Saylor gave them a regulatory loophole:
“Want Bitcoin exposure? Buy my convertible debt.
If BTC rises, convert the notes into shares.”
This workaround is now cracking.
Convertible Debt Holders Are in a Tough Spot
If MSTR is excluded from indices:
index funds sell → share price drops
falling price → convertible notes lose value
institutions holding the debt face losses
the balance sheet risk increases
This is why regulatory decisions matter so much.
Insider Selling: VP of Bitcoin at MicroStrategy Sells ~$19.7M Worth of Stock
The timing is… interesting.
Started selling on September 18
Sold options-based shares in multiple lots
Continued selling until November 14
Total realized profit: ~$19.69M
Selling into regulatory uncertainty is not random behavior.
It’s a signal.
Key Takeaways
1. MSCI’s proposal changes the rules:
companies with >50% crypto exposure may become “non-indexable”.
2. MicroStrategy’s core model—borrowing to buy BTC—depends on institutional inflows.
Index exclusion disrupts it.
3. Convertible note investors may face severe pressure.
4. Insider selling suggests internal awareness of structural risk.
5. If MSTR is removed from indices, forced selling could create significant downside pressure.
📉 Conclusion
MicroStrategy has long been a “Bitcoin ETF before ETFs existed”.
Institutions bought MSTR because they couldn’t buy BTC directly.
But now:
Bitcoin ETFs exist,
regulations are tightening,
index providers are updating risk frameworks.
MicroStrategy may become a victim of its own success strategy.
Best regards EXCAVO

The final stage for BTC Just what if....hard to adjust by timing! Because macro to much affect the sp500/ gold and crypto. But just an idea
Probably global plan about 139k like a top for Bitcoin still relevant in October / November BYBIT:BTCUSDT.P

You Not Mess This [weekly analysis Nov. 24-28th 2025]Get ready for a deep dive into the key market moves, upcoming catalysts, and trade ideas you can’t afford to miss. In this week’s edition we’ll cover:
EURUSD BTc S&P500 AUDNZD AUDNZD GBPCAD
AMZN MSFT FTSE
🔔 Don’t forget to subscribe and hit the bell so you never miss a weekly breakdown.
📣 Share your thoughts in the comments: What are you bullish/concerned about this week? What setups are you watching?

A new look at previous logarithmic channelWith the trendlines of this channel slightly shifted we can see that it is possible that priceaction has already tested the top trendline of the channel. However in my previous version of this idea which I will try to post below it hasn’t connected with the top trendline yet. Would make more sense for it to be having the rejection it is having if it has already retested this top trendline though so I decided to post this version of the chart too so I can keep an eye on both. Even if somehow this does signal some sort of top it looks like we have very strong support on the next trendline just below the current one which should have the monthly 50ma double reinforcing its support in the very near future. SOo in that case that 50k zone there should hold strong support,but hopefully this is So another correction and not the top in which case the current trendline we have just retested will hold support. *not financial advice*