BTC 4H Analysis - Key Triggers Ahead | Day 43😃 Hey , how's it going ? Come over here — Winter got something for you!
⏰ We’re analyzing BTC on the 4-Hour timeframe.
👀 On the 4H timeframe of Bitcoin, we see that after the recent interest rate cut news, price started moving down. It seems that the potential upside from the news was already priced in by traders. Right now, BTC is trading in a range between resistance at $117,573 and support at $114,828. A breakout of either side could send the price toward the next support or resistance. For now, the market will likely move into a range condition, where the win rate of most setups drops, so it’s better to trade with lower risk.
🧮 Looking at the RSI oscillator, it is near a support zone below the 50 level. The two key levels to watch are 40 and 70. If RSI breaks above or below these zones, Bitcoin could start a new move.
🕯 Currently, the size, volume, and number of red candles are increasing. As BTC approaches support, some buy orders have been triggered. The key question is whether this support zone is strong enough to hold the price until the new week begins. Since the ATH, every correction has faced strong selling pressure from major sellers (maker sellers).
🧠 At this stage, Bitcoin itself may not provide the best setups for positions. However, altcoins that are showing bullish divergence or relative strength against BTC could present better opportunities. We can track these coins on platforms like TradingView or CoinMarketCap, identify their triggers, and look for long entries if the setups are valid.
❤️ Disclaimer : This analysis is purely based on my personal opinion and I only trade if the stated triggers are activated .
BTC-M

ACE ANALYSIS🔮#ACE Analysis 💰💰
#ACE is trading in a symmetrical triangle in a weekly time frame and breakouts with high volume and we could see a bullish momentum in #ACE. Before that we will see little bit retest and then bullish movement
🔖 Current Price: $0.5745
⏳ Target Price: $0.8548
⁉️ What to do?
- We can trade according to the chart and make some profits in #ACE. Keep your eyes on the chart, observe trading volume and stay accustom to market moves.💲💲
#ACE #Cryptocurrency #Pump #DYOR

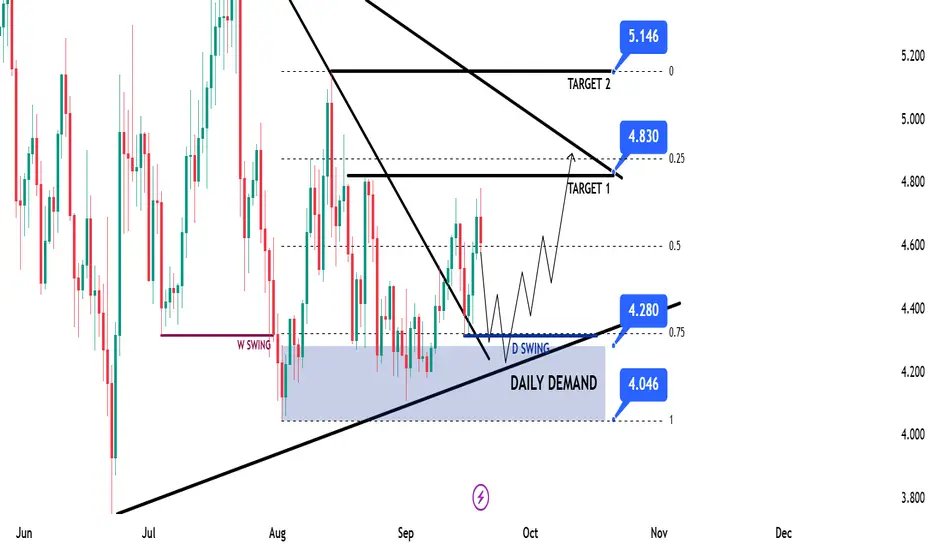
APT Swing Long IdeaAPT Swing Long Idea
📊 Market Sentiment
FED has resumed its rate-cutting cycle, starting with a 0.25% cut in September, with two more 0.25% cuts expected in the coming months. Additionally, institutional liquidity inflows have accelerated as the U.S. officially adopts crypto as part of its reserves. While inflation remains elevated, the weakening labor market is forcing the FED to ease, driving more capital into risk-on assets.
📈 Technical Analysis
Price ran HTF liquidity and got rejected, creating a strong Daily Demand Zone.
This zone is further supported by the HTF bullish trendline, so I will only look for longs as long as the HTF bullish structure holds.
📌 Game Plan
1-Price to revisit and reprice the Daily Demand Zone at $4.28
2-Price to run and close above $4.30 daily swing liquidity (engineered liquidity for expansion higher)
3-Price to reprice into the 0.75 max discount of the range
4-Possible retest of the HTF bullish trendline
🎯 Setup Trigger
I’ll be looking for a 12H break of structure before entering long.
📋 Trade Management
Stoploss: 12H swing low that breaks the market
Targets:
• TP1: $4.83
• TP2: $5.14
💬 Like, follow, and comment if you find this setup valuable!
⚠️ Disclaimer: This content is for informational and educational purposes only and does not constitute financial, investment, or trading advice. Always DYOR before making any financial decisions.
BTC 1H Aanalysis - Key Triggers Ahead | Day 42😃 Hey , how's it going ? Come over here — Winter got something for you!
⏰ We’re analyzing BTC on the 1-Hour timeframe.
👀 On the 1-hour timeframe for Bitcoin, we can see that after reaching the seller trigger zone around $117,825, price was rejected to the downside. Currently, it is losing an important support level on this timeframe, and if we get a candle close below this zone, Bitcoin will likely move toward the buyer trigger area. After that, the market will enter a decision-making phase, where we will have to wait and see what happens in the coming week.
🧮 Looking at the RSI oscillator, there is a key level around 34. If momentum breaks below this level, we could see a deeper correction in Bitcoin’s price.
🕯 The size and volume of red candles are increasing, showing that many traders are selling Bitcoin and closing their long contracts. We need to watch how far this selling pressure continues. This correction, along with the selling momentum, is not unusual — it’s a natural part of Bitcoin’s price movement. Once this correction is complete, we’ll need to see what structure Bitcoin forms next.
🧠 For Bitcoin to make a real bullish reversal without entering an accumulation phase, the support level currently being lost could turn into a strong resistance trigger for future long positions. However, the main trigger remains at $117,825. If Bitcoin breaks above and holds that level, it could even set a new all-time high (ATH).
❤️ Disclaimer : This analysis is purely based on my personal opinion and I only trade if the stated triggers are activated .

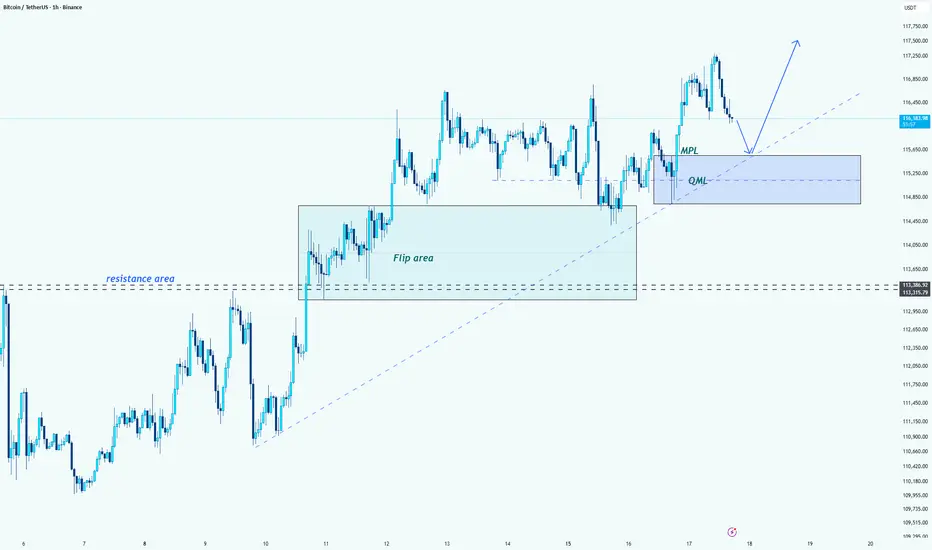
Bitcoin (BTC/USDT) -> MPL and QML AnalysisHello guys!
Let's analyze btc!
⚡ Trading Strategy
MPL Level: 115,000 should be tested before the price rises, so wait for confirmation here before entering long positions.
Target: The next major target for the uptrend is around 117,500.
--------------------
📈 Outlook
Bullish: If price holds above the QML, the bullish trend could continue towards 117,500.
Watch for Retest: Keep an eye on 115,000 for a possible retest before further upside.
Continuation of bullish momentum?Bitcoin (BTC/USD) is falling towards the pivot and could bounce to the 1st resistance which is an overlap resistance that aligns with the 161.8% Fibonacci extension.
Pivot: 115,494.52
1st Support: 112,962.02
1st Resistance: 118,235.69
Disclaimer:
The above opinions given constitute general market commentary, and do not constitute the opinion or advice of IC Markets or any form of personal or investment advice.
Any opinions, news, research, analyses, prices, other information, or links to third-party sites contained on this website are provided on an "as-is" basis, are intended only to be informative, is not an advice nor a recommendation, nor research, or a record of our trading prices, or an offer of, or solicitation for a transaction in any financial instrument and thus should not be treated as such. The information provided does not involve any specific investment objectives, financial situation and needs of any specific person who may receive it. Please be aware, that past performance is not a reliable indicator of future performance and/or results. Past Performance or Forward-looking scenarios based upon the reasonable beliefs of the third-party provider are not a guarantee of future performance. Actual results may differ materially from those anticipated in forward-looking or past performance statements. IC Markets makes no representation or warranty and assumes no liability as to the accuracy or completeness of the information provided, nor any loss arising from any investment based on a recommendation, forecast or any information supplied by any third-party.

$BTC Bullish Daily Close - HIGHERCRYPTOCAP:BTC closed just where it needed to close today, grabbing upside liquidity.
Need to hold this $117k mark and keep momentum above the 9EMA.
Still on for ATH Sept 23-30th.

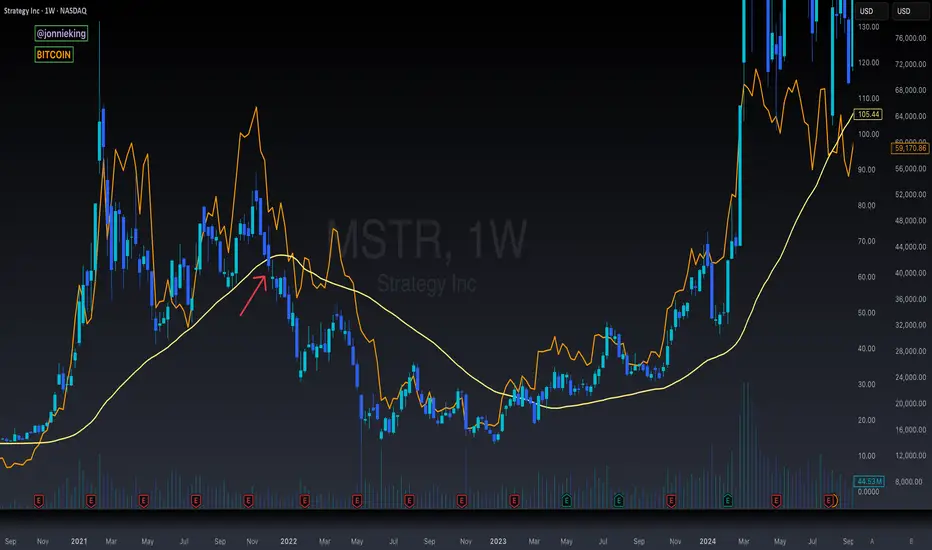
$MSTR Falling Below the 50WMA in 2021 Bull Market Here's a look at last cycle where NASDAQ:MSTR trading under the 50WMA for several weeks led to the CRYPTOCAP:BTC bear market.
The reason why this was so significant last cycle is because they were responsible for such a large share of BTC buy pressure.
This cycle we have lots of other treasury companies, with many more to come, as well as ETFs of course, so I'm not as concerned with this PA.
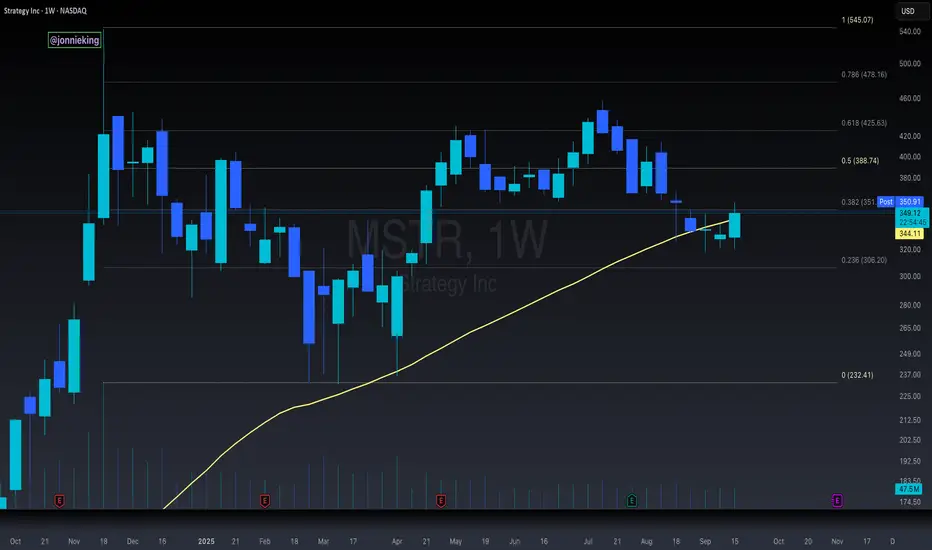
$MSTR Must Close This Week Above the 50WMA Or Else...The MicroStrategy chart is the only top signal that is somewhat cause for concern at the current moment.
You can see NASDAQ:MSTR has closed the past several weeks below the 50WMA, which signaled the start of the bear market last cycle.
Having said that, it has had a bullish rally this week and is trading above the 50WMA once again.
MSTR must close the week above this level, otherwise the stock could be in for a much deeper correction, which could negatively affect CRYPTOCAP:BTC in October.
Where have you heard that October prediction before?
Coincidence? 🥸

Btc is Bullish - it approaches an end of a historical timelineOn Sept 3rd I had suggested that Btc had bottomed and would bounce into one of my 3 targets. As anticipated Btc has now hit the top of target 2 (T2).
More importantly, I suggested Btc would bounce to these targets within 1-2 weeks ("18 days max"). Meaning based on a the patterns involving 3 red weeks down, Btc always sees the bounce end by day 18 or sooner...then retraces (often below the previous low -ie $117K).
Yet we are now at day 18 and Btc is not showing signs of a retracement. If Btc does not begin it's retrace today, then this is very bullish for Btc and the altcoin market. I am cautiously bullish as my bias has changed as a result of this new data. We must learn to pivot our trading strategies as price action unfolds. But being able to apply strategies to anticipate price action, helps us to know immediately when our trade ideas are being invalidated. It appears we possibly have an invalidation and I am shifting my approach accordingly.
Btc to the moon. Let's go!

CEP Here's a version of this giving an idea for a short-term pop followed by more downside and compression.
It's always good to look at things from multiple points of view and see what you think on various opinions and not be blind to things going against your personal desires.

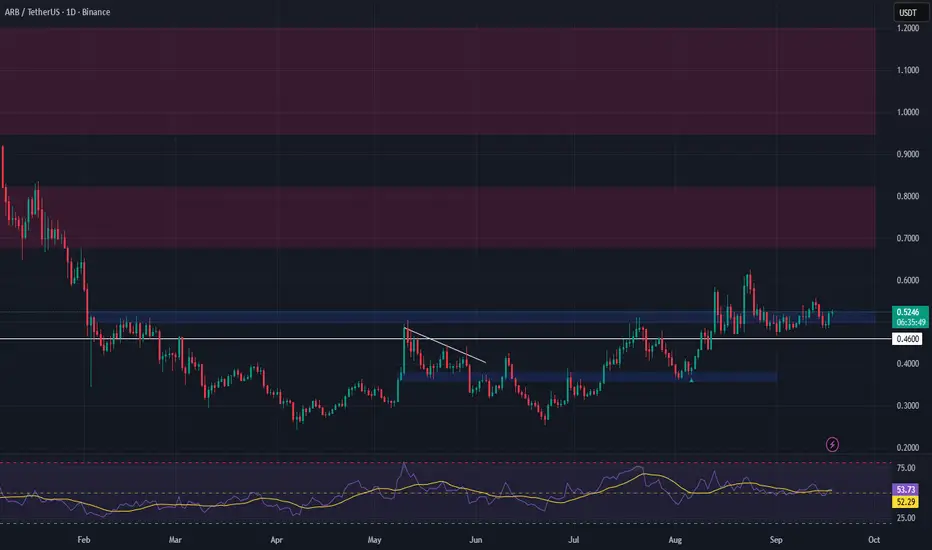
ARB Swing Trade Setup – Retest of Major Support ZoneArbitrum (ARB) recently posted a 64%+ rally, but has now pulled back into a key support zone between $0.50 and $0.5250. This area marks previous breakout levels and could serve as a strong base for the next bullish leg.
Despite the short-term retracement, ARB maintains a bullish structure. If this support holds, the current dip could offer an attractive risk-reward setup for swing traders. A bounce here aligns with the broader market sentiment and prior accumulation zones.
🔹 Trade Setup:
• Entry Zone: $0.50 – $0.5250
• Take Profit Targets:
🥇 $0.68 – $0.82
🥈 $0.95 – $1.20
• Stop Loss: Daily close below $0.46
CEP xxi 21Here's what I would like to see from a near term bullish perspective. I would like to see that the $18 range was the bottom at least for now and that we begin going back up and reclaiming some of these important levels. For a longer-term belief in the move, I would like it to have a somewhat healthy structure like this with the levels rather than a huge pop and then drop and then back to questioning lows.

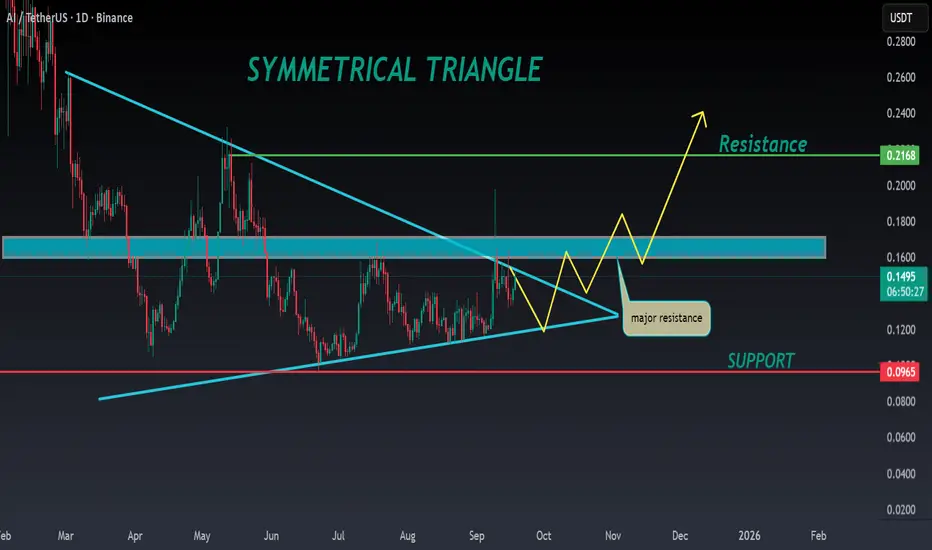
AI ANALYSIS🔮#AI Analysis 💰💰
#AI is trading in a symmetrical triangle in a weekly time frame and if it breakouts with high volume then we can see a bullish momentum in #AI. Before that we will see little bit bearish movement .
🔖 Current Price: $0.1490
⏳ Target Price: $0.2100
⁉️ What to do?
- We can trade according to the chart and make some profits in #AI. Keep your eyes on the chart, observe trading volume and stay accustom to market moves.💲💲
#AI #Cryptocurrency #Pump #DYOR
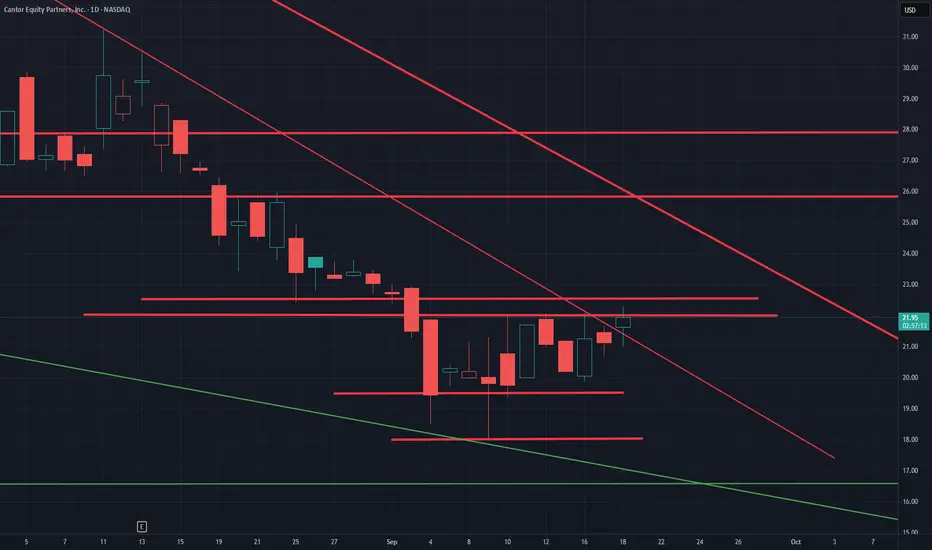
CEP daily #cep $cep xxi 21On the larger time frames like daily and weekly we definitely have a downward trend we are fighting. With fresh launch IPO stocks, it can take some time to get better lines and ranges that end up truly mattering but for now this is what we are looking at.
I've given you some levels to watch for reactions at and see if and when we get through them which ones show up as relevant for retests and or flows and volume later but until then this is the best we have to work with.
for people looking to trade shorter term moves and day trade this and or short-term swings or weekly moves I'll begin adding in some follow-ups on lower time frames.
BTC Swing short SetupIf setup failed, then possible btc may form 3 drive pattern n dump again, in this case will share new setup, while not bearish but looking for a good correction, take short with low margin from first setup, n 4% on second setup must use SL on both short setups. Best Of Luck. Don't short any alt coin, wait for btc to retrace these levels and open long for swing setups, will share some good gems, after confirmation

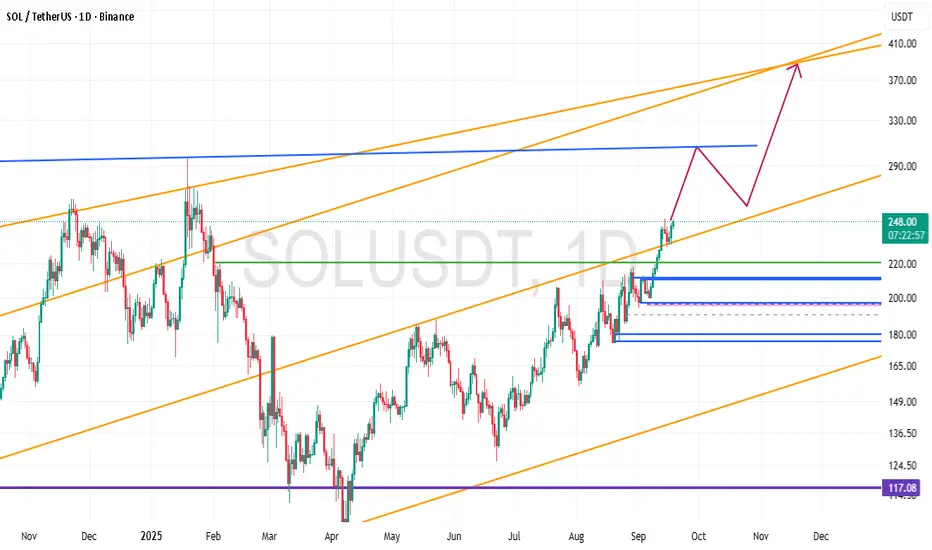
Technical Analysis Report: Solana (SOL/USDT)Current Price: ~$248
Solana is currently trading within a bullish ascending channel on the daily timeframe. The overall mid-term trend remains positive, supported by higher highs and higher lows.
🔑 Key Levels
Support Zones:
$220 → psychological support and trendline retest
$200 → major structural support (critical level)
$180 → strong support in case of a deeper correction
Resistance Zones:
$290 → short-term resistance and potential rejection area
$370 → upper boundary of the channel and main bullish target
📈 Possible Scenario
Price may extend its rally toward $290.
A corrective pullback to the $250–260 range could follow.
If momentum holds, the next bullish target lies around $370 at the channel top.
⚠️ Risk Notes
As long as SOL holds above $200, the bullish trend remains intact.
Losing the $200 support could trigger a decline toward $180.
Risk management and stop-loss placement are essential due to possible short-term volatility.
📌 Summary
Solana maintains a bullish outlook while trading inside its ascending channel. The medium-term upside targets stand at $290 and $370, with key supports at $220–200. Short-term corrections are possible, but the overall structure favors further upside as long as $200 holds.
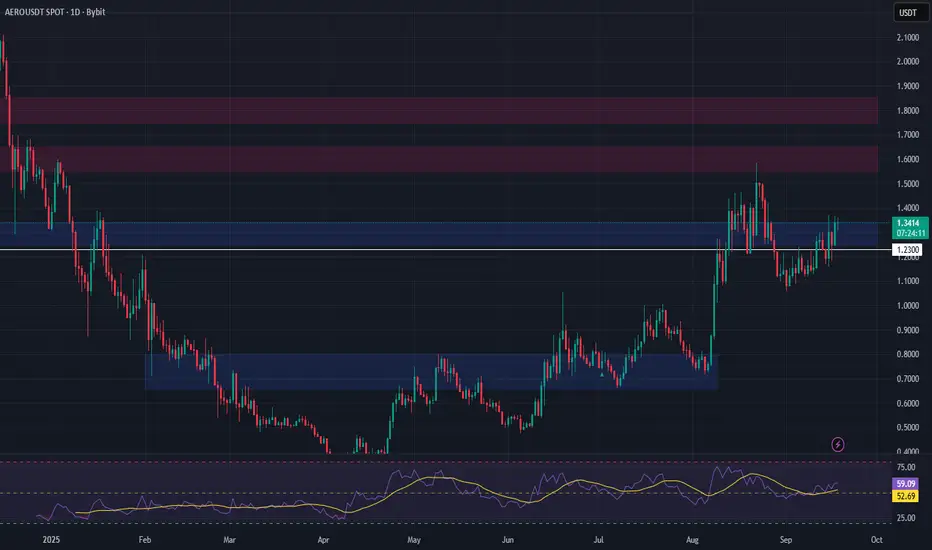
AERO Swing Trade Setup – Support Zone Reload?AERO has delivered an impressive 125%+ rally, but after such a strong move, it’s natural to see some consolidation. Price has now pulled back into a major support zone, where we’re watching for signs of strength and a possible continuation of the broader uptrend.
Despite the pullback, the overall bullish structure remains intact. This zone has held previously and could offer a strong bounce if bulls reclaim control. If momentum returns, this setup offers a favorable risk-to-reward ratio for swing traders.
🔹 Trade Setup
• Entry Zone: $1.25 – $1.34
• Take Profit Targets:
🥇 $1.55 – $1.65
🥈 $1.75 – $1.85
• Stop Loss: Daily close below $1.23
TIA Swing Long OpportunityTIA Swing Long Opportunity
📊 Market Sentiment
Market sentiment is bullish, fueled by the FED restarting rate cuts. We’ve seen a 0.25 BPS cut in September, with expectations for two more consecutive 0.25 cuts in the coming months. In addition, institutional liquidity flow into crypto has increased as the US officially adopted crypto as part of its international reserves. While inflation remains elevated, a weakening labor market is forcing the FED to ease policy, pushing liquid capital into risk-on markets.
📈 Technical Analysis
Price created a Daily Demand Zone at $1.70 and bounced, confirming its validity.
Price also broke the bearish trendline and closed multiple candles above, signaling further upside potential toward higher liquidity targets.
📌 Game Plan
I already entered the position after rejection at $1.70 and will manage it as a swing setup, targeting highs around $3 — a potential 70% expansion.
🎯 Setup Trigger
Validation came from the rejection at $1.70.
📋 Trade Management
Stoploss: Daily close below $1.30
Target: $3 (Potential 70% expansion)
💬 Like, follow, and comment if you find this setup valuable!
⚠️ Disclaimer: This content is for informational and educational purposes only and does not constitute financial, investment, or trading advice. Always DYOR before making any financial decisions.

BITCOIN Bullish Bias! Buy!
Hello,Traders!
BITCOIN is trading in an
Uptrend and the coin broke
The key horizontal level
Of 117k$ so we are
Bullish biased and we
Will be expecting a
Further local move up
Buy!
Comment and subscribe to help us grow!
Check out other forecasts below too!
Disclosure: I am part of Trade Nation's Influencer program and receive a monthly fee for using their TradingView charts in my analysis.

BTC Analysis - Key Triggers Ahead | Day 41👋🏻 Hey everyone! How’s it going? Hope you’re all doing well.
❄️ Welcome to Crypto Winter.
⏰ Today, we’ll be analyzing BTC and exploring its potential opportunities.
👀 On the 1-hour Bitcoin chart, we can see that after a slight drop following the recent rate cut, Bitcoin moved toward its micro buyer zone. Following Powell’s remarks, the price pushed upward, breaking through two resistance levels at 116,000 and 117,000. It is now moving toward the 117,700 resistance area, and if this level is broken, further upside movement could follow.
🧮 Looking at the RSI oscillator, the key level is around 70. Once momentum crosses this zone, Bitcoin could gain strong upward momentum, potentially entering the overbought area.
🕯 The size and volume of the green candles have increased notably after the news, suggesting the possibility of a longer-term bullish trend. A confirmed breakout above 117,610 would likely result in more consecutive green candles on the chart.
🔴 U.S. Unemployment Claims came in lower than forecast, strengthening the U.S. economy, while the DXY index is also pushing upward.
🧠 Based on the recent U.S. dollar news, capital inflows into Stocks have increased, and Bitcoin is also trending higher. If you did not enter yesterday, a potential entry could be considered after a confirmed breakout and stabilization above the resistance zone with a proper indecision candle setup.
❤️ Disclaimer : This analysis is purely based on my personal opinion and I only trade if the stated triggers are activated .

BTC End of Q3 Setup Now that FOMC is over and the FED finally cut interest rates by 25bps, what does this mean for BTC in the short term future and beyond?
It has been known for a while that the September FOMC would bring a cut to interest rates and that is what we got, generally this was priced into the market and despite some low time frame volatility not much has changed in terms of % move in the last day.
However, the macro does look bullish from here. Flipping $117,500 opens up the possibility of a range high test. For me this is the direction I'm leaning towards given the macro and how seasonality suggests a stronger end to the year especially after a rate cut.
Should BTC fail to break above the grey box BTC stays within the same constraints it's had for the last month.
