BITCOIN NEXT MOVE REVEALED!!!!! (this will make you scream) Yello Paradisers! In this video, we went through multiple timeframes as professional traders. We assumed things to analyze in Elliott Wave and other important indicators and advanced technical analysis tools. What's the next movement going to be with the highest probability!
Paradisers! Keep in mind to trade only with a proper professional trading strategy. Wait for confirmations. Play with tactics. This is the only way you can be long-term profitable.
Remember, don’t trade without confirmations. Wait for them before creating a trade. Be disciplined, patient, and emotionally controlled. Only trade the highest probability setups with the greatest risk to reward ratio. This will ensure that you become a long-term profitable professional trader.
Don't be a gambler. Don't try to get rich quick. Make sure that your trading is professionally based on proper strategies and trade tactics.
BTC-M

SUI Game Plan - Suinetwork📊 Market Sentiment
Market sentiment remains strongly bullish as the FED is expected to deliver a 0.25% rate cut, with speculation building for a possible 0.5% cut in September. Monetary policy shifts are being driven by both inflation trends and weakening labor market data. The latest August and September job reports were soft, signaling that the economy is cooling rapidly. This environment continues to fuel expectations for a major bullish run in the weeks ahead.
📈 Technical Analysis
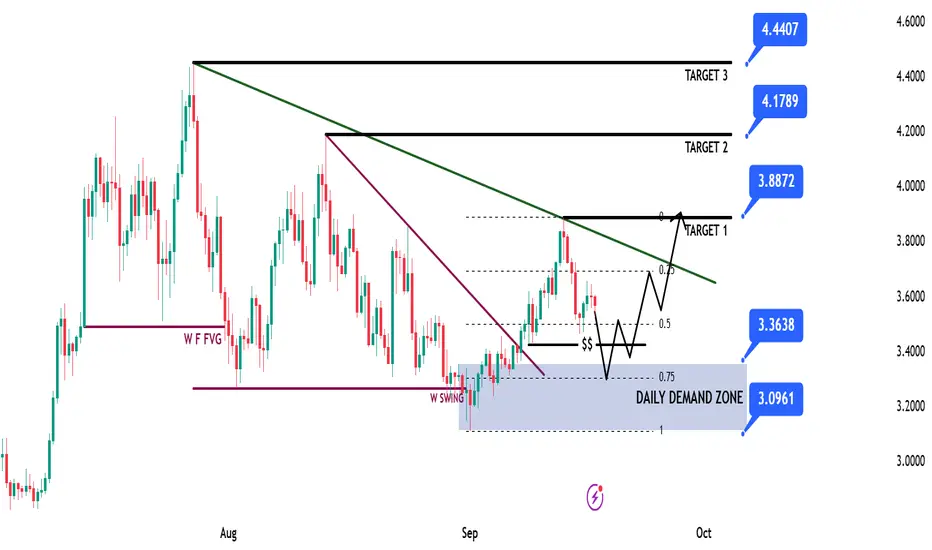
Price is on HTF bullish trend so we will be looking only long setups.
Price ran HTF liquidity and closed above then broke the market on daily-weekly timeframe, creating the Daily Demand Zone.
Moreover, price broke the bearish trendline and closed above, giving strong upward momentum. Now price is retracing back into the Daily Demand Zone.
📌 Game Plan
1-Price to hit back to Daily Demand Zone
2-Price to hit possibly 0.75 max discount range zone. If not, I’ll still enter with LTF confirmation.
🎯 Setup Trigger
4H break of structure after hitting 3.36$ level. I won’t enter unless I see the 4H BOS.
📋 Trade Management
Stoploss: Below 4H swing low responsible for BOS
Targets:
TP1: 3.88$
TP2: 4.17$
TP3: 4.44$
💬 Like, follow, and comment if you find this setup valuable!
⚠️ Disclaimer: This content is for informational and educational purposes only and does not constitute financial, investment, or trading advice. Always DYOR before making any financial decisions.
For couple years we've said Crypto = StocksWant more proof Crypto = Stocks now?
CRYPTOCAP:TOTAL 3 = NO CRYPTOCAP:BTC or CRYPTOCAP:ETH
This index looks identical to TVC:RUT = Russell 2k
Sorry we don't post much. It's a lot to keep 1 social account, let alone 2 - 3!
Please see our profile for more info.

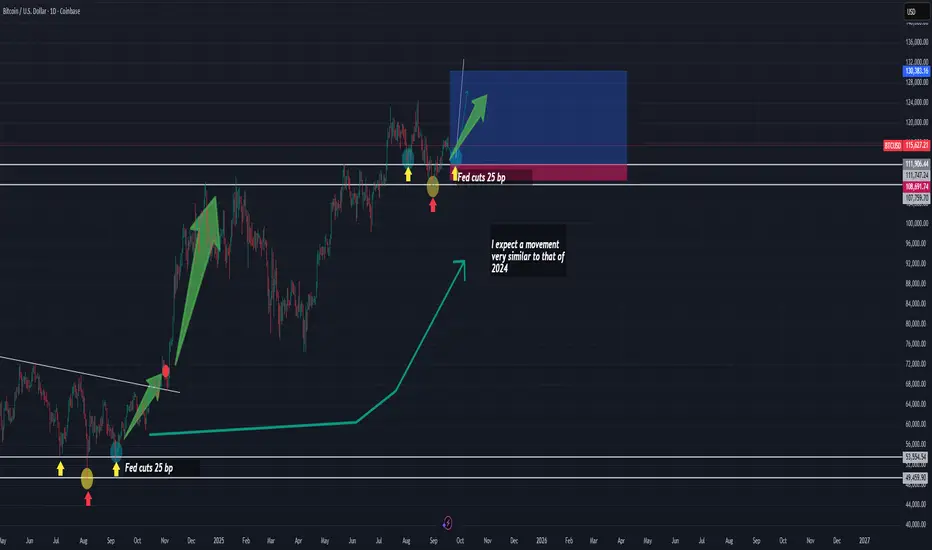
Bitcoin Trade of the Week: Liquidity Rules the MarketOne of the most decisive factors for markets right now is the expansion of liquidity. The growth of global M2 remains evident, particularly in China, where the economy faces a deflationary backdrop that forces authorities to maintain – and even expand – both monetary and fiscal stimulus. Ultimately, these flows permeate global financial markets and, as I’ve explained on several occasions, liquidity is the fuel that drives asset prices.
A Parallel with 2024
What we are observing today shows remarkable similarities with what happened in 2024. Back then, the start of Federal Reserve rate cuts marked a turning point. Even a moderate 25-basis-point cut triggered a rebound that coincided with a technical consolidation phase in Bitcoin, shaped as a descending channel.
Later, in November 2024, when the Fed accelerated the move with a 50-basis-point cut, the result was a much more aggressive bullish impulse.
Today, we find ourselves in an environment with rising probabilities of further cuts in upcoming Fed meetings, which could once again act as a catalyst.
Correlation Context with the Nasdaq 100
Meanwhile, the Nasdaq 100 is printing all-time highs, reflecting the strong risk appetite in tech assets. Bitcoin, in contrast, remains slightly behind its own highs. This divergence can be interpreted as a window of opportunity: if additional liquidity is confirmed through another rate cut, the momentum could spill over into Bitcoin and provide the strength needed to form a technical reversal structure—very similar to the inverted Head and Shoulders (H&S) pattern observed in 2024.
Trading Strategy
Entry Zone: 111,906.44
Stop Loss (SL): 108,607.83
Take Profit (TP): 130,383.16
This is what is going to happen with BTC today, FOMC daMy FOMC-Day Playbook (Trader’s Read)
Probabilities (today)
• Sell-the-news (spike then fade): ~60%
• Mini altseason (ETH leads, large caps follow): ~25%
• BTC bullish continuation after the announcement: ~15% ← my BTC-only continuation probability
Why my odds look like this
• Funding is low → no derivatives euphoria; any rally needs spot demand to sustain.
• Open interest is rising slowly → tape is more spot-led than leverage-led (healthier, but needs follow-through).
• DVOL slightly elevated + 25Δ skew tilted to puts → market is defensive into the headline; easy to fade if spot inflows don’t show.
• ETF volumes are moderate (IBIT/FBTC/ETHA) → by themselves they don’t signal a mega inflow day.
What would push odds toward continuation (BTC or mini-alts)
• 3:50–4:00 ET auctions print big in IBIT/FBTC/ETHA.
• EOD net flows ≥ $300–500M (bonus if ETH also prints strong).
• Post-headline vol crush (DVOL ↓), skew normalizes, funding ≤ 0.01%, OI up gradually (spot-led), and acceptance above resistance.
What would keep/raise sell-the-news risk
• Weak/negative EOD flows.
• Break attempts with funding ≥ 0.03% and OI ramping (crowded longs).
• DVOL ↑ and skew leans further to puts during the spike.
• Repeated rejections near BTC resistance (e.g., ~116–117k) with upper wicks.
1-Minute Checklist (before & after the announcement)
1 Spot vs perps: if spot leads and funding stays low, I prefer buying pullbacks over chasing.
2 DVOL / Skew: DVOL down + skew normalizing ⇒ continuation; DVOL up + skew to puts ⇒ fade more likely.
3 ETFs: watch closing-hour volume today; then confirm EOD net flows tonight:
◦ ≥ $300–500M ⇒ I carry a long/buy-the-dip bias into D+1.
◦ ≤ 0 ⇒ I favor fading resistance into D+1.
Operational stance (how I’ll trade it)
• Base into the headline: cautious. I won’t chase the first candle.
• Fade setup: if the breakout comes with funding/OI spiking and wicks near resistance, I treat it as spike-and-fadeback into the prior range (tight risk).
• Continuation setup: if I see vol crush + strong flows and acceptance above resistance, I flip to continuation mode and buy dips, with invalidation below the most recent reclaimed level.
This is my real-time framework, not financial advice. I’ll update the bias if the auction and EOD flows materially change the picture.

BTC 1H Analysis - Key Triggers Ahead | Day 39👋🏻 Hey everyone! How’s it going? Hope you’re all doing well.
❄️ Welcome to Crypto Winter.
⏰ Today, we’ll be analyzing BTCUSDT and exploring its potential opportunities.
👀 On the 1-hour timeframe for Bitcoin, we observe that after breaking the $116,000 zone, the price moved upward and buyers drove it to the $117,000 level. Then, sellers pushed the price back down to roughly the same level as yesterday. Currently, Bitcoin has two important triggers: one at $116,860 and another at $114,660. With a breakout of these levels, we can take positions more confidently. I don’t have a specific short scenario in mind because long positions, if taken, could continue with the news of interest rate cuts, and we could even add several funding levels to our positions.
🧮 On the RSI, the two critical zones are 70 and 38. If momentum breaks either, Bitcoin could move with much more strength.
🕯 The size and volume of green candles have increased significantly after micro-buyers entered. However, due to the interest rate cut news and upcoming scenarios, this kind of movement and these candles may not continue. One notable point on the chart is that the buying pressure has caused the size, volume, and number of green candles to be smaller, yet they produce larger moves. Our momentum for further upward movement is stronger and more powerful.
🔴 Today’s news could affect Bitcoin’s future price, so try to take a position aligned with the news. Although it seems risky, Bitcoin’s volatility relative to other coins is lower on news days, meaning less risk for traders.
🧠 There are two scenarios for entering a Bitcoin position:
1️⃣ Place a stop-buy at $116,850 to enter when the stop triggers. The stop size would be 2–3%, which is relatively large, delaying risk-to-reward, and there is a chance the scenario fails and the stop is hit.
2️⃣ Wait for a 15-minute candle setup (Indecision + SMA + Low Volume) to enter, allowing a smaller stop at roughly the same level. This still carries the risk of being stopped out quickly.
Risk management is essential — if we follow it today, nothing adverse should happen.
❤️ Disclaimer : This analysis is purely based on my personal opinion and I only trade if the stated triggers are activated .

BTC Eyes 120K but 115K Support is the Last LineCRYPTOCAP:BTC is currently trading around 116K after a strong run-up. The chart shows a rising wedge pattern forming, with immediate support sitting near 115K. If this level holds, BTC could make another push toward the upper resistance zone around 120K.
On the flip side, a breakdown below 115K may trigger a short-term correction, sending price lower before bulls step back in.
Overall, BTC is in a critical zone, holding support keeps the bullish momentum alive, but a rejection at resistance could slow things down.
DYOR, NFA
Stay tuned for more update

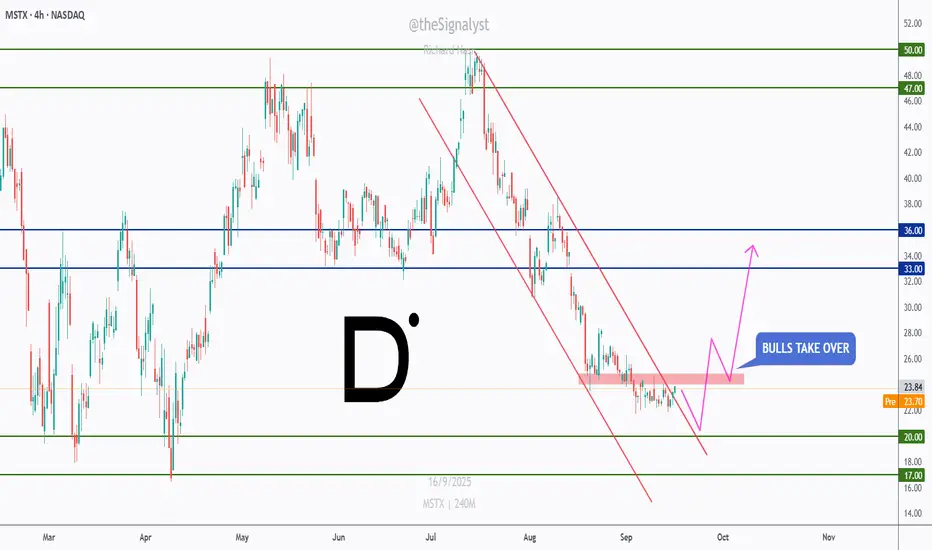
MSTX – Bulls Preparing a Reversal Move!MSTX has been overall bearish 📉, trading inside a well-defined descending channel.
Recently, price approached the $23 – $24 support area, where buyers started showing signs of activity. This zone could act as a potential turning point if momentum continues.
🟢 Support at $23 – $24: A critical level where bulls may step in.
📈 Upside targets: If buyers take over, the first resistance sits around $33, followed by $36 and higher toward $47 – $50.
As long as $23 support holds, bulls 🐂 could drive a short-term reversal that turns into a bigger recovery move.
Patience ⏳ is key — waiting for confirmation before entering can provide a higher-probability setup.
⚠️ Disclaimer: This is not financial advice. Always do your own research and manage risk properly.
📚 Stick to your trading plan regarding entries, risk, and management.
Good luck!
All Strategies Are Good; If Managed Properly!
~Richard Nasr
BTC – Between Structure and Supply!BTC has been trading inside a clean ascending channel 📈, respecting both support and resistance.
After breaking above the $113,000 structure zone, price pushed higher but is now approaching a potential retest area.
🟠 Structure zone ($113K – $114K): Could act as support on a pullback.
🟢 Channel support: Aligns perfectly with structure for confluence.
🔵 Supply zone ($122K – $124K): Next major resistance where sellers may step in.
As long as BTC holds above structure, bulls 🐂 remain in control, with the next upside target sitting around the supply zone.
Patience ⏳ is key — waiting for a clean retest could set up the next continuation trade.
⚠️ Disclaimer: This is not financial advice. Always do your own research and manage risk properly.
📚 Stick to your trading plan regarding entry, risk, and management.
Good luck!
All Strategies Are Good; If Managed Properly!
~Richard Nasr

XRPUSD → Will the rate meeting be a bullish driver for altcoins?BINANCE:XRPUSDT.P is consolidating above the previously broken boundary of the descending triangle formed within the bullish trend. Important news is ahead—the Fed's meeting on interest rates, which is highly likely to become a bullish driver for the cryptocurrency market.
The daily structure of the XRP market looks promising. The price is not updating global lows, is staying within the boundaries of the uptrend, and at the same time is breaking through the resistance of the downward correction, trying to consolidate above the fairly strong support level of 2.9535. But the market is waiting for a driver, namely fundamental background. If this background strengthens after Powell's speech, Bitcoin and altcoins may strengthen, including XRP. However, the fundamental background largely depends on the overall mood of the Fed and its comments. The market has already priced in an interest rate cut, as this is predictable given the economic data. But traders will be watching Powell's tone and how dovish or hawkish his view of the situation is.
Support levels: 2.9535, 2.8853
Resistance levels: 3.0577, 3.155, 3.359
Technically, at the moment, I am considering a scenario of a retest of support and the formation of a long squeeze at 2.9535 - 2.8853 against the backdrop of increased news volatility (manipulative nature). However, if this does not happen, the focus will be on 3.0577, and a close above this level could trigger further growth.
Best regards, R. Linda!

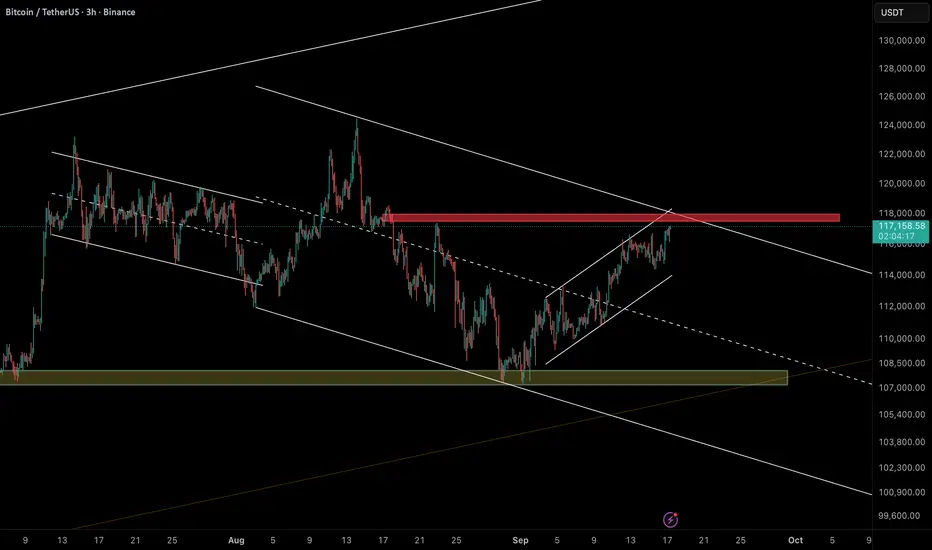
Bitcoin at Critical Resistance – Reversal or Breakout?Bitcoin (BTCUSDT – 3H) is testing the 117.5k – 118k resistance zone, which coincides with the upper boundary of the descending channel.
So far, this level has acted as a strong rejection zone several times.
🔎 Key Insights:
• Structure: Price has formed a rising channel/wedge, often seen as a corrective bearish pattern.
• Resistance: 117.5k – 118k (major supply zone + channel top).
• Supports:
• 114k (short-term channel support)
• 107k – 108k (major support zone + channel bottom).
📌 Scenarios:
• Bearish (more likely): Rejection from 118k → downside targets at 114k and 107k – 108k.
• Bullish (alternative): Break & close above 118k → potential rally toward 122k – 124k.
⚠️ As long as BTC stays below 118k, downside risks remain higher.

Bearish reversal for the Bitcoin?The price is reacting off the pivot and could drop to the 38.2% Fibonacci support.
Pivot: 116,976.22
1st Support: 113,498.37
1st Resistance: 119,215.75
Disclaimer:
The above opinions given constitute general market commentary, and do not constitute the opinion or advice of IC Markets or any form of personal or investment advice.
Any opinions, news, research, analyses, prices, other information, or links to third-party sites contained on this website are provided on an "as-is" basis, are intended only to be informative, is not an advice nor a recommendation, nor research, or a record of our trading prices, or an offer of, or solicitation for a transaction in any financial instrument and thus should not be treated as such. The information provided does not involve any specific investment objectives, financial situation and needs of any specific person who may receive it. Please be aware, that past performance is not a reliable indicator of future performance and/or results. Past Performance or Forward-looking scenarios based upon the reasonable beliefs of the third-party provider are not a guarantee of future performance. Actual results may differ materially from those anticipated in forward-looking or past performance statements. IC Markets makes no representation or warranty and assumes no liability as to the accuracy or completeness of the information provided, nor any loss arising from any investment based on a recommendation, forecast or any information supplied by any third-party.

BTC 2017 All Over Again? Is It About to Go Parabolic?Forbes just ran with a headline about a Bitcoin “death spiral.” The wording might be sensational, but the risk they are pointing to is real. It is sitting inside Bitcoin treasuries.
Companies like MicroStrategy (NASDAQ:MSTR) and Nakamoto are being packaged as safe institutional gateways to Bitcoin. The truth is, they are not just buying and holding. They are borrowing, issuing debt, and selling shares to continue buying more BTC. That structure works brilliantly when the price is running higher. When BTC pulls back, the debt remains while the value of the collateral falls. If their share prices sink at the same time, they cannot raise fresh equity. That is when forced selling begins, and the pressure feeds on itself.
This is where the LUNA comparison fits. LUNA collapsed because the system relied on TWAP buying to keep its peg alive. It needed a constant programmed demand. The second confidence cracked that demand disappeared, the mechanism broke, and the whole structure fell into a reflexive death spiral. Bitcoin treasuries carry a similar fragility.
They look strong on the way up because debt and dilution keep the system fed. But if one cracks, others will likely follow, and the forced selling could cascade through the market. It is history repeating in a new form.
The Cycle Overlap
Now layer in the cycles. December 2024 marked the rollover of the 8-year stress cycle in traditional markets. That signal has already triggered. But treasuries are not following that rhythm. They are moving in line with Bitcoin’s 4-year cycle. Every halving is followed by a strong run, a cycle top, and then a correction. That puts the real pressure point into December 2025. If treasuries hit the wall at the same time Bitcoin’s bull cycle peaks, the overlap could accelerate a blow-off followed by a brutal correction.
The 8-Year Stress Cycle (Traditional Markets)
2000 → Dot-com bubble rollover. Fed started cutting rates, but equities crashed hard into 2001–2002.
2008 → Global Financial Crisis. Fed slashed rates aggressively, but markets fell into a full-blown meltdown before recovery. 2009 was the brutal washout before recovery.
2016 → Global growth scare, China devaluation, Fed hiking cycle wobble. Markets pulled back, stress showed, then liquidity stepped in.
2024 → December rollover. The signal of cracks returning: inflation sticky, rate cuts being prepped, credit stress building, and leveraged players under pressure.
The pattern - every 8 years, traditional markets hit a rollover point where stress shows up, liquidity shifts, and the system resets.
The 4-Year Bitcoin Cycle
2013 → Top after 2012 halving, deep correction.
2017 → Top after 2016 halving, brutal correction in 2018.
2021 → Top after 2020 halving, correction in 2022.
2025 → Halving cycle points to a top window in December 2025, with correction risk into 2026.
Where Tether Fits
Tether (CRYPTOCAP:USDT) is not just minting stablecoins. It has become one of the largest buyers of short-dated US Treasuries on the planet, with more than 120 billion US dollars worth on its books.
In calm conditions, that makes sense, they clip yield and backstop redemptions. But if markets crash and liquidity dries up, redemptions spike. To meet them, Tether must raise dollars by selling or repo’ing those T-bills. Normally, that is seamless. In stress, selling can add to liquidity drains at the edges of both the Treasury market and crypto. If redemptions surge at the same time treasuries are being forced to sell BTC, you get a double liquidity squeeze.
The Technical Picture
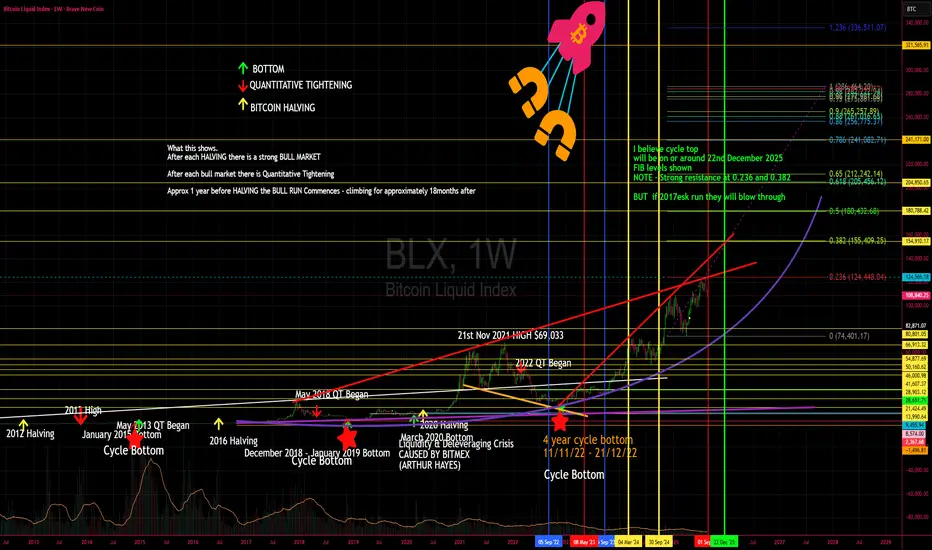
Look at the Fibonacci structure on the chart. The key levels line up with what could be a wave 3 of 3 in Elliott Wave terms — the most explosive part of any trend. That explains the sharp upside move this year. It is powerful, but it is also the phase where leverage and euphoria get stretched the furthest. If this lines up with treasuries cracking and Tether redemptions spiking, the volatility on both sides will be extreme.
2016–2017 vs 2024–2025
In 2016, traditional markets were rattled by China’s devaluation, an oil price collapse, and Fed policy missteps. Liquidity reset the system. For Bitcoin, that reset coincided with the halving and set up the most explosive run in its history. By 2017, equities were making new ATHs and Bitcoin went parabolic to nearly $20k before the brutal 2018 correction.
Now in 2025 we are seeing the same setup. Stress triggered in December 2024, but liquidity is flowing back. Markets everywhere are hitting new ATHs. Bitcoin has surged and is acting like it is in its 2017 phase right now, the blow-off leg of the 4-year cycle.
That puts the risk squarely into December 2025 for a cycle top followed by a correction.
The Cycle Top Target
I believe the cycle top for Bitcoin will land on or around 22nd December 2025.
The Fibonacci levels line up cleanly with this window:
Strong resistance at 0.236 and 0.382.
Under normal conditions, these zones would cap the move, but if we are truly in a 2017-style run, price can blow straight through them in a parabolic surge before the eventual correction. Fibs left on the chart for reference.
Key points
BTC treasuries are leveraged and debt-loaded.
Many treasuries exist, not just one, so cascades are possible.
December 2024 = 8-year rollover in traditional markets.
December 2025 = 4-year BTC cycle top window.
Tether can flip from stabiliser to amplifier if redemptions rise.
Fibonacci shows a potential wave 3 of 3, explosive but unsustainable.
2025 mirrors 2017: markets at ATHs, Bitcoin in parabolic mode.
Target: 22nd December 2025 as the likely top.
Stop losses and capital protection are critical.
It looks like BTC 2017 all over again.
The parabolic phase may not be finished yet, but the closer we get to December 2025, the sharper the risk of a brutal correction. This is not Bitcoin dying. This is a test of leverage and liquidity. If treasuries and Tether both get squeezed into the cycle top, the correction could be brutal. But as always, it will clear the field for the next 4-year cycle if you survive the next brutal 2026 BEAR Market.
Thanks for Reading, and please let me know your thoughts
<3 Lisa
The 115854.56-119177.56 area is a resistance zone
Hello, fellow traders!
Follow us to get the latest information quickly.
Have a great day!
-------------------------------------
(BTCUSDT 1D chart)
Looking at the big picture, there are two important areas.
These are the 104463.99-18353.0 and 84814.27-93570.28 levels.
To continue the stepwise uptrend, an upward breakout of the 116259.91-119177.56 level is necessary.
The M-Signal indicator on the 1D and 1W charts is passing through the 108353.0-116259.91 level. If support is found in this area, the price is likely to continue attempting to break above the 116259.91-119177.56 level.
If the price declines to the 104463.99-18353.0 level and encounters resistance, it is expected to eventually encounter the M-Signal indicator on the 1M chart.
Currently, the M-Signal indicator on the 1M chart is moving between 84814.27 and 93570.28, so it's important to determine whether it can find support within this range.
--------------------------------------
Two OBV EMA lines have been added to the OBV indicator in the Low Line ~ High Line channel.
OBV EMA 1 can be used as a short-term indicator, EMA 2 as a medium-term indicator, and EMA 3 as a long-term indicator.
Disabling EMA 3 reveals that the OBV is currently above both EMA 1 and EMA 2, indicating a transition from EMA 1 to EMA 2.
If OBV rises above the High Line and remains above it, the price is likely to continue its upward trend.
Currently, the price has been trending upward as the OBV indicator has risen above the High Line, but with the High Line indicator re-emerging, it appears to be declining below the High Line.
However, as mentioned earlier, since the OBV indicator is holding above EMA 1 or EMA 2, the key is whether the current support and resistance zones hold support.
In other words, the key is whether support can be found and an upward movement can occur around the 115,854.56-116,259.91 range.
The 115,854.56 and 116,259.91 points are the HA-High indicator levels on the 1D and 1W charts.
Therefore, the current support and resistance zones should be considered resistance zones and a corresponding strategy should be developed.
The basic trading strategy is to buy between DOM(-60) and HA-Low and sell between HA-High and DOM(60).
However, if the price rises in the HA-High ~ DOM(60) range, it could exhibit a step-like upward trend, while if it falls in the DOM(-60) ~ HA-Low range, it could exhibit a step-like downward trend.
Therefore, the basic trading strategy should be a segmented trading strategy.
Therefore, those who bought near the DOM(-60) ~ HA-Low range should consider selling in segments.
If you want to make a new purchase, you can do so when the HA-High ~ DOM(60) range shows support. However, this requires a quick and short response, so caution is advised.
From a broader perspective, this means buying in a sell zone.
-
I believe whether the price will rise or fall in the future depends on whether it can break above Zone 1.
There's a possibility of a bear market turning around, with a new all-time high (ATH) occurring between the week of November 24th and the week of January 26th, 2026.
More details will likely emerge as this month progresses.
This month's volatility period will be around September 19th and September 28th.
-
Thank you for reading.
I wish you successful trading.
--------------------------------------------------
- This is an explanation of the big picture.
(3-year bull market, 1-year bear market pattern)
I will explain in more detail when the bear market begins.
------------------------------------------------------

THE 4-YEAR CYCLE WILL NEVER ENDTHE 4-YEAR CYCLE WILL NEVER END.
As I’ve said many times before, I now think this cycle will push into late January / February 2026, similar to 2017.
As I’ve written extensively about, the macro setup is nearly identical to 2017.
Read that here.
The funny thing is, when we do push into early Q1 ‘26, all your favorite “influencers” will proclaim “this time is different”, because most weren’t here during the 2017 cycle or before.
There is ZERO EVIDENCE that the 4-year cycle is dead.
Since the GFC in 2008, the Fed was redesigned for these boom and bust cycles to counter inflation and unemployment.
At this point, unless the US completely dismantles the Fed, the 4-year cycle will live on in perpetuity. We see the effect of this on TradFi as well.
See the comparison here.
The Fed is set to cut interest rates for the first time in a year at tomorrow’s FOMC. This is a liquidity positive catalyst for markets.
The next ISM PMI print on October 1st should be ~50, which will be the start of the business cycle.
That would give us ~5 months of a surging business cycle, which will pump risk assets to VALHALLA.

Bitcoin next leg up coming.The major Bitcoin rally will resume from where it left off after a healthy pullback.

BTCUSD 4H chart short-term1. Trendline breakthrough
• In the chart you have a drawn orange relegation line (downward trend).
• The current candle struck above this line, which is the first signal of a change of sentiment from short -term inheritance to more bullshit.
2. Horizers of support and resistance
• Support:
• USD 115,426
• 114,487 USD (below, strong support, where price reactions can be seen)
• Resistance:
• 116,826 USD (the price came there)
• 117,717 USD (next resistance - an important destination point, if the moment is maintained).
3. Volume
• The last candles have a growing volume when struck. This is healthy, confirms that breaking from Trendline is not "empty".
4. STOCHASTIC RSI (below)
• You can see a dynamic break from the level of sale (<20) in the direction of 60+.
• This is a signal of growth, but note: the indicator begins to enter the purchase zone. A correction may appear in the short term.
5.
• Long (aggressive): entry around the retestation around 116k as support, target ~ 117.7k, SL below 115.4k.
• Short (versus): If the price rejects 116.8-117K and returns below 116k, you can consider Shorta with Target 115.4k → 114.5k.

BITCOIN 1W Stoch RSI completed a Bullish Cross. Expect new ATH.Bitcoin (BTCUSD) just completed a Bullish Cross on its 1W STOCH RSI and that's the first time it does so since April 07 2025. That was as we know, the previous market bottom of the Trade War correction.
In fact, every 1W STOCH RSI Bullish Cross has been a buy signal within this Bull Cycle's Channel Up (since November 2022), most of which huge. The April 2025 Bullish Leg rose by +65.92% and that has been the 'weakest' one of this Channel Up.
As a result, if we get the bear minimum of +65.92% this time around too, expect a new High around $175000, which should be the Cycle Top and in our opinion the absolute maximum that this Cycle can give.
Do you think we will go that high? Feel free to let us know in the comments section below!
-------------------------------------------------------------------------------
** Please LIKE 👍, FOLLOW ✅, SHARE 🙌 and COMMENT ✍ if you enjoy this idea! Also share your ideas and charts in the comments section below! This is best way to keep it relevant, support us, keep the content here free and allow the idea to reach as many people as possible. **
-------------------------------------------------------------------------------
💸💸💸💸💸💸
👇 👇 👇 👇 👇 👇

WIF Market Update📊 SEED_WANDERIN_JIMZIP900:WIF Market Update
SEED_WANDERIN_JIMZIP900:WIF is now testing an important resistance zone 🔴
👉 There’s a chance of rejection here, but if it breaks out, that’s a strong signal for a bullish trend ✅
⚡ Watch closely — confirmation will show the next move.

ENA has formed a bullish Inverted Head & Shoulders pattern📊 MIL:ENA Market Update
MIL:ENA has formed a bullish Inverted Head & Shoulders pattern 🟢
👉 If price breaks out the red resistance zone 🔴, the first target will be the green line level 🎯
⚡ Breakout confirmation is key before entering.

BTC idea for the weekWithin this range, we have what I have posted is a temporary bear trap that runs us to the range high which is also called supply. I don't believe we'll make it past this point and we will continue the downward trend from 120+ K this should run us to around 90,000 maybe less before a significant accumulation and short markup phase

BTC Price Action: Bulls vs BearsBitcoin has shown a gradual recovery after a prolonged corrective phase, with market structure leaning toward a constructive buildup. Fundamentally, sentiment is influenced by global macro conditions—investors are watching U.S. monetary policy signals, while stable demand from institutions and long-term holders continues to provide a supportive backdrop. On-chain activity remains steady, with balanced exchange inflows and outflows suggesting no extreme directional pressure in the near term.
From a technical perspective, the market has shifted momentum from bearish flows into a developing bullish sequence. The recent break of structure on the 4H timeframe highlights strengthening upside intent, though price is still moving within a broader accumulation phase. Current flows suggest the possibility of a short-term dip for liquidity before continuation to higher levels, aligning with the overall constructive weekly outlook.
