#BTCUSDT LONG SET UP ALERT !#BTC
The price is moving within a bearish channel on the 1-hour timeframe; it has reached the lower boundary and appears poised for a rebound. A retest of this boundary is expected, supporting some upward movement.
The Relative Strength Index (RSI) indicates a bearish trend, but an upward breakout is likely due to oversold conditions on the 1-hour chart.
There is initial support at 74,960, acting as a primary support zone.
A key support zone (marked in green) exists at 72,769; the price has
Btcethb
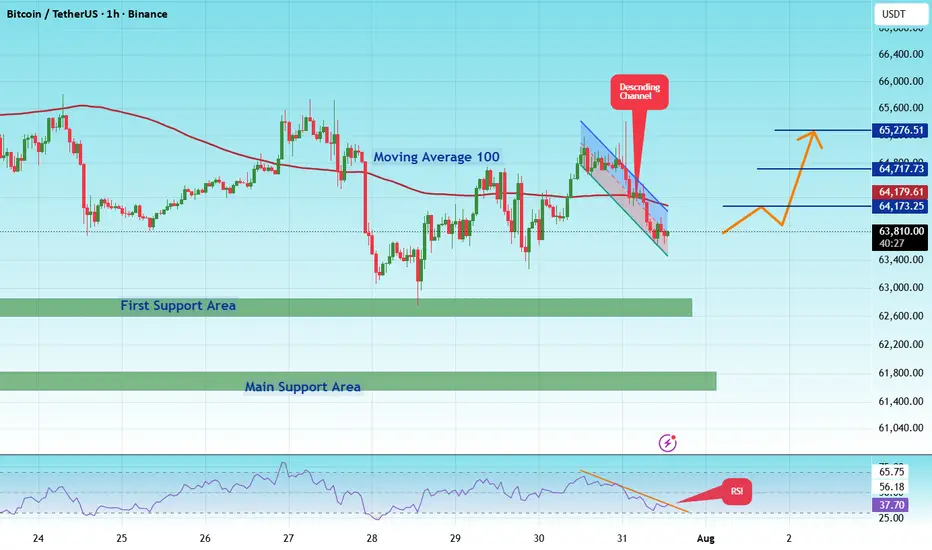
BTCUSDT : If BTC holds above $63731 Could Rise Further To $65276#BTC
The price is moving within a descending channel on the 1-hour timeframe and has reached the lower boundary. It is now poised for a bounce and is expected to retest this boundary.
The Relative Strength Index (RSI) indicates a downward trend, which is likely to continue given the overbought conditions.
A key support zone has been identified in green at 61522. The price has bounced off this zone several times, making it a strong support level.
The price is trending towards the 100-period m
#BTC/USDT Bullish Divergence on 1H, Low Risk Trade#BTC
The price is moving within a descending channel on the 1-hour frame, adhering well to it, and is poised to break it strongly upwards and retest it.
We have a bearish trend on the RSI indicator that is about to be broken and retested, supporting the upside.
There is a major support area in green at 108062, which represents a strong basis for the upside.
For inquiries, please leave a comment.
We are in a consolidation trend above the 100 Moving Average.
Entry price: 108450
First target:
#BTC/ETH#BTC
#BITCOIN
The price is moving in a descending channel on the 4-hour frame and is adhering to its limits well, and the price has reached the upper limit of the channel
The price is now $22.40, which is the entry price
Targeting the $21.50 area, which is the lower limit of the channel
There is a strong resistance point at the upper limit of the channel that supports the decline
We have a trend-hop on the RSI indicator, but more declines are expected on it
BTC/USDT 4HOUR UPDATEHello, welcome to this BTC USDT 4Hr chart update by CRYPTOSANDERS.
I have tried to bring the best possible outcome to this chart.
Show some support, hit the like button, and follow and comment in the comment section. this motivates me to bring this kind of chart analysis on a regular basis.
CHART ANALYSIS:-BTC got rejected from the horizontal resistance. There is uncertainty on the lookout and the volume is extremely less.
The short-term range of BTC is from $15.6K to $17.1K. A strong breako