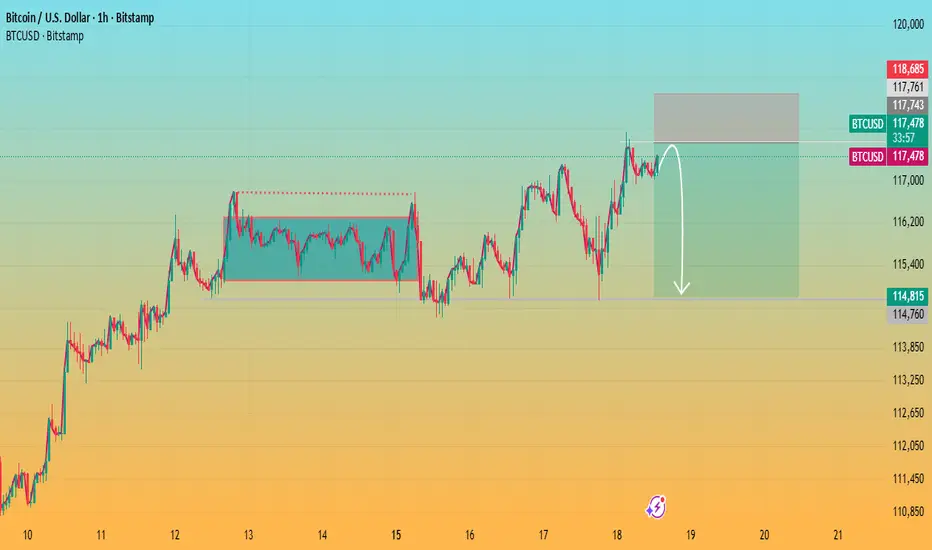
Bitcoin Testing Resistance with Potential Pullback AheadKey observations:
Range Breakout: Earlier, Bitcoin broke out of a consolidation zone (marked box), which triggered the recent upward move.
Resistance Zone: Price is hovering near the 5.15%–5.42% gain zone, where selling pressure has historically emerged.
Pullback Signal: The drawn arrow suggests a possible rejection at this resistance, pointing to a corrective move down toward the 3% zone.
Momentum Check: If BTC fails to hold above this resistance, a retracement is likely. However, a strong breakout could open the door toward 6% gains.
Btcusdanalysis
Bitcoin slips as Fed resumes rate cuts, but Outlook stays neutraBitcoin slips as Fed resumes rate cuts, but Outlook stays neutral
Bitcoin prices edged lower Friday morning after the Federal Reserve cut interest rates by 0.25% on Wednesday. The move initially pressured BTC as Chair Jerome Powell signaled a slower pace of easing than markets had expected. However, the crypto later rebounded as investors noted that further rate cuts remain on the table—generally supportive for risk assets. Still, Bitcoin’s upside was modest compared with stronger gains in some altcoins.
In terms of fundamentals, Bitcoin remains far from overheated. The Network Value to Transactions Golden Cross (NVT-GC), a key on-chain metric comparing market cap to transaction value, is currently in “neutral” territory.
Historically, negative NVT-GC readings—especially below -1.6—have preceded bullish moves, while values above 2.2 often signal reversals. The last major long signal appeared in July, when NVT-GC hit -2.8 before rebounding to 0.3.

Bitcoin Continues Uptrend as USD Weakens📊 Market Overview:
Bitcoin is currently trading around $117,117, maintaining its upward trend following the Federal Reserve's 0.25% rate cut to 4.0–4.25% and Chairman Jerome Powell's cautious signals on monetary policy. This has pressured the USD, providing support for Bitcoin.
📉 Technical Analysis:
• Key Resistance: $117,900–$118,000
• Nearest Support: $116,700–$116,800
• EMA: Price is above the EMA 09, indicating an uptrend.
• Candlestick / Volume / Momentum: RSI at 58.07 suggests the market may be in a neutral state.
📌 Outlook:
Bitcoin may continue to rise in the short term if it holds above $116,700, with resistance at $117,900–$118,000.
________________________________________
💡 Proposed Trading Strategy:
SELL BTC/USD at: $117,900–$118,400
🎯 TP: 40/80/200 pips
❌ SL: $119,000
BUY BTC/USD at: $116,500–$116,800
🎯 TP: 40/80/200 pips
❌ SL: $116,200

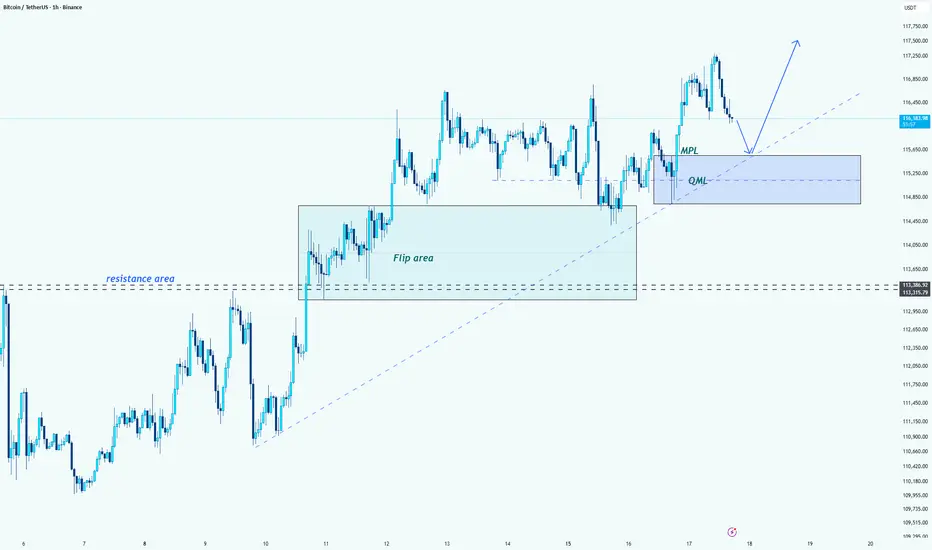
Bitcoin (BTC/USDT) -> MPL and QML AnalysisHello guys!
Let's analyze btc!
⚡ Trading Strategy
MPL Level: 115,000 should be tested before the price rises, so wait for confirmation here before entering long positions.
Target: The next major target for the uptrend is around 117,500.
--------------------
📈 Outlook
Bullish: If price holds above the QML, the bullish trend could continue towards 117,500.
Watch for Retest: Keep an eye on 115,000 for a possible retest before further upside.
Bitcoin Price Prediction: Will BTC Hit $119K Next?Bitcoin Price Prediction: Will BTC Hit $119K Next?
Bitcoin’s journey has been nothing less than a roller coaster, marked by dramatic rises and sharp falls. As of late, the cryptocurrency has seen fluctuations influenced heavily by broader economic signals, particularly the policy decisions from the United States Federal Reserve. The latest buzz in the crypto community revolves around whether Bitcoin can breach a new milestone of $119,000. This speculation is fueled by recent shifts in the market and macroeconomic policies that could either propel or hinder this ascent.
Current Market Overview
Key Resistance and the $118K Threshold
Bitcoin currently faces a significant resistance level at $118,000. This figure is not just a random high point; it represents a critical psychological and technical barrier. A break above this level could signal a strong bullish momentum, potentially setting the stage for reaching new heights. The resistance has formed due to various factors including profit-taking, historical resistance levels, and speculative trading behaviors.
The Role of the US Federal Reserve
The Federal Reserve's policies, particularly interest rate cuts, have a profound impact on investment in risk assets like cryptocurrencies. Lower interest rates generally decrease the yield on safer investments like bonds, making higher-risk investments more attractive. The anticipation around the Fed's decisions can lead to increased volatility in the Bitcoin market.
Liquidity and Market Sentiment
The liquidity in the Bitcoin market, evidenced by the influx of both buy and sell orders, plays a crucial role in its price movements. High liquidity leads to less price manipulation and more stability, whereas low liquidity can lead to higher volatility. Currently, the market is witnessing substantial liquidity, indicating active participation from both retail and institutional investors.
Factors Influencing Bitcoin's Price Trajectory
Institutional Adoption
One of the primary drivers behind Bitcoin’s potential rise to $119K is the increasing adoption by institutional investors. As more firms enter the market, their substantial buying power can significantly push the price upwards. This adoption also adds legitimacy to Bitcoin, encouraging more cautious investors to dip their toes in the crypto waters.
Technological Advances
Improvements in blockchain technology and the introduction of new features can also influence Bitcoin's price. For instance, enhancements in scalability and security can make Bitcoin more attractive to both investors and users.
Regulatory Environment
Regulations play a pivotal role in shaping the cryptocurrency landscape. Positive regulatory developments, or lack of negative ones, could boost investor confidence and push the price of Bitcoin higher.
Economic Indicators and Market Sentiments
Inflation and the Dollar Index
Inflation levels and the strength of the dollar also influence Bitcoin’s value. Typically, Bitcoin has been seen as a hedge against inflation. A weaker dollar often makes Bitcoin more attractive to international buyers, potentially pushing its price up.
Sentiment Analysis
Market sentiment, driven by news and social media, significantly impacts Bitcoin’s price. Positive news can lead to fear of missing out (FOMO), driving the price up, while negative news can trigger panic selling.
Technical Analysis and Future Predictions
Chart Patterns and Indicators
From a technical standpoint, Bitcoin has shown resilience by bouncing back from several corrections. The formation of a bullish flag pattern, combined with strong support levels being tested and held, suggests upward momentum.
Predictive Models
Various predictive models based on historical price data, market cycles, and external economic factors suggest a bullish outlook for Bitcoin. These models often incorporate elements like stock-to-flow ratios which have been historically accurate in predicting Bitcoin’s long-term price movements.
Expert Opinions
Many industry experts and analysts have weighed in on Bitcoin’s potential to hit $119K. While opinions vary, the prevailing sentiment is cautiously optimistic, contingent on market conditions and macroeconomic factors remaining favorable.
Conclusion
The question of whether Bitcoin will reach $119K is complex and laden with variables. Key factors include Federal Reserve policies, market liquidity, institutional investment, and broader economic indicators. While the short-term journey may be volatile, the long-term outlook for Bitcoin remains bullish, with many paths potentially leading to new all-time highs. As always in the crypto world, only time will tell, but the signs are promising for those betting on Bitcoin’s success.

Bitcoin Price Crosses $117,000 Post-Fed’s 35 bps Rate CutBitcoin is currently trading at $117,182, continuing its uptrend since the beginning of the month. The immediate challenge lies in flipping $117,261 into support, which would give the cryptocurrency the base it needs for further upside.
If successful, Bitcoin could target $120,000 as its next milestone. A breach and consolidation above that level could set the stage for further gains. This is likely, particularly if ETF inflows continue reinforcing investor confidence.
However, risks remain. Should selling pressure increase, Bitcoin may struggle to hold above key levels. A drop below $115,000 could open the door to a correction toward $112,500, invalidating the bullish thesis and cooling near-term momentum.

BTC Analysis — Long-Term Buy Zone AheadI'm watching $111,000 as a major buy zone on Bitcoin.
If price retraces to that level, I’ll be ready to enter a long position.
This is not a prediction — it’s a scenario.
Smart traders don’t guess, they prepare.
Let price come to your level. No chasing.
📍Set your alerts and stay patient.

BitCoin $BTC weekly demand level helping the strong rallyWeekly demand imbalance is still in control and is playing out well. A third large bullish candlestick body is being created. Trying to break the resistance level and the all-time highs.

#BTC/USDT - Are the bulls looking for a liquidity grab?#BTC
The price is moving within a descending channel on the 1-hour frame, adhering well to it, and is heading for a strong breakout and retest.
We have a bearish trend on the RSI indicator that is about to be broken and retested, which supports the upward move.
There is a major support area in green at 115,000, which represents a strong support point.
We are heading for consolidation above the 100 moving average.
Entry price: 115,600.
First target: 116,215.
Second target: 117,000.
Third target: 117,900.
Don't forget a simple matter: capital management.
When you reach the first target, save some money and then change your stop-loss order to an entry order.
For inquiries, please leave a comment.
Thank you.

BTCUSDT Long Aiming on 0.618FibBTCUSDT is positioned for a long move, targeting the 0.618 Fibonacci level, with potential extension toward the 0.7 level. With the anticipated U.S. rate cut announcement at market open, we expect a bullish bounce in crypto, followed by a possible short-term downtrend afterward.

BTC/USD Long Setup: RBR Zone Retest After Channel BreakoutTechnical Structure
Rising Channel (Highlighted in Red):
Price was moving within a bullish channel.
The channel was broken to the upside, indicating strong bullish momentum.
RBR Zone (Rally-Base-Rally):
A demand zone marked in red.
This area acts as a support zone where price is expected to bounce after a pullback.
It's the ideal entry area according to this strategy.
Current Price:
BTC/USD is trading around 117,910.63.
The price has just broken out of the channel and is expected to retest the RBR zone.
🎯 Trade Setup
Label Price Level Description
Entry Point 116,772.43 Ideal buy level after retest of RBR zone.
Stop Loss 116,077.82 Below the RBR zone. Gives room for a fakeout.
Target Point 120,013.92 Profit target based on the projected move.
📊 Risk to Reward Ratio (RRR)
Let's calculate the approximate Risk:Reward:
Risk: 116,772.43 - 116,077.82 = 694.61 points
Reward: 120,013.92 - 116,772.43 = 3,241.49 points
✅ Risk:Reward ≈ 1:4.67, which is excellent.
🔄 Expected Price Action
The chart suggests the following scenario:
Price breaks out of the bullish channel.
It retraces back into the RBR zone.
It finds support near the entry level.
A bounce follows, pushing BTC toward the target level of ~120,000.
📌 Summary
✅ Bullish setup after breakout from a rising channel.
✅ RBR demand zone suggests strong support at the entry.
✅ RRR is favorable (~1:4.67) — a good reward for the risk taken.
⚠️ Risk: If price drops below the stop loss zone, the trade idea is invalid.

ANFIBO | BTCUSD in my view todayHello guys! It's me, Anfibo.
Here is my Strategic and Market Sentiment Perspective :
I agree with the view that BITSTAMP:BTCUSD is currently in a compression phase. The market seems to be waiting for a catalyst (potentially economic data or macro news) to break out of this consolidation zone.
>>> Key observations:
Trading volume has shown signs of decline over the past few sessions, reflecting investor sentiment of waiting on the sidelines rather than taking strong action.
Funding rates and overall market sentiment remain positive but not overly euphoric, which is a healthy signal supporting the case for a sustainable upward move.
On the Daily timeframe, the primary trend remains bullish, and the current sideways movement appears to be a technical correction within the broader uptrend.
>>> Strategic approach for today:
> For short-term traders: consider accumulating small positions around the support levels of 115,200 – 114,400, with stop-loss orders set below 114,000 to manage downside risk.
> For medium-term investors: it is more prudent to wait for a confirmed breakout above the 117,000 – 118,000 resistance zone before scaling into larger positions, targeting the 120,000 – 123,000 levels.
Have a beautiful day!

What happened to the BTC pump? Been hearing about the BTC pump etc., but it was already priced in. Starting to cross key indicators DOWN. Now, we are seeing that the market has hit a ceiling and gravity is strong (correction). Wish all the crypto bros with lambos all the best, but it's going to cross 110k then 75k as whales leave and protect their liquidity (at least, what's left).

Bitcoin BTC price analysis FOMC Fed rate🚀 CRYPTOCAP:BTC price is rising, while altcoins remain silent.
What happens tomorrow when the Fed announces its new rate? 🤔
📊 Expectations:
98% believe in a -0.25% cut
2% expect -0.5%
and no one believes it will stay unchanged at 4.5%
That’s why the market has already priced this in. But tomorrow, once the official decision comes — everything could flip ⚡️
📉 The chart looks like chaos to most, but a "trained eye" sees harmony: candles moving level to level.
🔑 Key zones for OKX:BTCUSDT :
Upper channel boundary: $117,800 – $118,000 (only breakable on massive volumes).
September is statistically weak. It opened at $108K, that’s the “zero point”. Logical scenario — dip to $102K.
😬 Worse scenarios:
$96,500
GAP close at $91,600 (but you’ll roast us for this one 😂).
❓Your take: By the end of September, will #Bitcoin be above $108K or below?
______________
◆ Follow us ❤️ for daily crypto insights & updates!
🚀 Don’t miss out on important market moves
🧠 DYOR | This is not financial advice, just thinking out loud.

TA says ~40k by Sep 2026. Trend- base fib time between halving suggesting lows around Sep2026. We are in the top. Stop dreaming about 200K for this cycle.

BITCOIN UPDATEHello friends
According to the open cycle, we can say that our trend is bullish and is in a channel, but a resistance has stopped it, which it has hit twice. Now we have to see if this resistance will finally be broken or if the price will continue to suffer below this resistance.
If the price breaks the resistance, it will move to the specified targets.
Trade safely with us.

BITCOIN NEXT MOVE REVEALED!!!!! (this will make you scream) Yello Paradisers! In this video, we went through multiple timeframes as professional traders. We assumed things to analyze in Elliott Wave and other important indicators and advanced technical analysis tools. What's the next movement going to be with the highest probability!
Paradisers! Keep in mind to trade only with a proper professional trading strategy. Wait for confirmations. Play with tactics. This is the only way you can be long-term profitable.
Remember, don’t trade without confirmations. Wait for them before creating a trade. Be disciplined, patient, and emotionally controlled. Only trade the highest probability setups with the greatest risk to reward ratio. This will ensure that you become a long-term profitable professional trader.
Don't be a gambler. Don't try to get rich quick. Make sure that your trading is professionally based on proper strategies and trade tactics.

BTCUSD – Key Levels & Outlook Bitcoin trades near $115,445 as mBitcoin trades near $115,445 as markets weigh the upcoming FOMC rate decision that could spark broad risk-asset moves.
Key Levels
Resistance (1H): $115,668 – 116,318. A clean breakout above this zone could open the door to $116,600+.
Intermediate Zone: $115,532 – 115,477 around the 30m FVG (fair value gap).
Support (1H): $115,100, with deeper bids around $114,744 – 114,376 and a final line near $114,134.
Scenarios
Bullish: A dovish Fed or rate-cut surprise could lift BTC through the 1H resistance toward $116,600–117,000.
Bearish: If the Fed stays hawkish or signals fewer cuts, watch for a slide toward $115,100 and potentially $114,700.
Fundamentals
The FOMC decision (8 pm UTC-2) is pivotal. A rate cut would generally weaken USD liquidity costs and may boost crypto demand.
Risk sentiment is key—BTC often mirrors equity volatility during major Fed events.
⚠️ Plan: Expect heightened volatility around the announcement; confirmation of direction likely comes after the Fed press conference.
This is market commentary, not financial advice.
Greetings,
MrYounity

Bitcoin - H1 Accumulation and Possible Divergence in Play📢 NFX Market Update – COINBASE:BTCUSD
BINANCE:BTCUSD Currently in a strong support zone with major accumulation in play. Divergence formation in sight around support indicating high possibility for a bullish move soon
📊 The key question still remains: Will this support hold, or will price dip lower?
💬 Share your thoughts in comment below

Will Bitcoin break new highs?Bitcoin has seen no major market moves. Overall, the ascending channel remains intact, and there seems little more to elaborate on. We maintain our previous view: exchange time for space.
Key Resistance: The $116,800 level has become the main battlefield for bulls and bears. If it breaks through strongly, the short-term target will look toward $118,000 or even $120,000.
Key Support: The $114,400 level is the first line of defense below; a break below this level may lead to a retracement to $113,200.
If you agree with my views, please give me a thumbs up. Thanks for your encouragement and support.

BTC - WEEKLY OUTLOOK 🚀 #BITCOIN - Weekly Price Update 🚀
Trend: Bullish on the monthly chart, still marching higher!
Weekly outlook: The charts are flashing a bull‑continuation signal, but we’ll need next week’s candles to lock it in.
Daily vibe: Neutral territory.
Key daily resistance zones:
🔹 118,500 $
🔹 120,000 $
🔹 123,000 $ – 123,500 $
Right now the bulls dominate above 107k $ and 100k $. If we keep consolidating there, a fresh all‑time high could erupt soon.
Short‑term forecast: Expect a few sideways days with occasional rejections 📉.
My take:
🔸 A retest around 112,500 $ –-112,000 $ looks likely next.
🔸 For a solid long‑term play, we need a weekly candle closing above 120,000 $ backed by strong buying volume, that’s the green light for the next big upward wave!
🌐 #ALTS - Altcoin Market
With Bitcoin holding steady above the 110k $ mark, altcoins stand to gain from the added stability and resilience.
💡 Stay tuned, keep those alerts on, and ride the momentum!

BTCUSD HOURLY IDEA FOR, 17TH SEP, 2025.As usual, Price did it thing yesterday as it invalidated our step-up by moving back up and is currently trading around 117,000+ above a balance area within the range from 114,000 - 116,000. Price trades currently at 117,000 within the London open, and on a short retracement downward as we watch if the price is going to stay above the balance or go back into the previous range.

Fed rate cut in focus: Bitcoin eyes new ATHFed rate cut in focus: Bitcoin eyes new ATH
Markets are on edge ahead of today’s Fed decision, with a 25 bps cut to 4.1% widely expected. Traders see this as fuel for risk assets, though surprises could trigger sharp moves. Bitcoin leads the pack, backed by $230M ETF inflows and growing dominance over alts. Still, strong sell walls at $117K–119K signal heavy resistance.
Support remains firm at $111K–113K, where fresh demand continues to absorb supply from large holders. Momentum indicators show strength, similar to Q2 when BTC rallied from $105K to $120K.
Altcoins stay in the background: ETH faces outflows and struggles to hold above $4,500, while SEC delays on new ETF applications weigh on sentiment. Other majors like Solana and Ripple could see inflows if BTC stabilizes, but downside risks remain high if expectations disappoint.
