PRAENG pyramiding new price action 1. Set up - reversal from takeout / support zone
2. Trend Bullish
3. Fake out gave sharp rally
4. Probably target have room for 100% ROI
Bullishpattern

Inverse H&S2020 Analysis
Closed at 120 (15-01-2026)
Inverse H&S pattern appearing along with Bullish Divergence.
Immediate Resistance seems to be around 125 - 126.
Crossing & Sustaining this level may lead it towards 150+
However, it should not break the right shoulder now.

BMEX – The OG Perps Token Coiling for a Violent Mean-ReversionBitMEX birthed the perp casino long before Binance, Bybit and the rest. Its token has done what most neglected OGs do after launch: bleed inside a clean descending channel while nobody cares.
Now:
• Price has been grinding along the lower half of the channel and just put in a rounded base near the lows.
• Each push down is getting shallower, while bounces are stretching further – classic late-stage compression.
• A reclaim of the mid-channel (dotted line) opens the door for a full channel mean-reversion, with room toward the upper boundary and beyond if we see real FOMO.
In a market where new shiny memes keep rug-pulling, I’m watching the forgotten infra plays – and BMEX fits that bill: OG perp venue, tiny cap, ugly chart that finally looks ready to flip.
I’m not chasing green candles here; I’m stalking the channel break + retest for confirmation. Until then, this sits on my “potential face-melter” list.
As always: not advice, just the map. Trade your own plan.

hopes for a inverse head and shoulder pattern a good contestant looking for inverse head and shoulder pattern in ZOMATO(ETERNAL)

Trend Continuation DOTDOT - Trend Continuation Setup
In my previous post, I outlined the primary scenario in which we had already seen an A- and B-wave, followed by a C-wave completing within the 23.6% to 38.2% Fibonacci retracement zone.
This scenario has now played out as expected.
From the bottom of the (C)-wave, I currently assume that we have already seen an impulsive Wave (1) of a new 5-wave impulse structure.
However, this move only slightly exceeded the level of the previous Wave (3), which is why I do not yet consider the trend fully confirmed.
For proper trend confirmation, I would now like to see a shallow / flat Wave (2) correction. Such a controlled pullback would allow price to build energy and then break the previous high impulsively.
This would also increase the probability of DOT breaking above the Daily 50 EMA, which would further strengthen the bullish case.
As long as this structural scenario remains intact, I consider the higher-timeframe bias to remain on the long side.
Alternative Scenario (Lower Probability)
An alternative - less likely, but still possible - scenario is that the move previously labeled as Wave (3) was in fact already a Wave (5).
If this is the case, the prior impulse would be fully completed.
Under this scenario, we would have to expect a full corrective move of the entire impulse before any sustainable trend continuation can develop.
Key confirmations would be a clear break in structure and a lack of impulsive behavior on the upside.
At the moment, this is not my preferred scenario. However, if price action and structure start to shift in this direction, I will publish a separate post including a full visual breakdown of this alternative count.

RTY / IWM Weekly: Cup & Handle Projection to $3280A classic Cup and Handle formation has developed on the weekly chart of the [b ]Russell 2000 (RTY) ; this structure is also visible on the IWM ETF.
My target is based on the depth of the Cup, which projects a measured move to $3280 . This represents a potential 24% upside from current prices.
Not Financial Advice. For educational purposes only.

AAPL – Bullish Flag If the Catalysts Show UpApple is pulling back into a descending flag after a strong multi-month rally. This still looks like a healthy consolidation if the next move higher is backed by fundamentals. The bullish case needs catalysts to trigger: iPhone 17 supply catching up to demand, Services growth holding in the mid-teens (high-margin EPS leverage), and gross margins staying resilient despite higher AI spend.
If these start to confirm and price pushes higher, the flag can resolve to the upside. If not, a failure could lead to a minor correction toward the anchored VWAP, which would still be consistent with the broader bullish structure. The oversold RSI suggests downside may be limited near-term, supporting the idea of consolidation rather than a full trend break.

Maybe a new ATH ?as we can see the market still bullish in the high time frames, but also there is a FVG in the daily hit on thursday, so thats another strong confirmartion. And now if we look at 4h time frame we have a FVG and an order blocks to be tested.
after that we can see a probable continuation toward the last week highs.

GBP/USD Possible imminent Longs My bias on GU this week is aligned with the rest of the market — looking for short-term bullish continuation. Price is currently reacting from a 12hr demand zone, and I expect this area to hold given its prior validation.
There is also a deeper, more discounted demand zone sitting at the extreme of the recent bullish structure, which remains a secondary area of interest if price pushes lower.
Confluences for GU Buys:
• Overall structure remains bullish, despite a recent CHOCH to the downside
• Higher-time-frame bias is still bullish unless we see a clear BOS to the downside
• Clean 12hr and 1hr demand zones in close proximity
• Price is slowing down, increasing the probability of a stronger reaction
• DXY approaching supply, supporting potential upside in GU
P.S. Since we’ve seen a change of character, this bullish move may be corrective, potentially leading into a reaction from a higher supply zone. Trade with awareness and adapt to price.

LONG IIFL Finance (IIFL.NS) due to turnaround thesis
Fundamentals: Swung from loss to profit on margin recovery and credit normalization.
Technicals: Breakout from previous relevant swing highs with volume above 20SMA. Crossover with 30 EMA and 50 EMA.
I'm LONG IIFL Finance @ $649.30
SL or TP: When it closes below 50 EMA (WEEKLY)

NIFTY Analysis: Crucial Support Levels and Trend Reversal ZonesNIFTY 26500 CE – February Expiry
This is the 15-minute timeframe chart of NIFTY 26500 Call Option (Feb Expiry).
The chart is indicating a strong support zone in the range of 140–150.
If the option price holds above this support zone, a reversal can be expected from this level.
This may lead to positive upside movement in the NIFTY 26500 CE.
THANK YOU !!

Bullish retest possible on $NEARBullish retest possible on CBOE:NEAR 🚀
Key support to be maintained for this setup: 1.580 - 1.600$
I remain cautious under 1.840$ daily basis (key resistance weekly).
A breakout above with fresh volume would lead to a huge bull pressure 📈

GBPUSD: Buy Continuation After Wave 4 CorrectionHappy New Year 2026! We're back in business. Cable remains bullish with clear buy setup after structural pullback completion.📊 Overall Trend Analysis: Primary Trend: BULLISH ✅The GBPUSD (Cable) maintains its upward trajectory. The larger structure remains intact with clear bullish momentum.🌊 Wave Structure Breakdown: Wave 3 (Momentum High): Completed ✓
Strong upside move establishing the bullish momentum high. Wave 4 (Structural Pullback): Completed ✓
Healthy correction retracing to structural support. Current Position: Ready for Wave 5 (Final Bullish Leg)📈
Price Formation Analysis: Key Pattern Identified: Higher Low (HL) Retracement The pullback has formed a Higher Low, which is the classic bullish retracement pattern. This HL formation confirms:
✅ Buyers stepped in at higher levels
✅ Structural support held
✅ Uptrend integrity maintained
✅ Buying is now allowed for continuation
Expected Move:
Price should break above Momentum High 3 to complete the bullish wave structure and form Wave 5.💼 Trade Execution Plan:
Buy Entry: Above 1.3499
Wait for break and close above this level to confirm continuation.
Stop Loss: 1.3482
Risk: 17 pips
Invalidation if price breaks below, suggesting deeper correction.
Targets:
T1: 1.3604 (105 pips potential)
T2: 1.3662 (163 pips potential)
To T1: 6.2:1
To T2: 9.6:1
🎯 Trading Logic:
Why This Setup Works:
Trend Alignment: Trading WITH the bullish trend (highest probability)
Wave Structure: Clear Wave 4 pullback completion
HL Pattern: Higher Low confirms bullish structure
Break & Retest: Entry above 1.3499 confirms momentum return
Clear Invalidation: Stop below 1.3482 keeps risk tight
Strategy:
Wait for price to break above 1.3499, confirming buyers are back in control. This breakout triggers Wave 5 continuation toward targets.
Key Levels Summary:📍 Entry Zone: Above 1.3499
🛑 Risk Management: Stop at 1.3482
🎯 First Target: 1.3604
🎯 Extended Target: 1.3662
📊 Wave Position: Ready for Wave 5 bullish completion
Happy New Year 2026! Let's start the year with clear structure and high-probability setups. 🎆👍 Hit the boost button if you're trading this setup
👤 Follow for continued GBPUSD analysis
💬 Happy New Year traders! 🎉

$ETC - Bullish breakout & Setup BME:ETC - Bullish breakout & Setup 📈
Upper levels i'm watching:
⚠️13.60$
🎯14.10
🎯14.80 - 15.10
🎯15.70
🎯16.50
Pump potential: 15%+ 💥

ONDO - BULLISH OUTLOOK: LSE:ONDO - price analysis:
Strong bullish momentum; but key resistances ahead

GOLD (XAUUSD) – Inverted Head & Shoulders Setup📊 Technical Outlook
Gold is currently forming an inverted head & shoulders pattern, with the right shoulder established around 4308. Price action is consolidating near the neckline zone (4380–4400), and a confirmed breakout above this level would validate the bullish continuation.
🎯 Upside Targets
• TP1: 4540 – First long-term target aligned with measured move projection.
• TP2: 4650 – Extended bullish target, continuation of momentum.
📈 Trade Plan
• Entry Zone: Accumulation around 4308–4320, confirmation above 4380–4400.
• Stop-Loss: Below 4300 (invalidates right shoulder).
• Take Profit:
• TP1: 4540
• TP2: 4650
⚠️ Risk Notes
• A breakdown below 4308 risks invalidating the bullish setup.
• Watch for false breakouts at 4380; volume confirmation is key.
• Macro drivers (Fed policy, inflation, geopolitical tensions) may add volatility.
📌 Summary: As long as 4308 holds, gold remains bullish with potential continuation toward 4540 and 4650. Breakout above 4400 is the trigger for momentum buyers.

DLTR | Something is Brewing for Dollar Tree | LONGDollar Tree, Inc. owns and operates discount variety stores offering merchandise at fixed prices. It operates through the Dollar Tree business segment. The Dollar Tree segment includes operations under Dollar Tree and Dollar Tree Canada brands, with its distribution centers in the United States and Canada. The company was founded by J. Douglas Perry and Macon F. Brock, Jr. in 1953 and is headquartered in Chesapeake, VA.

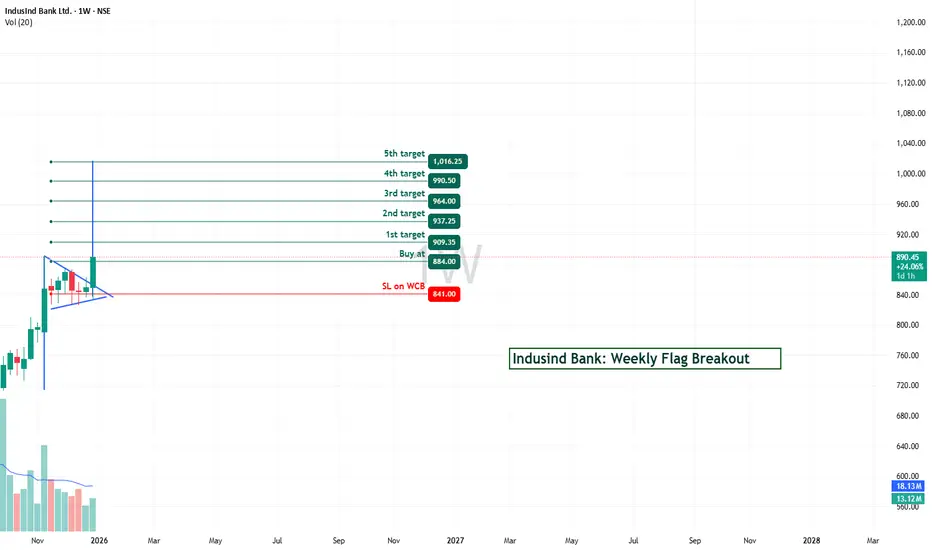
INDUSINDBK Bull Flag Breakout | Target ₹1,016+ | Weekly AnalysisINDUSINDBK Bull Flag Breakout | Target ₹1,016+ | Weekly Analysis
━━━━━━━━━━━━━━━━━━━━━━━━━━━━━━━━━━━━━━━━━━━
📊 TECHNICAL SETUP
Current Price: ₹890.20 (+3.01%)
Timeframe: Weekly (1W)
Pattern: Bull Flag Breakout (Confirmed)
Exchange: NSE
Sector: Banking / Financial Services
━━━━━━━━━━━━━━━━━━━━━━━━━━━━━━━━━━━━━━━━━━━
🎯 PATTERN ANALYSIS
IndusInd Bank has formed a TEXTBOOK BULL FLAG pattern on the weekly timeframe:
✅ Impulsive Move: Strong upside momentum establishing the flag pole
✅ Consolidation Phase: Higher lows and controlled pullback forming the flag
✅ Breakout: Successful breakout above flag resistance at ₹884.00
✅ Volume Confirmation: 12.8M-13M weekly volume confirming strength
✅ RSI Divergence: Advanced RSI showing Regular Bullish Divergence
The stock has decisively moved above the consolidation zone, confirming bullish intent. Bull flags are continuation patterns with approximately 75% success rate on higher timeframes.
━━━━━━━━━━━━━━━━━━━━━━━━━━━━━━━━━━━━━━━━━━━
📈 PRICE TARGETS (Progressive)
1st Target: ₹909.35 (Immediate) - 2.1% from current
2nd Target: ₹937.25 (Short-term) - 5.3% from current
3rd Target: ₹964.00 (Medium-term) - 8.3% from current
4th Target: ₹990.50 (Extended) - 11.3% from current
5th Target: ₹1,016.25 (Long-term) - 14.1% from current
Targets are derived from flag height projected from the breakout point, a standard technical approach for pattern continuation measurements.
━━━━━━━━━━━━━━━━━━━━━━━━━━━━━━━━━━━━━━━━━━━
🛡️ RISK MANAGEMENT
Entry Zone: ₹884.00 - ₹890.20 (Breakout confirmation)
Stoploss: ₹841.00 (Weekly Close Entry basis)
Risk/Reward Ratio:
- Risk (890 to 841) = 49 points
- Reward (890 to 1016) = 126 points
- R:R Ratio = 1:2.57 (Excellent)
Position Sizing: Risk only 1-2% of your capital per trade
Stoploss placement is BELOW the consolidation zone.
━━━━━━━━━━━━━━━━━━━━━━━━━━━━━━━━━━━━━━━━━━━
📍 KEY LEVELS
Immediate Support: ₹884.00 (Breakout level)
Secondary Support: ₹841.00 (Stoploss level)
Resistance 1: ₹909.35 (1st Target)
Resistance 2: ₹937.25 (2nd Target)
Major Resistance: ₹1,016.25 (Long-term Target)
━━━━━━━━━━━━━━━━━━━━━━━━━━━━━━━━━━━━━━━━━━━
⚙️ ACTIVE INDICATORS
🔹 Volume Profile (20-period)
Confirming accumulation and rising breakout volume
🔹 Advanced RSI Divergence Detector (14-period)
Regular Bullish Label detected
RSI at 60 level (Strength confirmation, not overbought)
🔹 Dynamic Swing Anchored VWAP
Providing dynamic support during uptrend
━━━━━━━━━━━━━━━━━━━━━━━━━━━━━━━━━━━━━━━━━━━
✨ TRADING STRATEGY NOTES
• Bull flags have ~75% success rate on weekly timeframes
• Weekly breakouts carry higher conviction than intraday
• Volume confirmation during breakout is CRUCIAL - present here
• RSI bullish divergence adds confluence to thesis
• Consider taking partial profits at each target level
• Trail stoploss after hitting first target (₹909.35)
• Manage position size according to your risk tolerance
━━━━━━━━━━━━━━━━━━━━━━━━━━━━━━━━━━━━━━━━━━━
⚠️ CRITICAL DISCLAIMER
🔴 THIS IS TECHNICAL ANALYSIS FOR EDUCATIONAL PURPOSES ONLY
🔴 THIS IS NOT FINANCIAL ADVICE OR AN INVESTMENT RECOMMENDATION
This analysis:
- Is based on historical price patterns and technical indicators
- Does NOT constitute investment advice or a buy/sell recommendation
- Is my personal observation and analysis
- Should NOT be the sole basis for any investment decision
━━━━━━━━━━━━━━━━━━━━━━━━━━━━━━━━━━━━━━━━━━━
⚠️ IMPORTANT RISKS TO UNDERSTAND
✓ Past performance does NOT guarantee future results
✓ Technical patterns can FAIL and breakouts can reverse
✓ Market conditions can change rapidly without warning
✓ This analysis is based on historical data only
✓ All equity investments carry significant risk of loss
✓ You may lose your ENTIRE investment amount
✓ This is a pattern observation, NOT a guaranteed trade signal
✓ Consult a qualified financial advisor before trading
✓ Do your own independent research (DYOR)
✓ Use strict position sizing and risk management
✓ Never trade with leverage unless you fully understand risks
✓ News events, earnings, and market gaps can invalidate patterns
✓ Market liquidity and slippage can affect entry/exit prices
✓ Regulatory changes can impact stock performance
━━━━━━━━━━━━━━━━━━━━━━━━━━━━━━━━━━━━━━━━━━━
🔴 FINAL RISK ACKNOWLEDGMENT
TRADING AND INVESTING IN STOCKS INVOLVES SUBSTANTIAL RISK OF LOSS.
I am NOT a financial advisor, fund manager, or investment professional. This analysis is provided for educational purposes only.
BEFORE MAKING ANY INVESTMENT DECISION:
✓ Conduct your own thorough research
✓ Understand the company's fundamentals
✓ Check news and recent developments
✓ Verify your risk appetite and capital availability
✓ Consult with a qualified financial advisor
✓ Only invest capital you can afford to lose
✓ Never follow this as a guaranteed strategy
Your investment decisions are YOUR responsibility. Use proper risk management, stop losses, and position sizing.
━━━━━━━━━━━━━━━━━━━━━━━━━━━━━━━━━━━━━━━━━━━
Trade responsibly. Risk management is paramount.
#INDUSINDBK #BullFlag #TechnicalAnalysis #NSE #Trading #Breakout #WeeklyChart
XAUUSD H4 Buy Limit | Trend Continuation Setup📊 XAUUSD Technical Analysis (H4)
Price is moving within an ascending structure and continues to respect the bullish trendline.
After a healthy pullback into the demand zone, a continuation to the upside is expected.
🔹 Entry Zone: Buy Limit at 4258 – 4216
❌ Stop Loss: Two H4 candle closes below 4196
✅ Target: 4353
📌 Once the buy limit is activated, partial risk management will be applied.
After price reaches 4290, the position will be secured by moving to break-even (risk-free).
⚠️ Always manage your risk properly.
Wishing you success and victory,🧿❤️✌️
FXG Team Management” 🏅

Elliot Wave 5 - ZBT🐂 LONG – ZBT
Chart structure shows a clean Elliott Wave sequence, with price currently advancing in Wave 5. Volume expansion confirms strong participation and momentum, supporting continuation rather than distribution. This setup favors a final impulsive leg higher before any meaningful correction.
🎯 TP: 0.30
🛡️ SL: 0.1372
📊 RR: 1 : 6.4
A high-quality long: Elliott Wave completion + volume breakout → strong trend continuation with asymmetric reward.

Next bullish pattern target for gold is at $8,195After my smaller timeframe gold chart played out to an exact T with absolute precision, I decided I woud zoom out to try and find the enxt possible pattern and breakout target. I am on the log chart here and we can see how on the long timeframes on log chart, the gold chart is just a series of bullflags. Of which the one with the longest flag pole we have just recently broken up from, when taking a measured move of that flagpole shown here with the tan trendline, and placing it at the breakout point of the flag, we can see there is a measured move target that goes all the way to $8,195. Impressive if this one plays out with anywhere close to the same precision as my last gold chart did. *not financial advice*

4H TRADE IDEA FOR FOR XAUUSDGOLD Is on an overall uptrend and still going to push higher later on, but currently we are on a retracement, and it's going to keep pushing all through today, and resume its continuation

FARTCOIN / USDT Daily Close Above Key Zone— Upside Targets AheadFARTCOIN / USDT can maintain its bullish continuation if the next daily candle closes firmly above the $0.2540–$0.2725 zone. A strong hold and positive reaction from this area would open the door for a clean move toward the $0.35–$0.37 range. Wait for confirmation and manage risk carefully before entering.
