EURUSD BullishGoing for Long Trade with Limit Order in Discount Zone with Proper Risk Management, let's see what Price do next.
Bullishpattern

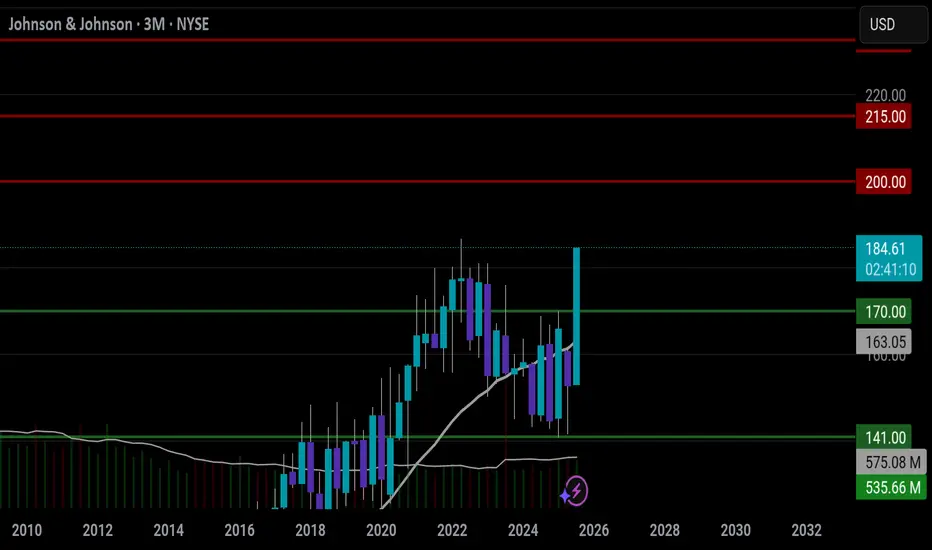
JNJ APPROVEDNYSE:JNJ has recently shown a bullish chart pattern on the 3-month timeframe, which in my view suggests the stock may be aiming for new all-time highs. That makes it, in my opinion, a good stock to hold in a portfolio over the next 2 to 3 months.
This is not financial advice.
HUMAUSDT - shiny coin!3d chart showing a breakout of descending channel after 120days of consolidation ... retest is running
patience must be rewarded.
Best regards:
Ceciliones🎯

#$XAUUAS Uptrend Hello traders friends
My forecast on #XAUUSD
I think continue to wait for gold buying power to 3900 and creating new ATH
Best regards, Honeytrading

Swing Trade Took Long Position in CHFJPY as per Order Flow with Proper Risk Management, Lets see what Price do next

Long Trade Setup As u can See the Overall View is Bullish as per Market Structure so we are Looking for Buys at Discount with proper Risk management.

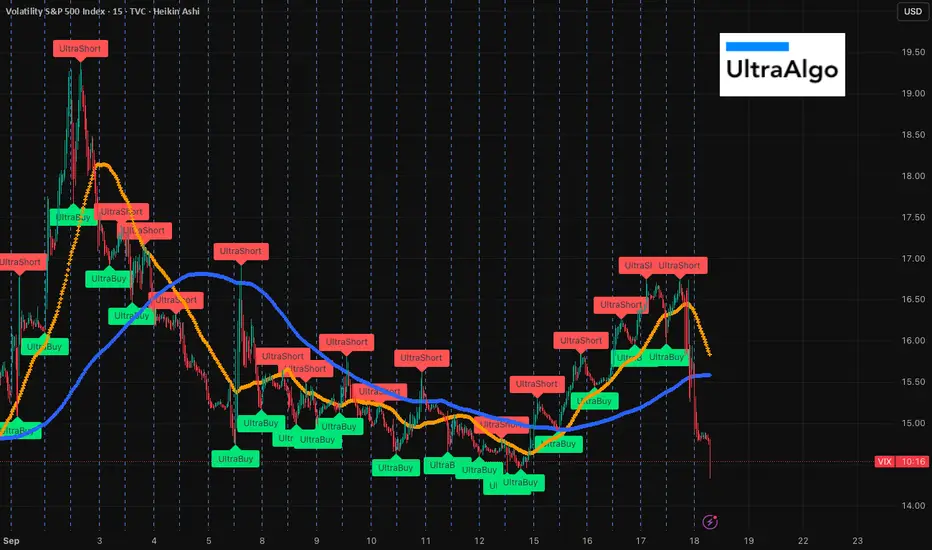
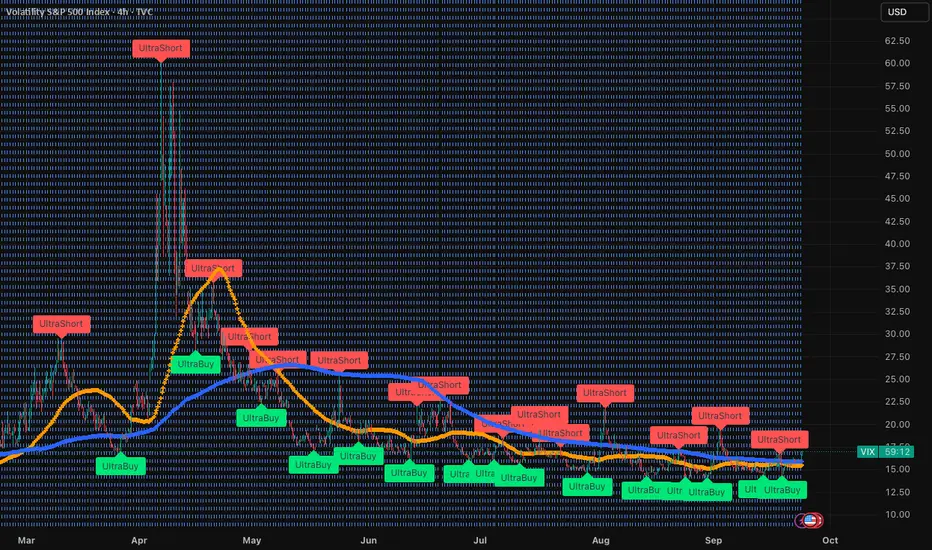
VIX set-up....interesting week aheadTo the untrained eye, you see VIX go up and down, just like any other time. Taking a big step back, you'll know that VIX has been super complacent (very strange looking back 30 years) for about 6 months. Over the last few days, we see SMA9 crossing UP SMA50! Why does this matter? Because when VIX spikes, it really spikes! Next week we have the gov shutdown and a lot of funky things going on with Russia / NATO that can spark something big, hopefully not! Many other news could spike it, but we've seen a weakness in the general market and potentially a Volmageddon 2.0 in the making. Put your alerts on and nice upside with $UVIX!

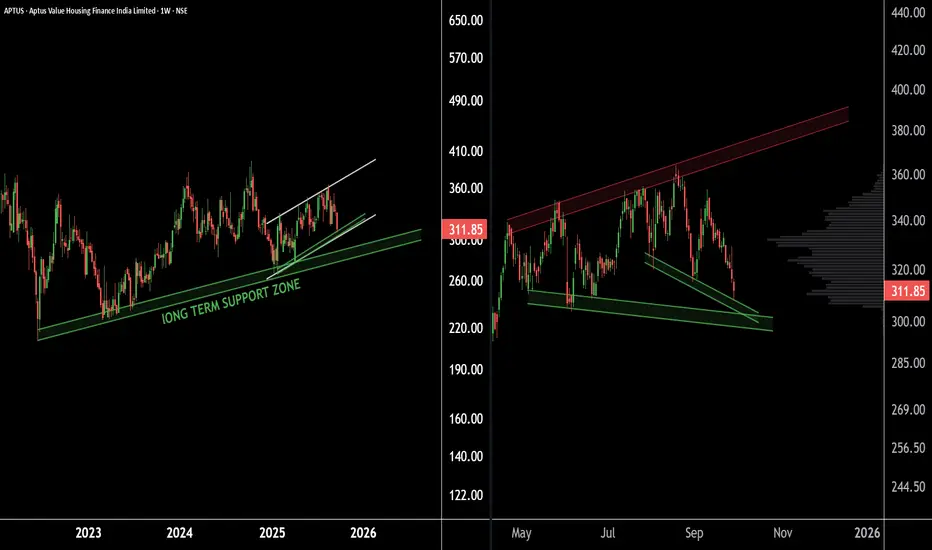
APTUS | High Probability Trading Zone IdentifiedAPTUS Technical Outlook
On weekly timeframe, APTUS is currently respecting its long-term support zone near the 270-280 range.
On the daily timeframe The stock is trading within a well-defined parallel channel, maintaining a Higher High – Higher Low (HH-HL) structure with a key support around 300 levels.
Additionally, a broadening pattern is visible, with strong support holding near 300 levels.
If this zone sustains, APTUS has the potential to move towards higher price levels in the coming sessions.
Thank You !!
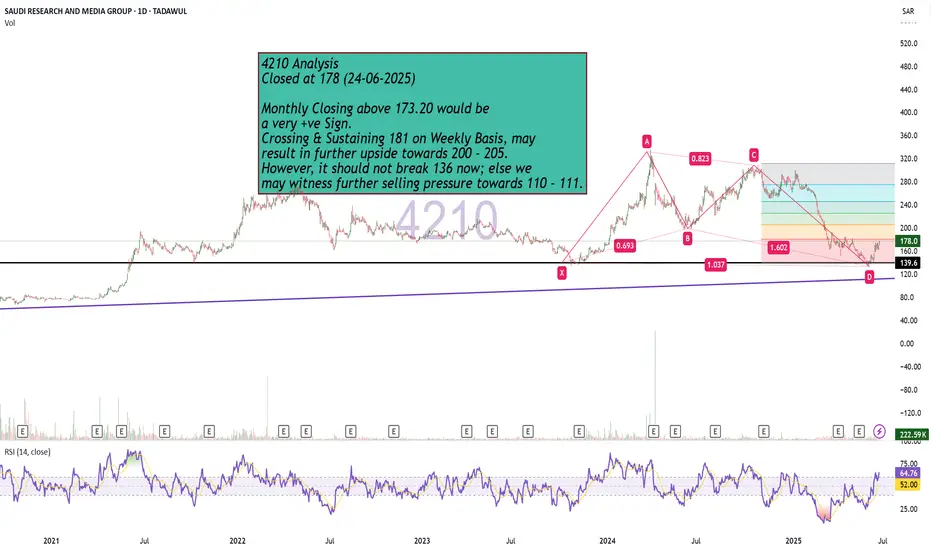
Bullish Monthly Candle Expected?4210 Analysis
Closed at 178 (24-06-2025)
Monthly Closing above 173.20 would be
a very +ve Sign.
Crossing & Sustaining 181 on Weekly Basis, may
result in further upside towards 200 - 205.
However, it should not break 136 now; else we
may witness further selling pressure towards 110 - 111.
LALPATHLAB BullishLALPATHLAB 🟢
Shows continuous profitable growth
EPS growth per year is seen by almost 10 to 15%
Sales growth is also consistent

$VIX We only just started! Volmageddon 2.0Zoom out on the VIX and you'll find that there is A LOT more runway. Study the VIX for the last 30 years and you'll find that it bottoms out and explodes. We are not at a turning point in the markets with ultra high "hot air balloons" that will come down with a correction that is long overdue. The VIX hasn't been this low in a very long time, so you want to keep the proxy CBOE:UVIX in your radar. Happy trading! Always look to make lemonade out of lemons :)
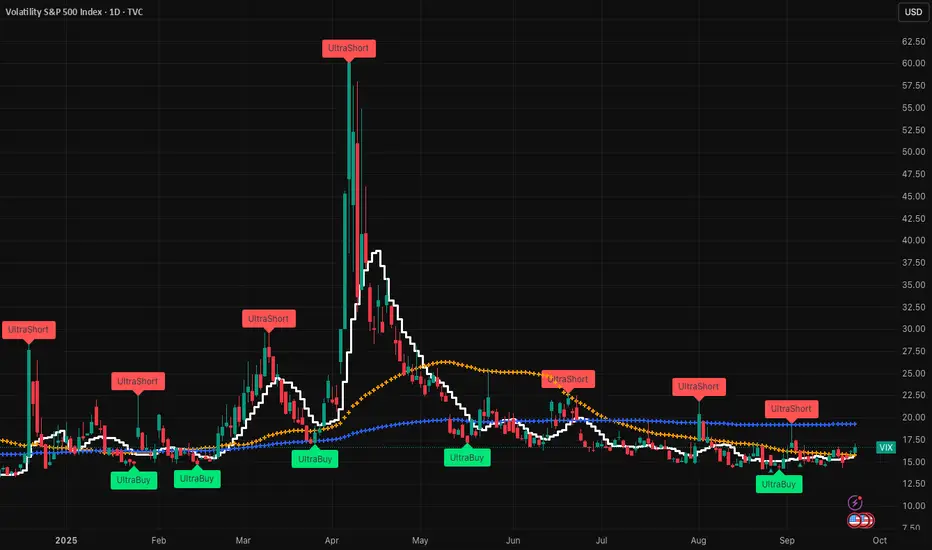
Volmageddon 2.0 in the making.....must watch!I have been saying this for months! Keep an eye on the VIX, always! Yes, it's been down for 5-6 months in a very unnatural way, but things are about to take a turn and potentially in a big way. Ultra-high valuations, crap unemployment, defaults through the roof, PE/CAPE ratios at historic levels, and highest concentration / weight in the stock market. 10 tech companies buying from each other like very good friends with 100% capex that hasn't been spent = 40% of S&P, seriously, WTF! In any case, it's not rosy, and we are overdue a massive spike in the VIX. Use the proxy ETF CBOE:UVIX and add alerts. Best of luck!
Momentum Speaks: Crude Oil Buy OpportunityCrude Oil Momentum Buy Setup
4H & 15M Timeframe View
Crude Oil is respecting the channel lower boundary with reversal from 5460–5490 support zone.
Currently moving in momentum, with Supertrend also confirming buy-on-dip opportunity.
Watch for pullbacks near 5540–5550 support (Supertrend zone) for potential entries.
Thank you!

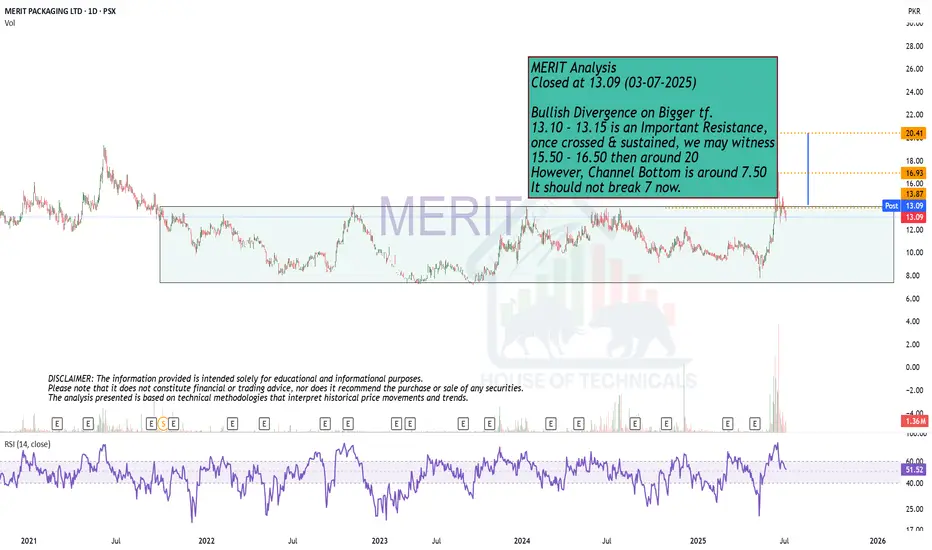
Bullish Divergence on Bigger tf.MERIT Analysis
Closed at 13.09 (03-07-2025)
Bullish Divergence on Bigger tf.
13.10 - 13.15 is an Important Resistance,
once crossed & sustained, we may witness
15.50 - 16.50 then around 20
However, Channel Bottom is around 7.50
It should not break 7 now.
Interesting play MSTZMSTR has been under a cloud lately, and if we take a closer look at MSTZ we find that it's slowly creeping higher. Notice how SMA50 is crossing up SMA200. This will become a very interesting play when the price crosses below $300.

$VIX trending up nicely.....buckle your seatbeltVIX has been on the downside for the last few months, mostly because of much f$ckery in the market that is running super hot. I would not be surprised if it crosses 20 this week! You can use UVIX as the proxy. Best of luck! This could be magical

Litecoin LTC – Bounce Setup in Play📊 CRYPTO:LTCUSD has completed a corrective move into the equal legs zone at $102–$97, aligning with the April uptrend channel—a classic Elliott Wave support confluence. This area is primed for a bullish reaction, with buyers likely stepping in to fuel the next leg higher.
🎯 With bullish structure intact, the next upside target within this cycle is projected at $147, marking a potential Wave 5 extension.
#ElliottWave #Altcoins

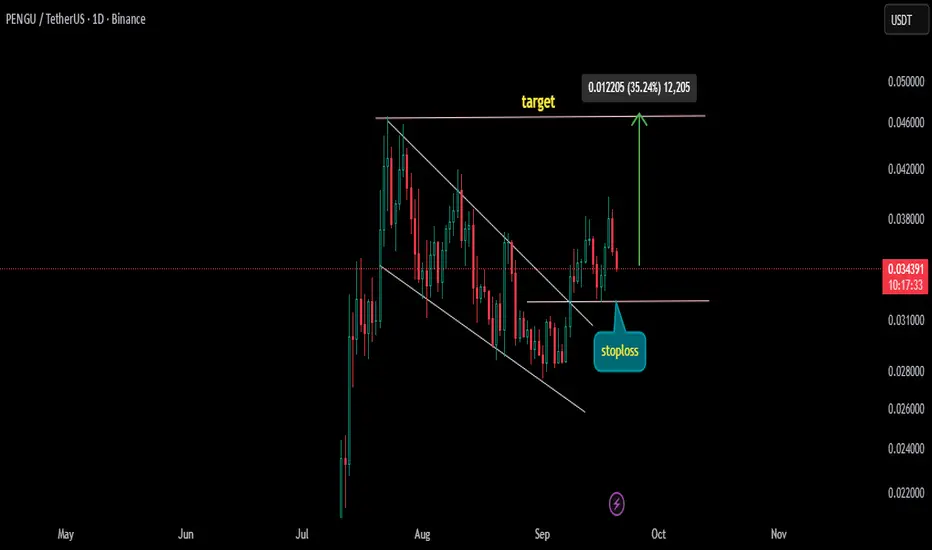
Rising Wedge pattern on PENGUUSDT A Rising Wedge Pattern is triggered on Charts . this chart pattern is considered to be highly profitable by traders on longs, always puts stoploss on neckline of pattern as shows in charts
MNTTrend Verification on TradingView ChartsCurrent Price and Snapshot: ~$1.708 USDT (spot/perp aggregated from Bybit/Binance). 24h change: -5.47% (mild pullback today).
Weekly: +2.71%. Monthly: +23.88%. YTD: +183.63%. All-time high (ATH): $1.765 (hit Sep 13, 2025).
Overall Trend:
MNTUSDT experienced a short-term downtrend/pullback from the Sep 13 ATH ($1.765), dropping ~3-5% in recent sessions amid broader altcoin consolidation (BTC at ~$117K stable, ETH ~$4,450). However, this follows a strong recovery and reversal from earlier lows:
Daily Timeframe: Bullish reversal confirmed. Price broke out of a multi-month ascending channel in early Sep, rallying 20-30% from ~$1.30 support (Aug lows). Recent action: Pullback to $1.70 after ATH, forming a potential bull flag or rounding bottom. Higher lows since $1.30 indicate recovery from prior downtrend (e.g., Q2 2025 stagnation).
Technical rating: Strong buy (based on MA crossovers and oscillators).
4H Timeframe: Neutral-to-bullish. Price retesting $1.70 as support after breakout above $1.60 resistance. Candlestick patterns: Recent doji/hammer at lows suggest buyer exhaustion reversal. If holds $1.70, targets $1.80+ (Fib 1.618 extension from Aug swing).
1H Timeframe: Short-term bearish pressure from today's dip, but volume fading on downsides indicates weakening sellers.
Long entry
1.68-1.70
1.63
1.6
stoploss:1.57
tp
1.71
1.73
1.75
1.8
3-5x leverage

Archer (ACHR) Bullish Pennant Breakout?I love this chart setup so wanted to share. It has a little bit of everything from market structure, fib levels, pattern recognition, falling wedges.. a bullish backdrop for tech, speculative plays, and the air transportation sector in particular.
Archer's top competitor is $JOBY. They have been performing amazing as of late, experiencing all time highs, even. During the last few months though I have watched NYSE:ACHR closely looking for an opportunity to diversify and buy up some real estate. Now is looking like a decent time to start accumulating for a swing trade in my humble opinion.

CADJPYLong Calll
D. Bottom Structure Bouncig from support
Bullish .DIV
Manage risk Book profits timely

Long term demand zone is holding nicely on $COW Long term demand zone is holding nicely on TSX:COW 📈
The next move could be explosif! 🚀
Relly bullish FA on the DEX they are building.
Bulls may be in control above 0.300$. .

What will happen to VIX after another crappy jobs report today?While there is no crystal ball, the jobs market is beyond horrible and many precursors to a massive pullback on coming together; credit defaults, unemployment (after several revisions, each one worse than the last one), China pulling back on US based AI tech (what AI bubble?), and valuations that peak dot.com bubble. The VIX has been unnaturally low, hedge funds are shorting it!, and let's not forget volmaggedon! Could spike any second and it likely will before people get too complacent. This is a recipe for v-maggedon 2.0. Bullish on the economy, but not blind to facts and historical standards when things look very wonky. Best of luck out there! Everyone is a genius when the market is up :)