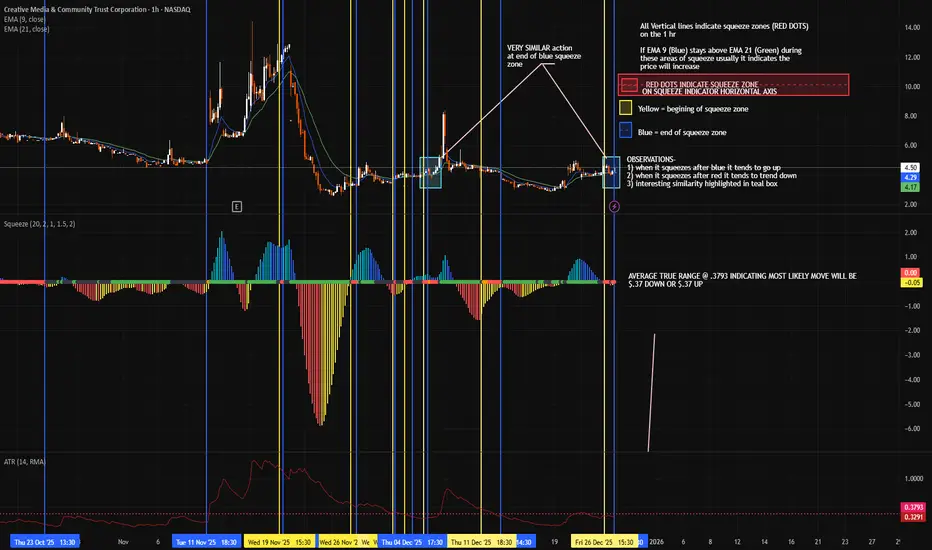
CMCT Squeeze Indicator AnalysisUsed the EMA 9, EMA 21, Squeeze Indicator, and ATR indicator to map out squeeze zones and price movement in the last month plus. The bulls over at CMCT have brass balls and diamond hands and have locked the float. Despite massive manipulation this thing is about to go to the moon. Last week they washed 60% SI down to 4% on Monday with no covering and just last Thursday accrued another 56% Live Short Interest just to suppress the momentum. The pressure cooker is boiling and the shorts keep trying to put the fire out with gasoline by continuing to short with 400% CTB. I am no chart guru, this is my first time posting a chart and my first time using any of these indicators. Regardless, Ive been hodling and accumulating for 2 weeks and can sense the shift. Now would be a great time to get in and HODL for 20+ Lets finish 2025 with a bang! BULLS UNITE!
Bulllish
Cardano Reversal Incoming?Hey traders,
After a tough 2025 (-70% YTD), Cardano is flashing one of the strongest setup I've seen for a reversal.
Why I'm buying ADA now:
Weekly Fibonacci Perfection: Price is hugging the 1.0 retracement level (~$0.37) from the recent swing high – this has acted as major support multiple times. Holding here = classic bottom formation. (Check the weekly chart – we're right on it!)
Undervalued AF: At ~$0.37–$0.38, we're at levels not seen since early cycle lows. Heavy realized losses in December ($900M+ capitulated) means sellers are exhausted – prime time for accumulation.
Friday Price Action = Strong Buyers Showed Up: Last Friday's candle defended the lows hard, closing with conviction. Volume picked up on the bounce, and we're seeing exchange outflows + whale adds. Reversal signals like TD Sequential buys and oversold RSI divergence are aligning.
Short-term: Watching for a break above $0.42–$0.45 resistance for confirmation. If we hold $0.36–$0.37 support, targeting $0.50–$0.54 next (prior highs), then $0.70+ if momentum kicks in.
Long-term still bullish with upgrades - Key Catalysts for 2026
Ouroboros Leios (Q1 rollout): Major consensus upgrade for 1,000+ TPS scalability while maintaining decentralization.
Midnight mainnet (early 2026): Privacy sidechain with selective disclosure, potentially boosting cross-chain adoption and NIGHT token synergy.
Bitcoin DeFi integration and tier-1 stablecoins (USDT/USDC): Aimed at deepening liquidity and TVL growth.
Systemic resilience focus, governance maturity, and treasury-funded initiatives (e.g., Venture Hub, DeFi liquidity injections).
Not financial advice , manage risk! What's your take on ADA here?

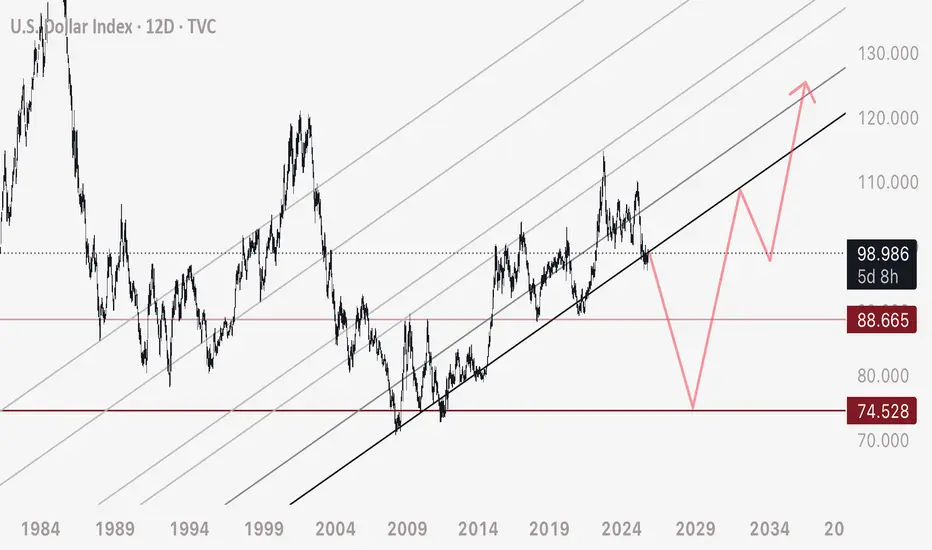
DXY - Major Breakdown of Ascending ChannelAs a preface here, I am not a Forex trader. I analyze DXY as a method for predicting manipulated moves on Bitcoin / Cryptocurrency.
Since I started with DXY analysis some 8 odd years ago, I’ve used the same channels. Price seems to (without argument) respect this channel and move in this fashion. So if anyone reading this has tips or knowledge I am missing. I’d appreciate the tips and insights.
I draw here my expected DXY path - and related to that, the span of a true bull market on stocks and equities (4-7 years long beginning current)
I’ll be using this post here to use as a reference for my analysis of a Bitcoin flash crash to 8,000 USD. Bitcoin has always seem to react to major pivots on DXY (in this case, a bearish retest).
Love and respect to all of you.
- DD
Update & Technical Analysis — PEAQ🔄 Update: In the previous setup, price made a dead cat bounce with a fake breakout, and continued its downside move.
Now, the chart has formed a falling wedge, which is considered a strong bullish pattern.
A breakout above the wedge’s resistance could be a solid trigger.
✅ Confirmation of trend reversal will be at 0.0875 in MWC (Medium Wave Cycle) and at 0.1880 in HWC (High Wave Cycle).
⚠️ Please remember: using this analysis requires strict risk management and capital management.
What’s your view on $PEAQ? 👇

RELAXO FOOTWEARS A GOOD 2X CANDIDATE Relaxo Footwears Ltd, one of India’s leading footwear companies
👟 Brand Portfolio
Relaxo operates under several well-known sub-brands:
- Sparx – Sporty and casual shoes
- Flite – Lightweight slippers and sandals
- Bahamas – Youth-centric flip-flops
- Schoolmate – School shoes
- Boston, Belle, Mary Jane, Kid’s Fun – Niche and seasonal offering
🌍 Market Position
- Largest footwear manufacturer in India by volume
- Second-largest by revenue
- Ranked among India’s Top 500 Most Valuable Companies
- Strong presence in value segment (non-leather products like EVA/rubber slippers and canvas shoes)
TECHNICAL
- Momentum: Strong short-term bullish breakout
- Trend: Above key moving averages with RSI and MFI confirming strength
- Watch Zone: 500–510 for resistance; 470–480 as support
SHORT TERM TGT- 575-600
LONG TERMG TGT- 750-900

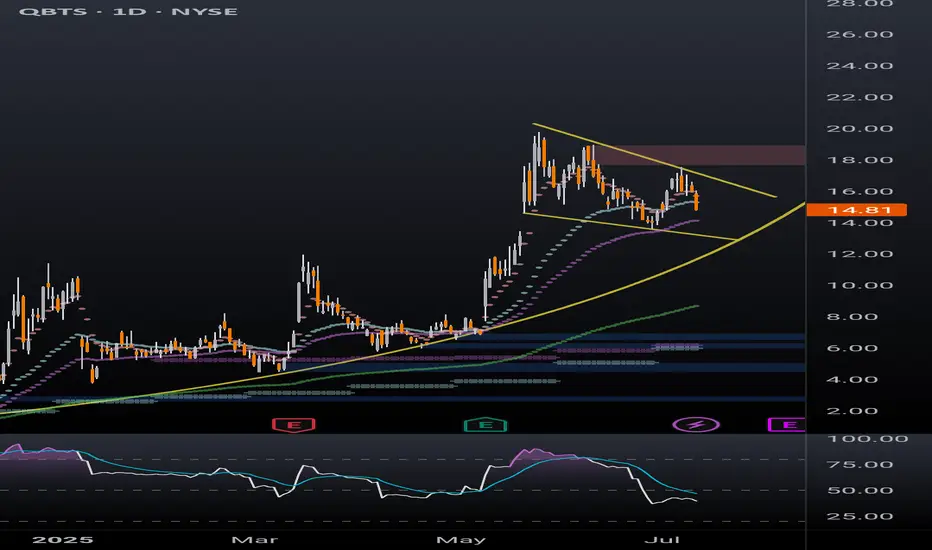
QBTS bull flag dailyBetter look at quantum computing ticker QBTS bull flag on the daily timeframe. Previous post looked at the weekly timeframe to highlight the bullish momentum. Lots of retail money piled into this one in the last few months, a breakout of this bull flag will likely be followed by a parabolic move.
Pullback's Almost Over — Get In Before It RunsThe best time to enter in a bull market is during a pullback — when price temporarily retraces before continuing its upward trend.
In the case of BINANCE:SUPERUSDT , price is currently pulling back into a demand zone between 0.7178 – 0.7109. The overall structure remains bullish, with the blue arrows showing a series of higher lows and the red arrows indicating higher highs.
We expect the price to bounce from this demand zone and potentially break the previous high, continuing the bullish trend.
To confirm the pullback is ending and a reversal is underway, we’ll watch for candlestick patterns. Here are two possible bullish confirmation scenarios:
Price breaks and closes above the high of the last red candle — a bullish engulfing setup.
Price dips deeper into the demand zone, then forms a bullish pattern such as:
Bullish Engulfing
Bullish Harami
Other reversal signals, like a close above the high of the previous two candles.
These are the scenarios I’m watching for on $SUPERUSDT.
Let me know your thoughts!

HBAR/USDT: LONG SCALP SETUP!!🚀 Hey Traders! 👋
If this setup gets you hyped, smash that 👍 and hit Follow for trade ideas that deliver results! 💹🔥
HBAR is heating up! Breaking out of a falling wedge structure, signaling a strong bullish move ahead. 📈🔥
💡 Here’s the Setup:
📌 Entry Range: Current Market Price (CMP)
🎯 Targets:
Target 1: $0.355
Target 2: $0.386
Target 3: $0.418
🛡️ Stop Loss (SL): $0.325
⚙️ Leverage: 5x–10x (trade responsibly!)
💬 Your Thoughts?
Are you bullish on HBAR’s breakout potential? Share your analysis, predictions, or strategies in the comments! Let’s ride this wave and secure those gains together! 💰🔥

AMC Stock: Reversal in Sight? Long Opportunities Ahead!Hi fellow traders! 🚀
AMC has been tunneling down in a steady downtrend on the 1H chart, but things are looking up! Recently, AMC broke out of its range, found solid support, and respected a new bottom – a promising sign that a reversal pattern is forming.
Here’s the current technical setup:
Support Levels: $4.00
Resistance Levels: $4.30, $4.63, and $5.00
$5.00 aligns with a higher timeframe Point of Control (POC), making it a critical level to watch.
The stock has shown strength at the $4.00 support, suggesting a good base for long positions. The price action is beginning to favor the bulls, and if momentum builds, we could see AMC test higher levels in the coming sessions.
📈 Trade Idea:
Look for long entries near $4.00 with a tight stop below this level.
Target the resistance levels sequentially: $4.30, $4.63, and $5.00.
Watch for volume confirmation and further signs of bullish momentum to validate the move.
🌟 Sentiment: Positive
The technicals suggest we may finally see a shift in trend. Keep an eye on $5.00 as a significant hurdle, but the path to the upside looks promising. Let's ride this potential reversal to the moon! 🚀
What do you think? Share your thoughts in the comments! 💬
#AMC #StockTrading #Reversal #BullishTrend

Swing | Descending triangle breakout | BULLhi traders,
There is a swing in daily timeframe.
At the same time frame there is a descending triangle pattern, here this triangle breakout is a trend reversal confirmation.
Overall the trend is BULL in both Weekly and Daily timeframe.
04% - 10% rally towards the target 1 and target 2.
FNO strategy : Go for the ATM CALL option & Protective PUT.
sbull.co
sbull.co

JindalSaw - Uptrend - Long term1. Bos - uptrend
2. 50% retracement & touched support level
3. ADX - shows strength of the trend
4. Taken support at Pivot
5. Day before candle formed Hammer and previous day candle break out the day before candle and closed
6. Double Bottom at support level

BMETRICS - strong buy levelsBMETRICS - buy 139
fundamentally good
technically good upside
will to take risk go for profit

Low cap MEME coin, good price structure, price events analysis$HONK price history and some events key points for new investors.
1. On the evening of 13 April, Iran launched a drone and missile attack on Israel. Altcoins market dumped hard while $HONK recovers quickly, breaks 33 days downtrend and enters accumulation zone where people are not selling below 0.004800 - 0.004550 for around 22 days.
2. On 8 May, selling was initiated by mainly one big wallet followed by couple other bigger wallets and some panic selling from smaller wallets.
3. $HONK bottoms as it’s ~95% down from ATH, volume (USDT) drops ~3 times, trend reverses to upside and within 10 days price goes up by 300%.
4. Price bumps into major resistance point at 0.008100 where swing traders who bought earlier at the bottom are taking profits. Price falls back into accumulation range.
5. The price is pumped by one wallet (~130k USDT) and later on dumped for a loss.
6. Price is back to accumulation range, low volatility, people are not selling below 0.004550 Supply and demand are about the same.
Which direction $HONK goes?
Bullish scenario. Key things.
1. Price is currently within accumulation range for around 30 days as people are not willing to sell bellow 0.00450 which signals strength. The panic sell was caused mainly by one big wallet which was bought back quickly (positive hands change (300 new Telegram group users within 10 days)). If $HONK continues to stay within accumulation zone and considering bullish market sentiment as majority anticipates bull market to continue with full swing, eventually there should be less supply and more demand which would move price up.
2. $HONK is 5 months old and low market cap. It’s not so immature like few days to be based on extreme speculation and gambling. Yet it’s not so old to have bigger market cap and give less potential upside reward in multiples. It’s 5 months and it has decent price structure: 95% retracement from ATH, bottom reversal, nice accumulation range and as it’s low market cap it has potential of 300x once the bull market fully kicks in and money starts to flow in.
3. Telegram group is shilling on Twitter every day, new exchanges and more marketing within time.
Bearish scenario. Key things.
1. People might sell $HONK as they chase other coins pumping (careful, don’t get REKT). In such case I would expect $HONK price to slowly bleed over time and reach lower price demand/support levels like 0.003200 before bouncing back up.
2. In worse case scenario if Bitcoin experience major pullback below 55k I would potentially see $HONK slowly bleeding down to 0.001850 and forming double bottom on weekly candlestick before going up.
3. How likely for the price to go below 0.001850? Considering bullish crypto market sentiment and anticipation, new money flow in, meme coins leading the way, $HONK having maturity of 5 months, good hands change over the time, good price structure I don’t see price reaching lower bottom (maybe if whole bull market is cancelled, extremely unlikely).
Overall, I think $HONK investment offers good risk reward ratio as in a short to medium term the price might dip lower but in a long term within next 6-12 months it can go up 300x.
HLong

BTC ready for the pump??As I marked out you can see a descending channel followed by a bullish pendent that's breaking out. I've also marked out key levels that price bounces from. As of today price has reacted of the range of 67500 (Each level being marked 2500 apart). I believe we can be seeing prices reaching 82500 pretty soon! Hope everyone is having a successful trading day so far. BTC to the Moon. good luck everyone


[APTUSDT] - Massive round bottom pattern3D chart showing a massive round bottom pattern and not get out yet
price need to breakout the 0.5 fib resistance for bullish rally
our main target is 100$
Thank you, and for more ideas, hit "Like" and "Follow"!🎯

NZDCHF Bullish TradeHey Traders this is my master plan to loot NZDCHF Bank. My target is escape area. MAKE MONEY TAKE MONEY.

US100Short term bullish idea, I believe it will break previous high. Price just liquidated previous demand zones confirming potential bullish trade!

1CAT/USDTBITGET:1CATUSDT
This idea has a medium-term profit target.
All targets are indicated on the graph with a red eye.
- Risk 0.5% on deposit
- R/R 1/2
P.S (This is not an investment recommendation, this is my personal opinion.)
1Long

DXY updateDXY is going into our direction pretty nicely,
I’m still anticipating more bullish move for the next few weeks, potentially 108 target ( 2 purple lines are target)

SUZLON Heading for multibaggingI don't recommend Penny stock but this one caught our eyes given its possible potential future in energy sector. recently it has breakout of the lower lows downtrend. SUZLON seems to be good stock to invest on.
Recommended ENTRY zone 12-9.5
Stoploss 6.5
Targets 22.2 27 and ultimately 150

Cisco Cup and HandleI noticed a Cup and Handle pattern forming on Cisco Systems - ticker CSCO, on the daily level. What will be my entry points and what are the things to consider:
1. My entry would most likely occur today, 19th of July, since I think that the stock will break from smaller moving averages once the market opens. Those moving averages are 10 and 20, my entry price is sitting at around $52-52.5 price level.
2. Stop loss for this position, in case something goes wrong, will be put at around $49.95 price level, which is just below it's previous low and way below the 10 and 20 moving average line, and around 50MA.
3. My profit point is sitting around $59 price level, but that doesn't mean that I will be exiting my position there. It means that if the price action is strongly acting bearish that I will close my position. If price action is in a strong uptrend, I will surely keep the position open.
4. I am planning on adding to a position at $58 price level, of course, if the price action is going as it should - pointing to a strong bullish move.
I will make sure to update this buy opportunity, but please make sure to do your due diligence when investing.

AUDJPY LONG PROJECTION UPDATEAdjusted trendline on H4 as a bullish harami pattern formed which respected the new trendline. Sellers were pushing the market lower until price started to climb again after the formation of the bullish harami and the trendline being respected indicating that sellers are loosing power. Temporary move to the downside doesn't necessarily mean a change in direction of the momentum but we have to look if the market is either retracing or pulling back; in our case it was a pullback since the downside movement wasn't that hectic or require Fibonacci retracement.
Using a lower timeframe can make you fall victim to retracements and pullbacks thinking that the trend bias has changed whereas if you focus on higher timeframes from H4-Weekly you'll be able to see the bigger picture instead of a temporary move.
