CleanSpark (CLSK): Strong Upside Expected After CorrectionWhy this matters now:
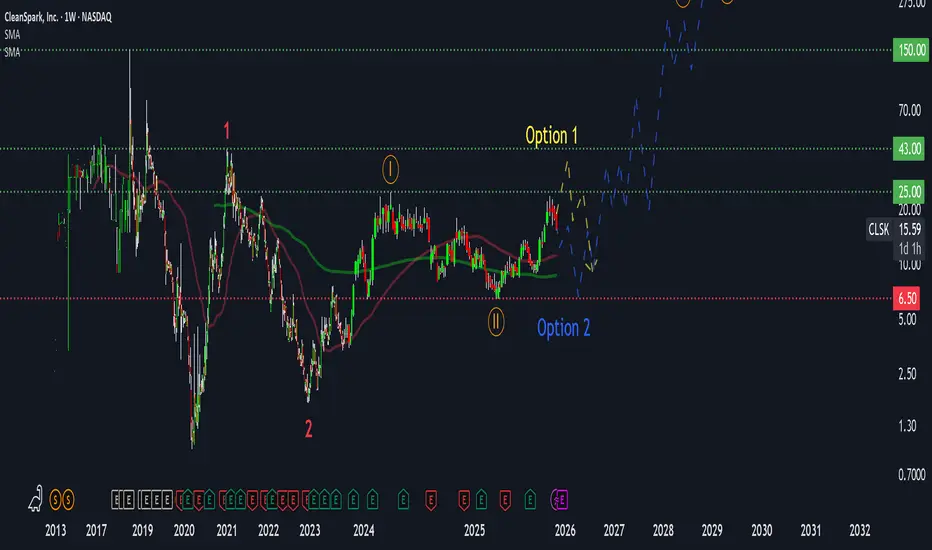
CleanSpark remains one of the strongest miners in the sector, but the current technical structure suggests a likely correction before the start of a major bullish cycle.
🔹 Main Thesis
Technically, CLSK is bullish, but a short-term correction to $8–10 is expected, after which the stock could launch a strong upward move toward $43 and beyond.
🔹 Key Arguments
Wave Structure:
Wave 1 is complete ✅, Wave 2 (correction) is underway. We are now in the final phase before the next impulse wave.
Resistance $25–43:
$25 is a key previous high. A short-term breakout with a small pullback is possible, followed by a retest and formation of the next upward wave. Targets: $43, then $150+.
Volume Cluster $8–10:
The main smart money cluster where significant positions were accumulated provides strong support. This is likely the bounce zone after the correction.
Fundamentals:
EPS growth ~50% YoY, forward P/E ~15. Cash flows are unstable.
Correlation with Bitcoin:
As a Bitcoin miner, CLSK is highly correlated with BTC. Historically, when BTC corrected 70–80%, CLSK tested lows in the $8–10 zone.
Currently, CLSK could first rise to $30–35 and then correct along with BTC by roughly 70%, aligning with the $8–10 support cluster.
Levels and Targets
Resistance: $25 - key level, possible false breakout
Support / Smart Money Cluster: $8–10 - likely bounce zone
Final Cycle Targets: $43 → $150 - breakout above $43 opens the path to $150+
🔹 Risk & Invalidation
Main Risk: strong BTC correction → CLSK tests $8–10 cluster.
Historically, four previous corrections in BTC were around 70–80%, matching the current structure.
❌ Invalidation: break and close below $6 → current wave structure would be invalidated and require reassessment.
🔹 Summary
CleanSpark is forming a strong bullish trend. After a possible correction to $8–10, a powerful upward impulse is likely, with targets at $43 and beyond. Potential from current levels: 10x+, but the path includes a consolidation phase.
🔹 Discussion
What’s your take on CLSK? Do you agree with the correction scenario, or do you see a different move?
💬 Comment below or suggest which ticker we should analyze next!
Buylong
USOIL Daily Analysis: Bullish Reversal from Key Support USOIL (WTI Crude Oil) daily chart showing price action analysis.
Key Observations:
Support Zone:
A strong demand zone is marked around $65-$66, which has acted as a reversal area in the past.
The price has recently bounced off this zone, indicating potential buyer interest.
Current Price Action:
Price is currently trading at $68.25.
A bullish move started from the support region, with a higher low formation suggesting potential upside momentum.
Potential Scenario:
The chart suggests a pullback before continuation to the upside.
If the support holds, $70-$72 could be the next target.
If price fails to hold above $66, further downside towards $64 may be possible.
Outlook:
Bullish Bias 📈 as long as the price remains above the demand zone.
Watch for a higher low confirmation before entering a long trade.
Breakout above $70 could signal a stronger rally.

Ethereum (ETH/USDT) Breakout Incoming? Eyeing $4,000 TargetEthereum (ETH/USDT) 4H Analysis: Breakout Toward $4,000?
Key Observations:
1. Potential Double Bottom Formation:
ETH appears to be forming a double bottom near the $3,000 support level, indicating a potential bullish reversal.
2. 200 EMA Resistance:
The 200 EMA ($3,324) is acting as resistance. A clear breakout above this level could confirm bullish momentum.
3. RSI Indicates Momentum Shift:
The Relative Strength Index (RSI) is at 56.85, trending upward, suggesting increasing buying pressure but not yet overbought.
4. Potential Scenarios:
Bullish Breakout: If ETH breaks and holds above $3,324, the next target could be around $4,000.
Rejection & Retest: If ETH faces rejection at $3,324, it may retest $3,000 before another attempt higher.
Conclusion:
ETH is showing bullish potential, especially if it clears $3,324 resistance.
A confirmed breakout could trigger a strong rally toward $3,800-$4,000.
Traders should watch for volume confirmation to validate the move.


btcusdtperpHello my friend
With the (risk of reward) good it has
It is worth opening a deal
I do this

AUDCAD , Main Trend is Bullish.Always Remember , Market has 3 cycles, SPIKE , CHANNEL , TR !
Try to find them on your chart, And Beware of the Main Trend.

OGI___Buy LongOGI_Cannabis stock, Trend Inversion, Stock having positive QEarnings, Inverting the Bearish trendline, now creating an ascending Bullish Channel

BNB IDEAS, ASCENDING TRIANGLE, READY TO JUMP? OR DUMP?BNB ascending triangle seen in the chart.
Try to break the resistance around 375-377.
Possibility at 390 for TP 1 and 410 for TP 2.

Algorand will come to 0.72ALGO will come to line A and if it breaks it will definitely come to line B. I don't expect it will break line B. Then run sideways until two or three weeks. if it didn't break A, it will follow path X. if it breaks line A then it will follow path y.

LitecoinLTC will drop to $ 80 next week, run sideways, and will drop to the 40 USDT price line by befoe 3rd week of February. After the 2nd 0r 3rd week of march will start a bull run. 40-45 USDT is a good price for long-term holders.

USDJPY intra day BUY TRADES Looking at jumping on some buys off that support of 113.500 and pushing back towards 114.200.

BTC/USDT Ghost Feed ScenarioThis is a ghost feed of what BTC daily candles could potentially look like as we are approaching more uncertainty of the direction in the crypto market. Please provide some thoughts on this.

BUY/USDT GOLDEN CROSS It is time for Burency to moon now . Full send. It’s forming a golden cross where the 50 MAcrosses the 200 ma. This is bullish.

BTC/USDT RETEST ALMOST COMPLETEIncoming bounce for BTC soon. The breakout reached ATH, now a retest of breakout is what we are currently witnessing. A bounce from support is likely to soon happen.

LINK is about to breakoutchain link pump is too close dont miss it
after touching the 25$ area it will pump
maybe a little bit ranges after that around 29-31 and then goes up again
its and uptrend, expect any thing else?

BTCUSDT Next Step SanerioBtcUSDT looking Bulish Butt Keep In mind Btc Will Resume IN Some Next Wil In 42K To 50K,... So Every Body Keep In Mind Stay Tuned Next Some Dayes And Wait For Best Buy Long Entry. Emportantly Hoply Every Bodey Enjoying Deep, CRYPTO WHALES THUNDER


BTCUSD support and resistance zone buy longHi guys,
here you are support zone for buy long.
3x Buy long zone - green line for this area
Resistance you can use as a zone for take profit

EURUSD buy is surging Up, just as I predicted Watch strong price action at the current levels for BUY. GOOD LUCK! Great BUY opportunity in EURUSD..

ANALYSIS ON EURUSDHello, my fellow traders, hope you all are making some profits. We are here with our new analysis so that we can increase those profits for you. Let’s get into the analysis.
As we can see, the price is close to its resistance. One can wait for confirmation
Let us know your views on this in the comment section. Thank you all.
There is good news for our followers. We will be analyzing on-demand. So, let us know which pair you want our analysis on and we will get it for you. Do like and follow us.
Ryan.R..Lopes

AUSUSD CLOSE TO RESISTANCE Hello my fellow traders, hope you all are making some profits. We are here with our new analysis so that we can increase those profits for you. Let’s get into the analysis.
As we can see, the price is close to its resistance. One can wait for confirmation.
Let us know your views on this in the comment section. Thank you all.
There is good news for our followers. We will be analyzing on-demand. So let us know which pair you want our analysis on and we will get it for you. Do like and follow us.
Ryan.R..Lopes
