Scalping ! Liquidity support around 4330.1. Market Structure — Short-Term Bearish Correction
Gold is trading around 4,346.8, after failing to sustain the move above the 4,390–4,400 resistance area.
EMA 9: ~4,350.9
EMA 89: ~4,357.0
Price is currently slightly below both EMAs.
EMA 9 is below EMA 89 → short-term momentum has shifted bearish.
Recent candles show Lower Highs, indicating sellers are gaining control.
However, the broader recovery structure remains supported as long as 4,330–4,335 holds.
The current setup looks like a tech
Buyxauusd
A three-wave upward move and a recovery to 4,500.💵 1. USD & Treasury Yields
The 10-year Treasury yield remains elevated around 4.79%, while the Dollar Index has recently eased toward 98.8. The weaker dollar provides some support for gold, but elevated yields remain a major headwind.
🌍 2. Geopolitical Risk
Renewed tensions involving Iran and the Strait of Hormuz are supporting safe-haven demand for gold. Rising oil prices are also increasing concerns about inflation, which could complicate the Fed's policy decision.
📊 3. Market Outlook
Fun
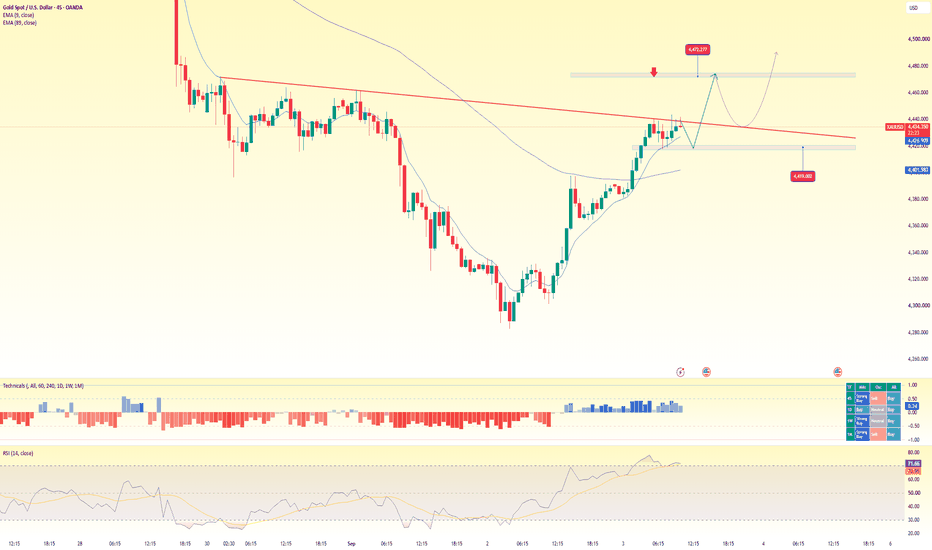
Scalping - Buying pressure maintains its recovery.Current price: ~4,428 USD
EMA 9: ~4,403
EMA 89: ~4,454
RSI(14): ~60.4
📊 Market Structure
Gold is currently in a short-term recovery after the sharp sell-off at the end of August.
Price has moved back above the EMA 9, indicating improving short-term momentum.
EMA 9 remains below EMA 89, keeping the broader H2 bias bearish.
The recovery is approaching a descending trendline, acting as dynamic resistance.
🔴 Key Resistance
4,440–4,455
This zone combines the descending trendline with the EMA
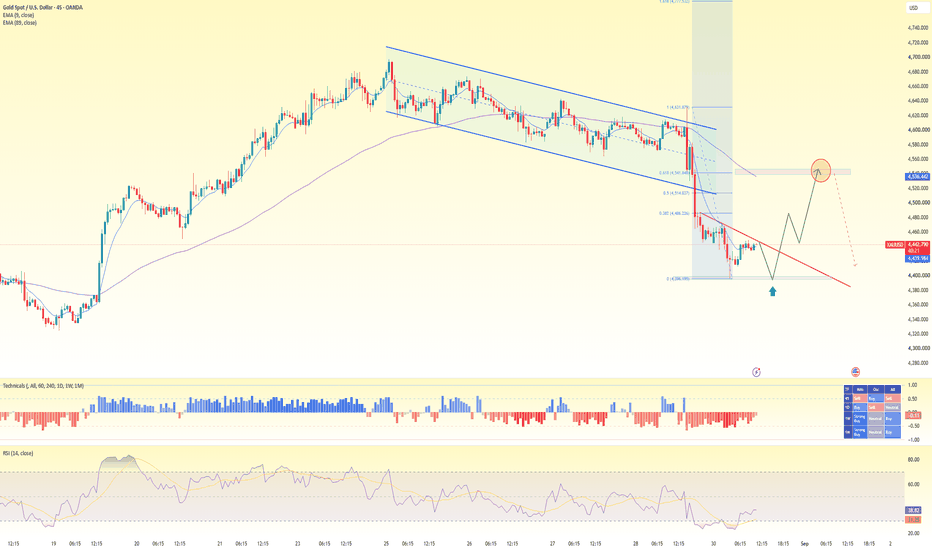
Gold price rebounds/recovers around 4540.1. Fed Policy – Bearish for Gold
Fed Chair Kevin Warsh delivered a hawkish message at Jackson Hole, emphasizing that further action may be required to bring inflation back toward the 2% target.
As a result, market expectations for a September Fed rate hike increased from around 36% to about 60%.
Higher-rate expectations → higher yields → stronger USD → negative for Gold.
This has been the main reason behind the recent 3%+ one-day decline in gold.
📈 2. U.S. Yields & Dollar
Treasury yield
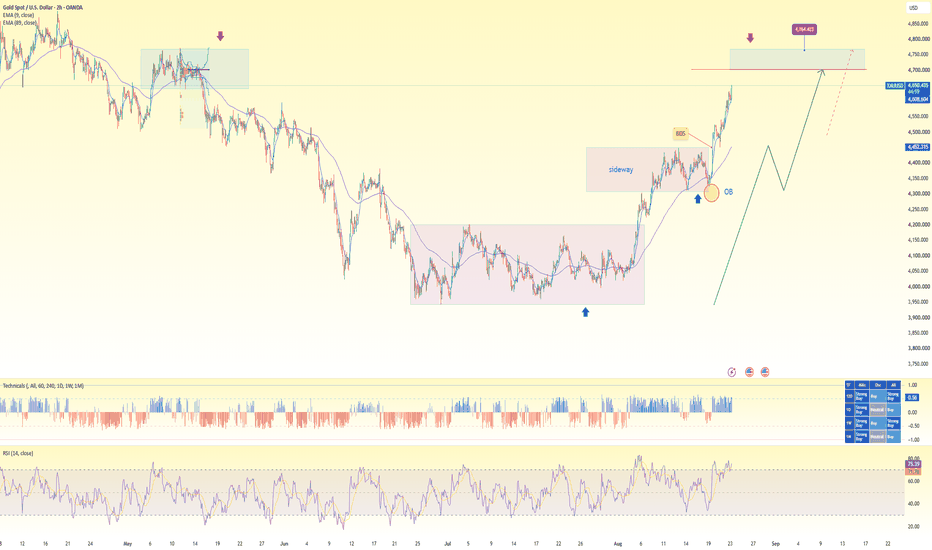
Price increase continues: 4,7001. Overall Trend
Bias: Strong Bullish – Bullish Continuation
Gold is trading around 4,643, well above EMA 9 ≈ 4,607 and EMA 89 ≈ 4,452.
EMA 9 > EMA 89, confirming a strong bullish trend on the H2 timeframe.
Price has broken decisively above the previous 4,300–4,450 sideways range, creating a clear Break of Structure (BOS).
The breakout was followed by strong upside momentum, with price now approaching the major supply zone.
Histogram remains strongly positive, confirming sustained buying pres
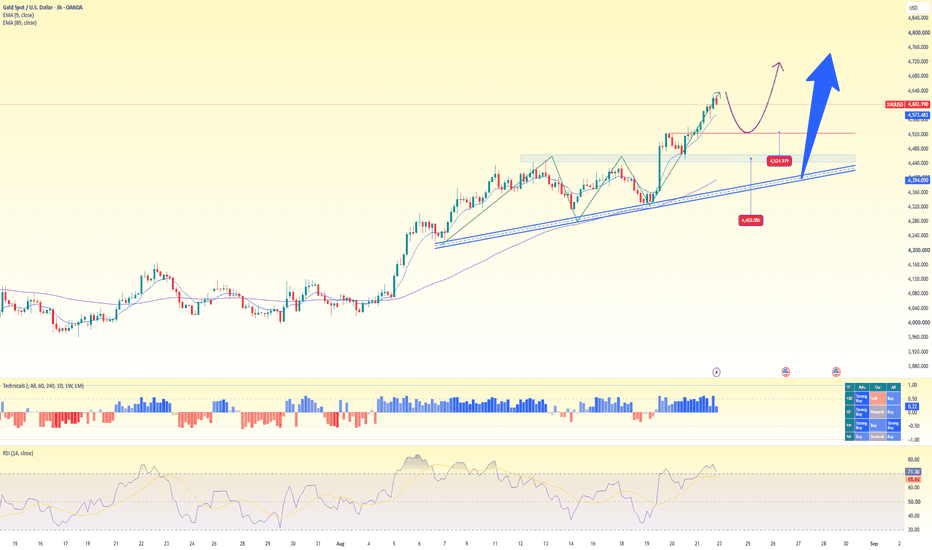
Price rally continues: gold tops 4,600.1. Main Trend
Bias: Strong Bullish – Short-term Pullback Possible
Gold is currently trading around 4,603, well above EMA 9 ≈ 4,573.5 and EMA 89 ≈ 4,394.1.
EMA 9 > EMA 89 → confirms a strong bullish trend on H3.
Price has broken out of the 4,430–4,480 accumulation range and continues to form Higher Highs – Higher Lows.
The rising trendline remains intact, acting as dynamic support.
The histogram remains positive → bullish momentum is still present.
RSI(14) ≈ 71.4 → in overbought territory, inc
maintain the upward trend above 44251. Overall Trend
Current Bias: Bullish – Short-term consolidation
Gold is trading around 4,484, following a strong breakout from the 4,320–4,400 accumulation area.
Price remains well above EMA 89 ≈ 4,418, confirming a strong bullish medium-term structure.
EMA 9 ≈ 4,489.7 is slightly above the current price, suggesting short-term momentum is cooling.
The price is consolidating below the recent high around 4,525, but the bullish structure remains intact.
RSI(14) ≈ 58.5 has declined from overbou
Scalping - Move the bullish trendline above 4390.1. Current Trend
Bias: Bullish – Uptrend with a short-term pullback
Gold is trading around 4,395, slightly below EMA 9 ≈ 4,395.7 but still above EMA 89 ≈ 4,376.1.
EMA 9 > EMA 89, confirming that the short- to medium-term trend remains bullish.
Price continues to respect the ascending trendline, which is acting as dynamic support.
The recent pullback is currently testing the 4,390–4,395 area, close to the trendline.
Histogram remains positive at around 0.31, indicating that bullish momentum is
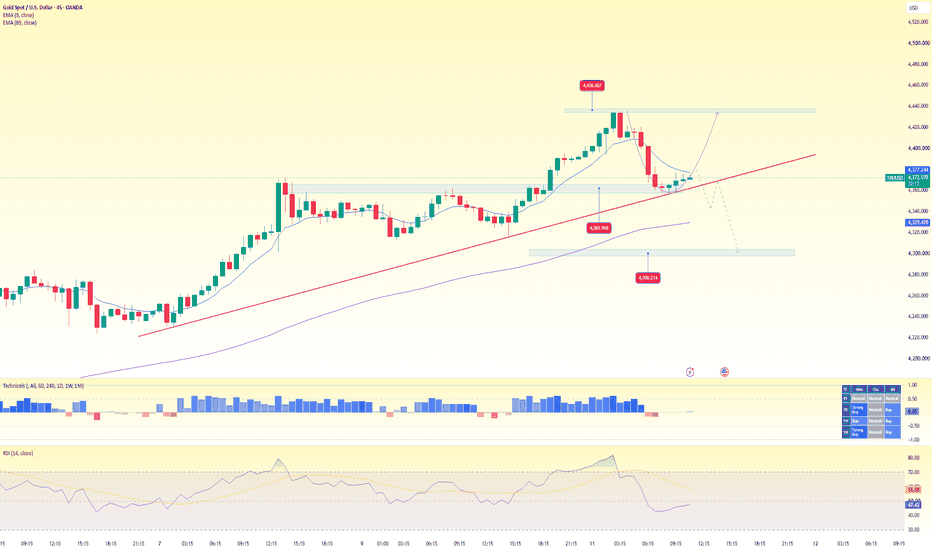
scalping - Resistance for the sellers at 4435.1. Overall Trend
Current Trend: Medium-term Bullish – Short-term Correction
Gold remains in a clear uptrend, supported by the rising trendline.
Price recently rejected the 4,435–4,440 resistance zone and corrected toward 4,360.
Current price is around 4,372, slightly below EMA 9 ≈ 4,377, but still well above EMA 89 ≈ 4,329.
EMA 9 > EMA 89, confirming that the broader H2 trend remains bullish.
The histogram has weakened toward the zero line, indicating that bullish momentum is temporarily losi
Strong upward momentum – breaking through 4400.1. Overall Trend
Current Trend: Strong Bullish – Short-term Pullback Possible
Gold has made a strong breakout from the 3,960–4,180 consolidation range and continues to maintain a clear bullish structure.
Price is currently around 4,424, trading significantly above:
EMA 9 ≈ 4,371.7
EMA 89 ≈ 4,188.5
EMA 9 remains above EMA 89, confirming a strong bullish H2 trend.
The histogram remains positive and continues to rise, indicating strong buying momentum.
However, RSI(14) ≈ 80.3 has entered the ove
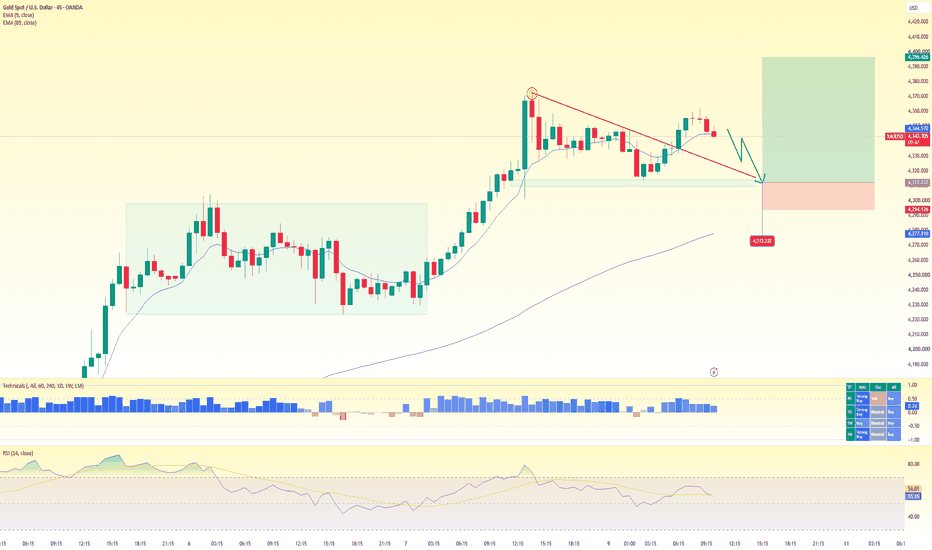
Scalping - Accumulation and price appreciation above 4315.1. Trend Overview
Current Trend: Medium-term Bullish – Short-term Correction
Gold rallied strongly from the 4,230–4,280 consolidation zone, broke out, and reached around 4,370.
Price is currently correcting around 4,343 after rejection near the highs.
Price remains above EMA 89 ≈ 4,277.9, keeping the medium-term trend bullish.
EMA 9 ≈ 4,344.6 is moving sideways near price, indicating weakening short-term momentum.
RSI(14) ≈ 55.7 remains above 50 but is declining, showing that buying pressure
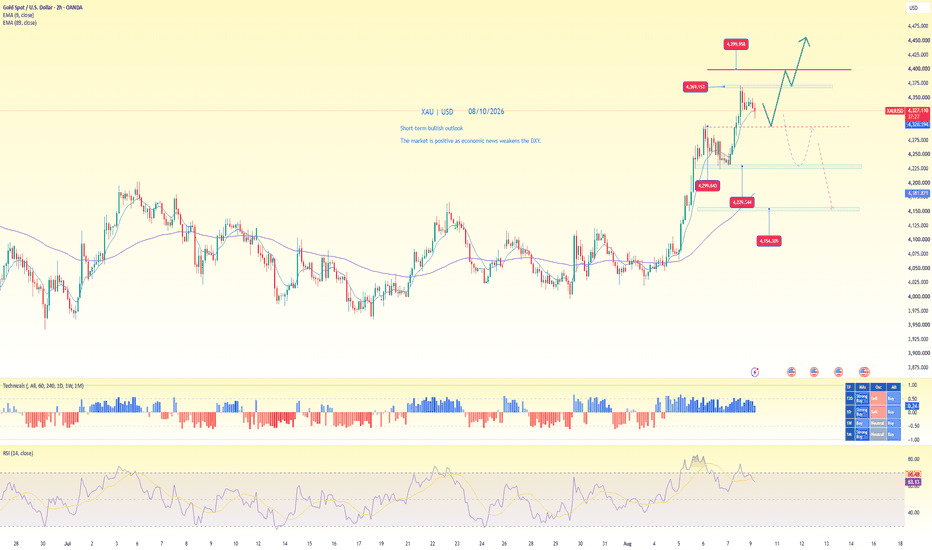
continue to maintain the upward trend above the 4300 level1. Trend Overview
Current Trend: Strong Bullish, with a Short-term Correction
Gold has made a strong breakout from the consolidation zone around 4,050–4,100, rallying rapidly toward 4,360–4,370.
After reaching a high around 4,369, price is now correcting and consolidating around 4,325, but the bullish structure remains intact.
EMA 9 ≈ 4,325.8 remains well above EMA 89 ≈ 4,181.8, confirming that the medium-term trend is still bullish.
Price remains above the EMA 89, meaning the bullish structu
break 4300 - Gold prices continue to rise.1. Trend Overview
Current Trend: Short-term Bullish
Key Signals
Gold remains in a strong short-term uptrend, consistently forming Higher Highs (HH) and Higher Lows (HL).
Price has rebounded from the 38.2% Fibonacci retracement (~4,195) after a healthy correction, showing buyers are still defending the trend.
EMA 9 (~4,278) remains well above EMA 89 (~4,193), confirming that bullish momentum is intact.
Price is trading comfortably above both moving averages, indicating buyers continue to contr
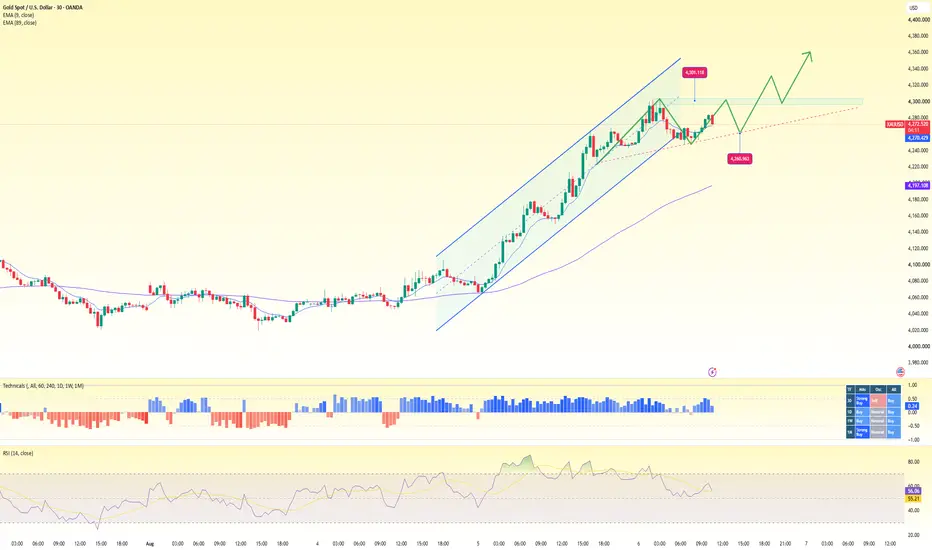
Scalping - Consolidating, awaiting a breakout above 4,300.1. Trend Overview
Current Trend: Medium-term Bullish, Short-term Consolidation
Key Signals
Gold remains inside a well-defined ascending channel, confirming that the primary trend is still bullish.
After the recent rally, price is consolidating just below the 4,300 resistance zone, indicating buyers are taking profits while maintaining control.
A small bull flag / pennant has formed near the channel highs, which is typically a continuation pattern.
EMA 9 (≈ 4,271) remains well above EMA 89 (≈
Continuing to rise – targeting 4367.1. Trend Overview
Current Trend: Strong Bullish Breakout
Key Signals:
Price has broken decisively above the symmetrical triangle, confirming the end of the previous consolidation phase.
The breakout occurred with strong bullish momentum, indicating buyers have regained full control.
Price is now trading well above both EMA 9 and EMA 89, confirming a strong bullish trend.
EMA 9 has crossed above EMA 89, reinforcing the positive momentum.
RSI (14) ≈ 83 has entered the overbought zone, reflecting
Scalping - Pullback to the 4118 price level ! buy gold.1. Trend Overview
Current Trend: Short-term Bullish
Key Signals:
Price remains well above the ascending trendline, confirming that buyers are still in control.
A strong impulsive rally pushed gold to a new swing high near 4,180, followed by a healthy pullback.
EMA 9 (≈ 4,152) remains above EMA 89 (≈ 4,085), confirming strong bullish momentum.
Price is trading comfortably above both moving averages, reinforcing the prevailing uptrend.
RSI (14) ≈ 70–72 has entered the overbought zone, reflectin
Bullish buying pressure – recovery above 4,100.1. Trend Overview
Current Trend: Short-term Bullish
Key Signals:
Price continues to trade above the ascending trendline (blue line), confirming that buyers remain in control of the short-term trend.
The recent pullback found support near the trendline before buyers pushed price back toward the descending long-term trendline.
EMA 9 (≈ 4,086) is above EMA 89 (≈ 4,065), confirming bullish short-term momentum.
Price is trading above both moving averages, reinforcing the positive outlook.
RSI (14)
Scalping - Gold prices remain stable above 4020.1. Trend Overview
Current Trend: Short-term Bearish
Key Signals:
Price failed to break above the descending trendline, indicating that sellers continue to defend the major resistance.
After testing the trendline near 4,070–4,075, price was rejected and has fallen back below the short-term ascending trendline, suggesting weakening bullish momentum.
EMA 9 (≈ 4,056) remains slightly below EMA 89 (≈ 4,057), confirming that the short-term trend is still bearish.
RSI (14) ≈ 46 has dropped below the
Stable accumulation - gold price above 40301. Trend Overview
Current Trend: Bullish Consolidation within a short-term uptrend
Key Signals:
Price has broken above the previous descending trendline (blue line), confirming that the short-term bearish trend has ended.
EMA 9 (4,056) is trading around EMA 89 (4,062) during the retest phase. The gap between the two moving averages is narrowing, and a bullish crossover would further strengthen the uptrend.
Price is consolidating around the EMA 89 after pulling back from the 4,118 high, indica
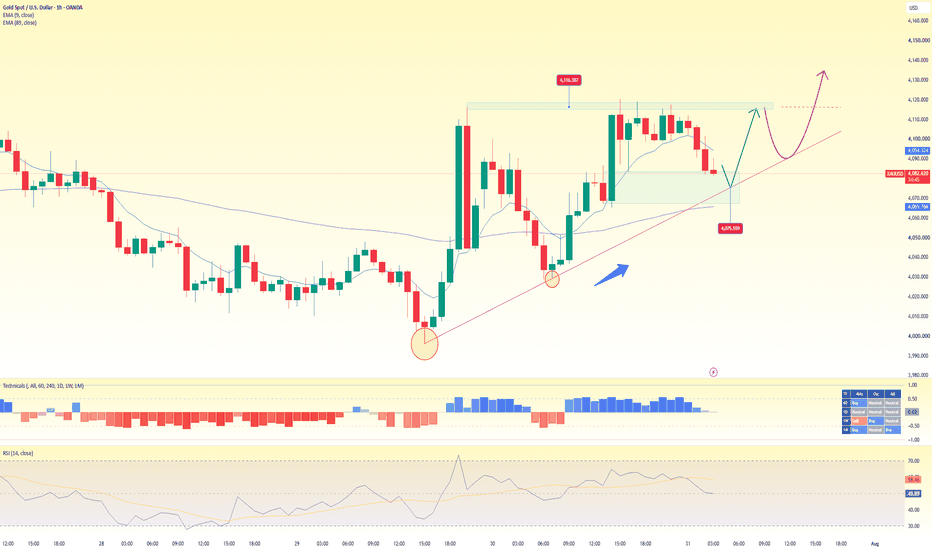
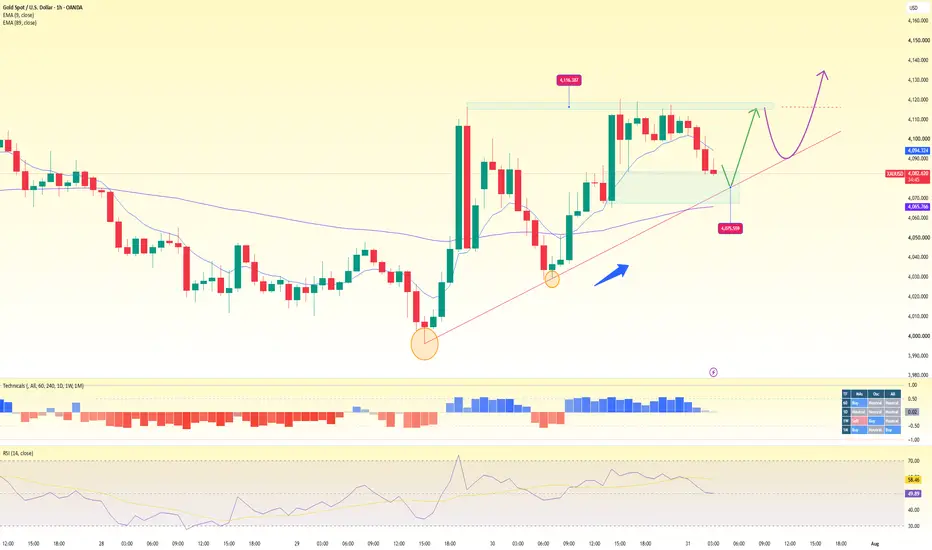
Follow trendline - gold recovers above 41001. Trend Overview
Current Trend: Short-term Bullish with a Technical Pullback
Key Signals:
Price remains above the ascending trendline (red line), indicating that the Higher Low structure is still intact.
EMA 9 (around 4,094) remains above EMA 89 (around 4,066), confirming that the short-term bullish trend is still valid.
After several failed attempts to break above the 4,110–4,116 resistance zone, price is pulling back toward the dynamic support provided by EMA 9 and the ascending trendline
Scalping - Buy gold at 4040, accumulate.1. Trend Overview
Current Trend: Short-term Bullish Recovery within a Medium-term Range
Key Signals:
Price has rebounded strongly from the 4,030–4,040 support zone, forming a series of higher lows on the intraday chart.
EMA 9 (≈ 4,058) has crossed above EMA 89 (≈ 4,051), indicating improving short-term bullish momentum.
Price has broken above the short-term descending trendline (red line), suggesting the recent bearish pressure is weakening.
RSI (14) ≈ 55 is trading above the neutral 50 leve
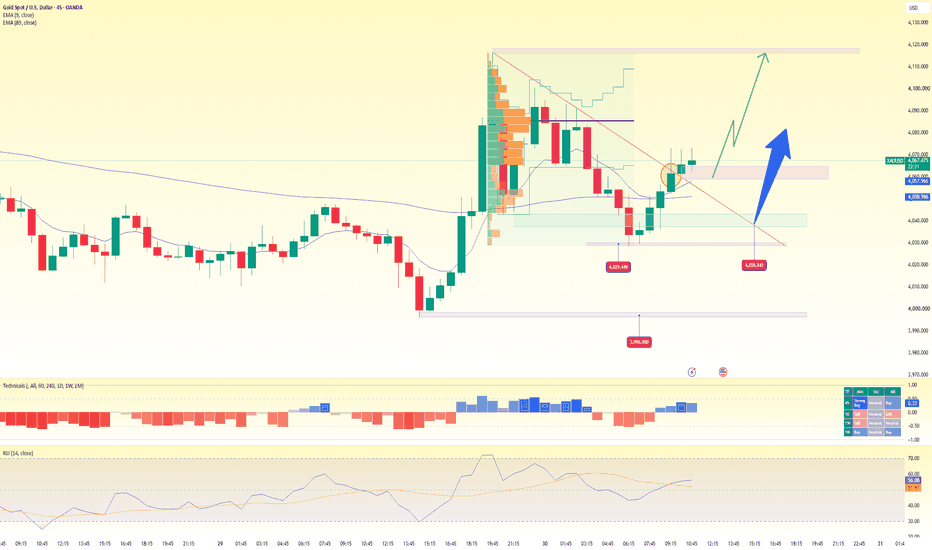
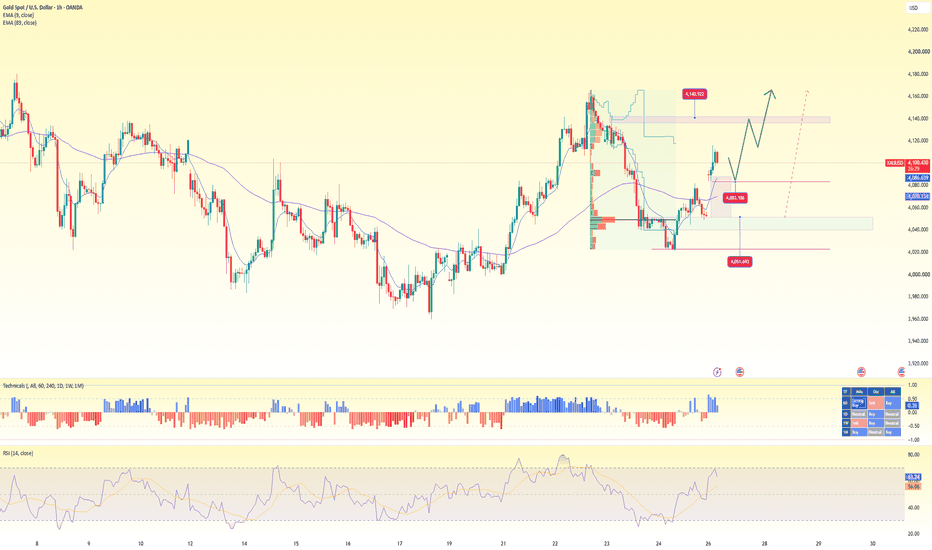
Middle East cools down - gold recovers above 41001. Trend Overview
Current Trend: Short-term Bullish
Key Signals:
Price has rebounded strongly from the 4,050–4,055 support zone, forming a short-term bottom.
EMA 9 (4,087) remains above EMA 89 (4,070), confirming strong short-term bullish momentum.
Following the recent pullback, price has moved back above both the EMA 9 and EMA 89.
RSI (14) has recovered to around 65, indicating improving buying momentum while still remaining below the overbought zone.
👉 Conclusion: Buyers have regained shor
Buying pressure recovers - maintaining upward price movement.1. Trend Overview
Current trend: Medium-term Bullish
Key signals:
Price has formed a series of Higher Lows since July 17.
The ascending trendline (pink line) is supporting the entire current bullish move.
EMA 9 = 4,127 remains above EMA 89 = 4,077, confirming that the bullish structure is still intact.
Bullish momentum has started to slow after price reached the upper supply zone.
👉 Conclusion: The primary trend remains bullish, but the market is entering a technical pullback phase before po
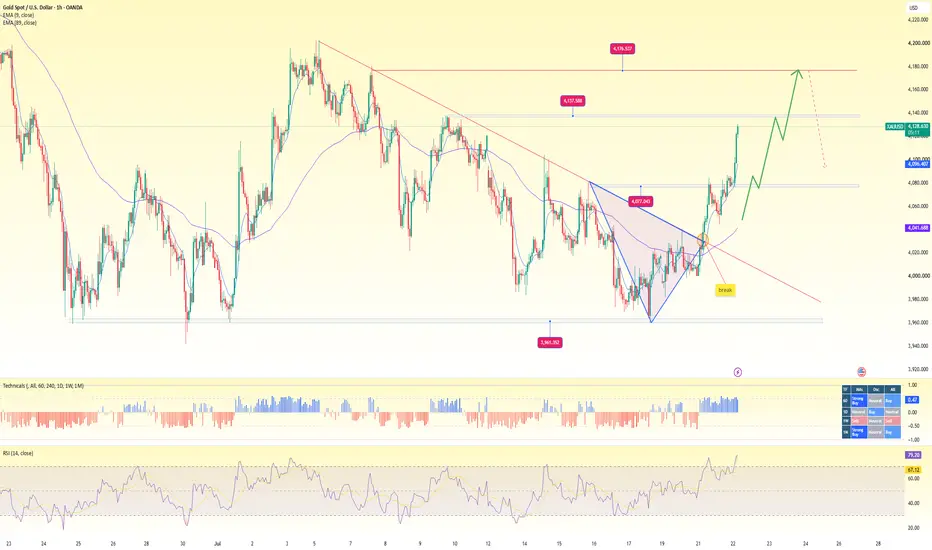
Breaking the trendline - gold recovers above 41001. Trend Overview
Short-term trend: Strongly Bullish
Key signals:
Price has broken above the descending trendline that had been in place since the beginning of the month.
It has also broken out of a descending triangle / falling wedge pattern (the circled area on the chart).
EMA 9 = 4,096 is positioned above EMA 89 = 4,041, confirming bullish momentum.
RSI (14) = 79, indicating that the market is very strong but has also entered the overbought zone.
👉 Conclusion: Buyers are currently in cont