Candlestick Analysis

USD/JPY: True Bullish Reversal?!The 📈USDJPY pair formed a well-defined inverted head and shoulders pattern following a test of a significant historical support level.
A decisive bullish breakout above its neckline, confirmed by a strong bullish candle, would provide a reliable indication.
I anticipate a correctional movement to at least 155.20.

FreseniusGood monthly setup for Fresenius. Broke up descending channel, then confirmed. Now we have beautiful monthly candle giving probabilities for an upside move (hopefully above 34.60). The 3 years distance from MA shows almost the same (broke up, retest, now moving).
Very clear Fibonacci resistances around 41-44. It seems to me a good defensive play for long term. It pays nice dividend as well.
Always do your own research!

NZD/CAD: Trend-Following SignalThe NZDCAD appears to be showing bullish tendencies following a retest of a significant daily horizontal support level.
It seems the current intraday correction is over.
Further confirmation is provided by a bullish breakout of the resistance line of a bullish flag pattern observed on the hourly timeframe.
The target is set at 0.8221.

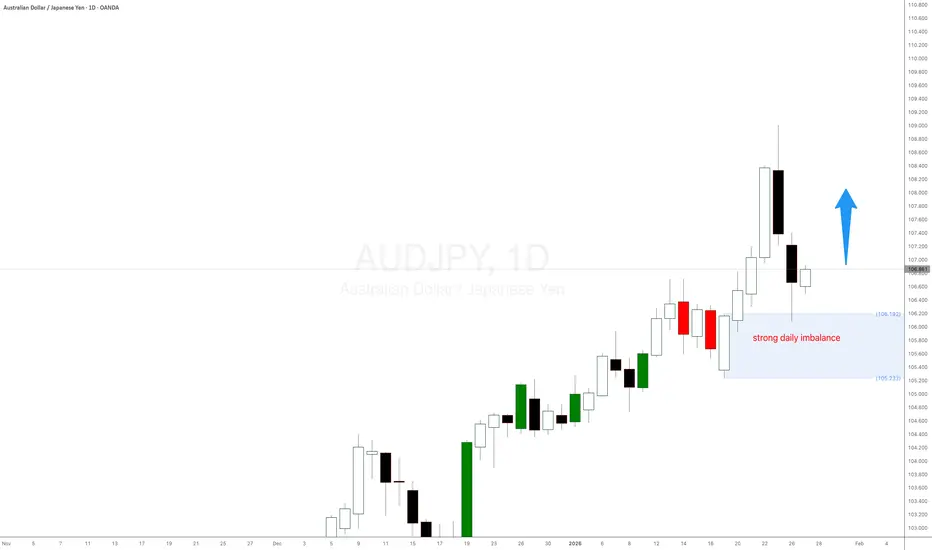
AUDJPY forex pair strong daily imbalanceAUDJPY forex pair strong daily imbalance took control and is trying to push the australiann dollar to higher grounds. The Japanese Yen is very weak accross the board. Let's see if this imbalance wants to play out.
USDHKD Forex long term demand level is playing outUSDHKD Forex long term demand level is playing out. This strong imbalance was mentioned several times in my previous update and it 's playing out well, as expected. There is still a lot of margin for profit. Long positions should be managed.

NZDJPY: Bullish Outlook Explained 🇳🇿🇯🇵
NZDJPY is going to rise more after a confirmed bullish change of character
on an hourly time frame.
I expect a bullish movement at least to 92.485 level.
❤️Please, support my work with like, thank you!❤️
I am part of Trade Nation's Influencer program and receive a monthly fee for using their TradingView charts in my analysis.

BITCOINI believe Bitcoin is brewing up a couple of big moves for this year. However, I also think that it's going to trick a lot of people before the true move takes place.
I analyze four "main charts" for directional bias, and I use the others as fillers. Currently, I'm getting half & half with my bias, where two is telling me bear and the other two is leaning towards bull. The two smallest TFs is bear at the moment, and I'm viewing that as a precursor for what's to come in the future.
In my opinion, Bitcoin's price must bleed before the next bull run takes place. Price action is near not only the daily low, but it's hovering over the current weekly & monthly low, too! I would like to see the bulls takeover on the daily and weekly TFs in order for price to rally to the highs, but only for it to run into huge bear barriers.
Bear Barriers:
1. Monthly IMB (untouched)
2. 3M wick (untouched)
3. Bear range ($130K - $160K)
4. S/R ($122,100K)
If the bears do come into the market around the $130K - $160K range, I'm anticipating a massive drop in price around $40K - $60K. Sounds crazy right?! I have my reasons why, but I'll keep it close to the chest until things starts to unfold with this crypto.
In conclusion, I'm currently stuck in the middle with my bias until the two smallest TFs flip back to bull, but price can throw a curve ball and demolish the monthly low to turn it bear... we shall see how this plays out, and I'll share my thoughts as it progress.

Gold long term targetsAs I personally think we will see gold hitting 5600$!
Based on what?
Well this is why I think what I think !
My first target hit long ago(as you can see in the image) and I sold all my Long term position already...Sadly.
I honestly thought price would have retraced a bit but instead it didn't even stop.
This strongly convince me , now that we have created a monthly FVG above 0.75 DRT level, that price will retrace in it and that will give me an advantage to open a light swing trade to last target 5600$.
Check it out and see if you like the idea.

Long trade
Trade Details
Entry: 25,651.00
Take Profit: 25,827.50 (0.68%)
Stop Loss: 25,623.50 (0.10%)
Risk–Reward: 6.42R
🟢 Directional Bias
Buy-side continuation:
The market shows acceptance back above intraday value following a sell-side liquidity purge, indicating bullish order-flow control.
🧠 Market Sentiment Overview
Early session weakness engineered sell-side liquidity
Sharp rejection from the lows confirms sell-side absorption
Subsequent impulsive moves higher signal institutional accumulation
This is a re-accumulation after a stop-run.
🧩 Structural Context
Sell-side liquidity swept below the Asian range
Immediate displacement higher created a bullish BOS
Price transitioned from discount → equilibrium → premium
Structure supports continuation higher, not mean reversion lower.
📊 Volume Profile & Value
Reclaim of intraday POC / value low
Acceptance above the value confirms a bullish auction
Volume shifts higher → value following price.
🟦 PD Arrays / Fair Value Gaps
Entry aligned with a bullish FVG inside discount
Clean mitigation followed by continuation
No inefficient gaps left below → downside fuel reduced.
⏱️ Session Behaviour
London AM delivered the liquidity sweep + reversal
Follow through into NY, the overlap is likely.
classic London manipulation → NY expansion profile.
🎯 Trade Logic
Sell-side liquidity cleared early
Market reclaimed value with displacement
Buyers defended pullbacks aggressively
Buyside liquidity resting above prior highs.
⚠️ Invalidation Criteria
Failure to hold above the reclaimed value
Bearish displacement back into discount
Until then, buy-side bias remains intact.
🧾 TradingView-Ready Summary
MNQH shows buy-side continuation following a sell-side liquidity sweep and strong bullish displacement. Acceptance above value and clean FVG mitigation support further upside expansion.

NZDCHF LONGShort term uptrend.
Price has pulled back to a level of interest.
There are signs that price would go up to test the previous swing high.

Short trade
Trade Details
Entry: 0.86920
Take Profit: 0.86568 (0.40%)
Stop Loss: 0.86988 (0.078%)
Risk–Reward: 5.18R
🔴 Directional Bias
Sell-side continuation: Price action confirms a bearish intraday narrative, with downside liquidity acting as the dominant draw.
🧠 Market Sentiment Overview
Bullish attempts were absorbed, not accepted
Buyers failed to hold above fair value → transition back into discount
Market sentiment shifted from responsive buying → aggressive selling
This is a distribution into weakness, not a healthy pullback.
🟦 Fair Value / PD Array Confluence
Entry aligned with fair value/equilibrium zone
Rejection from ~0.50–0.75 range confirms premium sell
Clean displacement away from value supports continuation.
⏱️ Session Behaviour
Sell-side expansion aligns with thin liquidity conditions. No impulsive reclaim back into range
We assume this indicates smart-money distribution and not stop-run noise.
🧩Structural Context
Prior range high sweep (buyside liquidity) failed
Subsequent lower high formed beneath key intraday resistance
Breaking back below the fair value confirmed bearish order-flow control.
🎯 Trade Logic
Liquidity run completed on the upside. The market failed to sustain acceptance above the resistance. Sellers stepped in aggressively at value. Downside liquidity remains unswept → natural price magnet.
⚠️Invalidation Criteria
Sustained acceptance back above the value / POC
Strong bullish displacement reclaiming prior highs
Until then, sell-side bias remains valid.
🧾 Summary
EURGBP shows clear sell-side sentiment following a failed buyside sweep and rejection from value. Acceptance below POC confirms bearish order flow, with downside liquidity acting as the primary driver.

Long trade
15min TF overview
Pair: XRP
Bias: Buy-Side
Date: Sun 18th Jan 2026
Time: 7:00 PM
Session: NY Session pm
Execution TF: 15-Minute
Model: Liquidity Mitigation → Expansion
🟥 EXECUTION & RISK
Entry: 1.8551
Stop Loss: 1.8417 (tight invalidation below demand)
Take Profit: 2.4148 (premium liquidity objective)
Risk–Reward: 41.77R
Sentiment & Market Narrative — Buy-Side Bias
Market sentiment at the time of entry was decisively bullish, with XRP transitioning from a distribution phase into an expansion phase following a prolonged consolidation period.
Price had already completed a higher-timeframe markdown and re-accumulation, evident through compression, declining volatility, and repeated defence of discounted price levels. Sell-side liquidity had been sufficiently mitigated, reducing the downside incentive and shifting the market’s draw toward buy-side objectives that rested above prior highs.
From a session perspective:
Tokyo and London sessions maintained a tight range, absorbing residual sell pressure.
New York PM acted as the expansion catalyst, breaking internal structure and confirming bullish intent.
The entry occurred in a discounted region, aligned with a balanced price range and internal inefficiencies, providing optimal asymmetric conditions. The shallow stop placement reflects strong underlying demand, while the projected upside targets premium liquidity pools and higher-timeframe inefficiencies.
Broader sentiment supported risk-on continuation, with price behaviour suggesting smart-money positioning ahead of a larger impulsive move rather than reactive short-covering.

ES (S&P 500 E-mini) – January 26 Day Session OutlookES (S&P 500 E-mini) – January 26 Day Session Outlook
Timeframe: 15m
Current Price Area: ~6946
Market Context
ES is trading inside a balanced range after a sharp downside liquidation and recovery. Price is currently rotating around high-volume acceptance near 6945–6950, with clear resistance stacked above 6958–6965 and responsive buyers previously defending 6925–6932.
This is a range-to-range auction day unless we see strong initiative volume outside value.
🔹 Key Levels
Resistance / Supply: 6958 – 6965
Acceptance / Pivot: 6945 – 6950 (POC-like behavior)
Support / Demand: 6930 – 6925
Range Low (failure area): 6915 – 6908
📊 Trade Plan – Day Session
9:30 AM – 12:00 PM (Opening Rotation)
Primary Expectation: Responsive trade off extremes, rotation through value.
Trade Idea 1 – Short from Upper Range
Entry: 6958 – 6965
Target: 6946 → 6935
Stop Loss: 6972
Logic: Prior rejection + heavy volume node → sellers defend value high
Alternate Long (Only if Acceptance Holds)
Entry: 6930 – 6935
Target: 6948 → 6955
Stop Loss: 6922
Logic: Buyers defend prior demand and rotate back to POC
12:00 PM – 4:00 PM (Afternoon Continuation / Fade)
Primary Expectation: Either continuation to range extremes or late-day fade.
Trade Idea 2 – Afternoon Long (If Hold Above Value)
Entry: 6940 – 6946
Target: 6958 → 6968
Stop Loss: 6932
Logic: Holding above value = bullish acceptance into close
Failure Scenario – Breakdown Short
Entry: Acceptance below 6928
Target: 6915 → 6905
Stop Loss: 6940
Logic: Loss of demand → liquidation toward prior lows
This is not financial advice. For educational purposes only.

AUDJPY: Your Plan to Buy 🇦🇺🇯🇵
AUDJPY is consolidating on a key daily horizontal support.
To buy with confirmation, wait for a bullish breakout of the underlined intraday
horizontal resistance.
An hourly candle close above 106.86 will confirm a violation.
A bullish movement will be expected to 107.36 level then.
❤️Please, support my work with like, thank you!❤️
I am part of Trade Nation's Influencer program and receive a monthly fee for using their TradingView charts in my analysis.

USOIL ShortPrice reached back into a previously liquidated key area, and we are targeting this year's minor support

Long trade Buy-side trade
NY Session AM
Pair MGC1!
Observation
Fri 22nd Jan 26
10.00 am
Entry 4947.3
Profit level 5000.0 (1.06%)
Stop level 4938.2 (0.18%)
RR 5.79
Micro Gold (MGC) — Sentiment & Narrative Analysis
Market Sentiment: Strong Buy-Side Continuation
Price action reflects a well-structured buy-side expansion, following a clear sell-side mitigation phase earlier in the session. Prior downside liquidity was efficiently absorbed, evidenced by the double-bottom formation and subsequent impulsive displacement higher, confirming a shift in order-flow control.
The market transitioned into higher highs and higher lows, with multiple bullish Fair Value Gaps (FVGs) left unfilled beneath price — a classic signature of institutional urgency and directional intent, rather than mean reversion.
During the London to New York handover, price consolidated near the highs instead of retracing deeply, indicating acceptance above value. This behaviour supports the narrative that pullbacks are being used for reloading buy-side positions, not distribution.
The clean trend channel and respect of internal structure suggest the move is being driven by programmatic buying, targeting resting buy-side liquidity above the prior session highs. There is little technical incentive for the price to rebalance lower unless a key internal structure fails.
Invalidation
Acceptance back below 4,938.2
Breakdown of internal bullish structure/trend channel

US 100 Index – Navigating the Fed and Mega Tech EarningsIn a week packed with volatility for financial markets as traders rode the headline rollercoaster led mainly by President Trump’s ever-changing approach to foreign policy, trade issues with European allies, and fresh challenges to Federal Reserve independence, the US 100 outperformed many other global indices. Investors decided to rotate back into technology stocks on the dip, taking advantage of the gap open on Monday 19th January at 25289 and then the drop to a low of 24881 on Wednesday (21st), before eventually pushing the index higher to a close on Friday at 25546, which was a weekly gain of 1%.
Much of the positivity was driven by, yes you guessed it, AI and in particular NVIDIA, who as a company not only had a strong showing at the World Economic Forum in Davos, Switzerland but also benefitted from news that suggested Chinese authorities may have signalled domestic firms to prepare for the arrival of NVIDIA’s H200 chip. This alongside reports that Alibaba was ready to set a date for the listing of its own chip making business and things really came together nicely.
Now, looking forward, sentiment and volatility toward the US 100 could be dictated by the Federal Reserve interest rate decision on Wednesday (1900 GMT) and the accompanying press conference (starts 1930 GMT). While no change to rates is expected, traders may be interested to monitor if policymakers continue to see the potential for at least 1 rate cut in 2026. The press conference could also be important, with the comments of Chairman Powell being analysed closely for any change to a more hawkish outlook.
Once the Fed has finished, the focus could shift to earnings updates from Tesla, Microsoft and Meta on Wednesday, then Apple on Thursday. Traders may be looking to compare actual results against expectations but could also be looking to see if the size of AI expenditure is starting to generate revenue results. Updates from Tesla’s board on their plans to halt the recent sales slide and any news from Apple on Siri enhancements and iPhone sales could also be important.
With so much to consider it looks like it could be another busy week for US 100 traders. Checking out the potentially relevant chart levels and trends could be helpful for preparation, planning and execution.
Technical Update: Choppy Sideways Activity Highlights Trader Indecision
The US 100 continues to reflect trader indecision, with neither buyers nor sellers able to take control. This stalemate has produced choppy, sideways price action as the market works through a broader decision making phase.
As the chart above shows, the range is defined by the recent extremes: resistance at 25832/25876 from the December 8th and January 13th highs, and support at 24644/24881 from the December 17th and January 21st lows. There’s no reliable way to anticipate when this sideways phase will resolve, so a closing break above resistance or below support may be needed to signal where the next directional risks may lie.
This implies the sideways range may persist for an extended period until a decisive closing breakout occurs. As a result, identifying the key support and resistance levels can be useful for gauging when a breakout may be developing and for mapping potential price paths once a closing break is finally achieved.
Potential Resistance Levels:
The latest failure high at 25876 from January 13th now stands as the first key resistance to monitor. While prices remain below this level, the sideways range can persist. A closing break above 25876, however, could suggest a possible shift and open the door to a fresh phase of price strength.
If upside momentum begins to build, a close above 25876 could turn attention toward the next resistance at 26277, which is the October 30th high, with scope extending toward 27211, the 38.2% Fibonacci extension, should that level also give way.
Potential Support Levels:
The most recent low in the sideways range is 24881 from January 21st, marking the point where buyers last stepped in. This level serves as key support within the range, and while prices hold above 24881, that support can be considered intact.
However, a closing break below 24881 could signal increasing downside pressure, turning focus to the next potential support at 24644, which is the December 17th low. A further close below 24644 could lead to further downside momentum, opening the risk of a deeper decline toward 23834, the November 21st low.
The material provided here has not been prepared accordance with legal requirements designed to promote the independence of investment research and as such is considered to be a marketing communication. Whilst it is not subject to any prohibition on dealing ahead of the dissemination of investment research, we will not seek to take any advantage before providing it to our clients.
Pepperstone doesn’t represent that the material provided here is accurate, current or complete, and therefore shouldn’t be relied upon as such. The information, whether from a third party or not, isn’t to be considered as a recommendation; or an offer to buy or sell; or the solicitation of an offer to buy or sell any security, financial product or instrument; or to participate in any particular trading strategy. It does not take into account readers’ financial situation or investment objectives. We advise any readers of this content to seek their own advice. Without the approval of Pepperstone, reproduction or redistribution of this information isn’t permitted.

US CRUDE OIL(WTI): Confirmed Break of StructureUSOIL closed the last trading week with a strong bullish sentiment, successfully breaking above an intraday horizontal resistance level.
It is highly probable that the market will soon approach the psychological threshold of 62.00.

GBPUSD – Acceptance Above 1.3500 Psychological LiquidityPrice accepted above the 1.3500 psychological liquidity pool and expanded higher from demand.
This post documents the continuation following acceptance.

AUDCAD: Gap Will Be Filled?! 🇦🇺🇨🇦
I think that AUDCAD will likely fill a gap up opening.
The formation of a bearish imbalance candle provides
a reliable confirmation.
Goal will be 0.9454
❤️Please, support my work with like, thank you!❤️
I am part of Trade Nation's Influencer program and receive a monthly fee for using their TradingView charts in my analysis.

S&P500 E-mini(ES) Intraday Volume Playbook (1/25-1/26)ES (S&P 500 E-mini Futures) — January 25–26 Overnight & Day Session Outlook
Current Price: ~6,928–6,930
Market context:
Price sold aggressively into the prior session, flushed into lower value, and is now auctioning back into a prior high-volume node around 6,925–6,935. This area is acting as short-term balance, not acceptance yet. Volume profile shows unfinished business above and thin structure below, making this a location-based market rather than trend-based for now.
Key takeaway:
Expect rotation first, then expansion. Direction will be decided by acceptance above or rejection below the current HVN.
Key Levels
Resistance / Upper Acceptance
6,955–6,965 (Prior VAH / Supply)
6,945–6,950 (Intraday balance high)
Current Balance / Decision Zone
6,925–6,935 (High Volume Node / POC area)
Support / Lower Acceptance
6,900–6,905 (Prior reaction & demand)
6,875–6,885 (Single prints / thin volume)
6,850–6,860 (Session extreme support)
Overnight Session Trades
Trade 1 — Now → 12:00 AM (Early Overnight Rotation)
Bias: Mean reversion / rotation
Price is sitting inside HVN — expect chop unless we see acceptance.
Long Scenario
Entry: 6,920–6,925
Target: 6,945
Extended Target: 6,955
Stop Loss: 6,905
Short Scenario
Entry: 6,950–6,955 (rejection)
Target: 6,930
Extended Target: 6,915
Stop Loss: 6,965
Expect slow, overlapping candles — this is not trend time yet.
Trade 2 — 12:00 AM → 9:00 AM (Asia → London → Pre-US)
This is where real structure develops.
Bullish Acceptance Scenario
If price accepts above 6,945 with volume:
Entry: 6,945–6,950 (pullback)
Target: 6,975
Extended Target: 7,000
Stop Loss: 6,930
Bearish Rejection Scenario
If price fails at 6,945–6,955:
Entry: 6,940–6,950 rejection
Target: 6,905
Extended Target: 6,880
Stop Loss: 6,965
Watch for range expansion after London open — that’s the trigger.
Day Session (RTH) — January 26
Primary Expectation
One-timeframe buyers only if price holds above 6,945
Failure there opens a full rotation lower
Day Session Long (Acceptance Play)
Conditions
Acceptance above 6,945
Pullbacks holding above value
Entry: 6,950–6,955
Target 1: 6,980
Target 2: 7,010
Stop Loss: 6,930
This is a trend continuation day if this holds.
Day Session Short (Failed Auction / Rejection)
Conditions
Rejection wicks + lack of volume above 6,950
Return below 6,930
Entry: 6,930–6,935
Target 1: 6,900
Target 2: 6,870
Stop Loss: 6,955
This becomes a range-to-range liquidation move.
Final Read
Above 6,945: Buyers regain control → continuation toward 7,000
Below 6,925: Failed auction → rotation into lower value
Inside 6,925–6,945: Chop & patience required
This is a location-based market, not a chase market. Let price come to your levels.

Cooked ContractsThis is more so a note to self. This ticker has potential however, contracts are cooked.
It's a monthly contract type (not experienced playing those).
cost of contracts start at 9.0 (900.00) for the 270 range.
