Short trade Pair AUDJYP
Sell-side trade
Wed 21st Jan 26
NY Session PM
3.00 pm
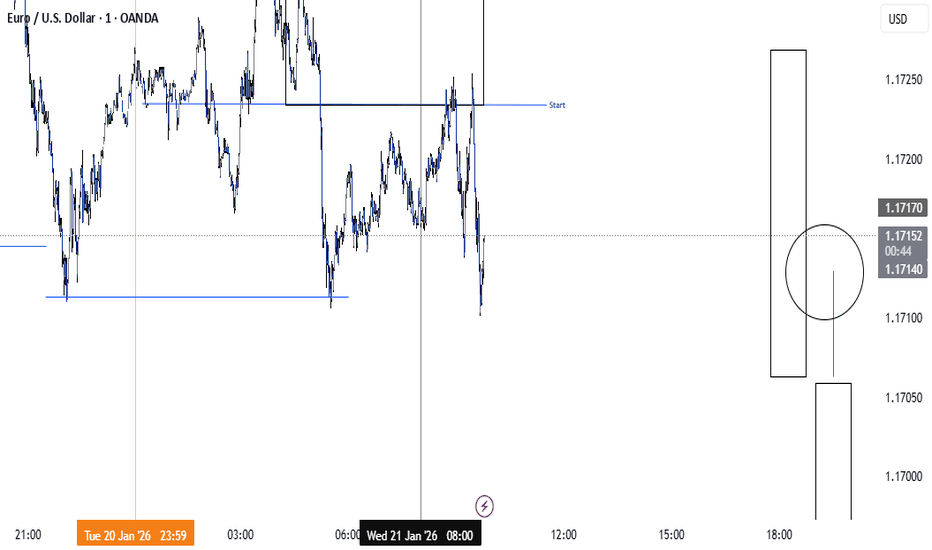
Entry 107.081
Profit level 106.574 (0.47%)
Stop level 107.147 (0.062%)
RR 7.68
Higher-Timeframe Sentiment
Macro Bias: Late-stage Buy-side → Distribution Risk at HTF Supply
Execution Bias (for this trade): Sell-side justified at a premium.
4Hr TF
4H Market Structure Narrative
Primary trend: Clear bullish expansion from the April lows, with sustained higher highs / higher lows. Current location: Price has now returned to a major 4H resistance / prior distribution high (equal highs/range high).
Bearish / Caution Case (Distribution Scenario)
Warning signs if price fails to hold 107.00:
A displacement back below 107.00 increases the odds of a deeper pullback into the London range.
Market Narrative
Asia → London: Clean accumulation and higher-low structure. Liquidity was engineered during Tokyo, then London delivered displacement, breaking prior range highs.
London → NY: Buy-side liquidity above London highs was raided during the NY open. Price expanded aggressively, printing a session high of ~107.20.
Post-raid behaviour: Momentum stalled near the highs with inefficiency (FVGs) left below, suggesting either a continuation after mitigation or distribution before a pullback.
5min TF
Candlestick Analysis
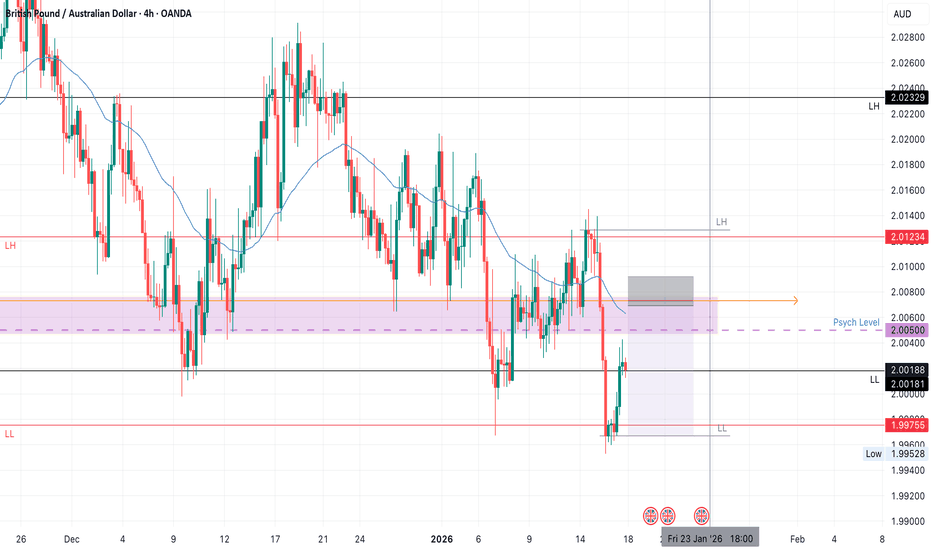
GBPAUD SHORTMarket structure bearish on HTFs 3
Entry at both Weekly and Daily AOi
Weekly Rejection at AOi
Weekly Previous Structure Rejection
Daily Rejection At AOi
Previous Daily Structure Point
Daily EMA retest
Around Psychological Level 2.00500
Touching EMA H4
H4 Candlestick rejection
Rejection from Previous structure
TP: WHO KNOWS!
Entry 125%
REMEMBER : Trading is a Game Of Probability
: Manage Your Risk
: Be Patient
: Every Moment Is Unique
: Rinse, Wash, Repeat!
: Christ is King.
Nifty Analysis EOD – January 20, 2026 – Tuesday🟢 Nifty Analysis EOD – January 20, 2026 – Tuesday 🔴
25K Revival: Nifty’s Epic 380-Point V-Shape Recovery!
🗞 Nifty Summary
The Nifty delivered a session of extreme theater, starting with an 80-point Gap Down at the 25145 support. After a failed 5-minute attempt to reclaim 25270, the index collapsed, slicing through the PDL and the 25060 support.
Panic intensified as the psychological 25,000 mark was breached, leading to a deep low of 24,919.80. However, the bottom band of the daily channel acted as a trampoline, triggering a spectacular 380-point V-shaped recovery back to the day’s highs.
The 25270 level proved to be a stubborn ceiling once more, pushing the index back down by 180 points.
Nifty eventually closed at 25,157.50, essentially flat relative to the open, but having survived a near-catastrophic breakdown.
🛡 5 Min Intraday Chart with Levels
🛡 Intraday Walk
The day was a masterclass in volatility. The morning breakdown below 25,060 was a high-conviction bearish move that targeted the 24970 zone.
Once the “final flush” hit 24920, the vacuum created by exhausted sellers allowed for an aggressive short-covering rally.
This 380-point bounce was one of the sharpest in recent history, though the secondary rejection at 25270 confirms that supply remains heavy on every significant rise.
The market is now in a state of high-tension equilibrium at the channel’s edge.
📉 Daily Time Frame Chart with Intraday Levels
🕯 Daily Candle Breakdown
Open: 25,141.00
High: 25,300.95
Low: 24,919.80
Close: 25,157.50
Change: −75.00 (−0.30%)
🏗️ Structure Breakdown
Type: Long-Legged Doji.
Range: ≈ 381 points — Extreme intraday volatility.
Body: ≈ 17 points — Negligible real body, signaling total indecision.
Upper Wick: ≈ 143 points — Massive rejection from the 25,300 supply zone.
Lower Wick: ≈ 221 points — Aggressive, institutional-grade defense of the channel bottom.
📚 Interpretation
A Long-Legged Doji forming at the bottom band of a channel is a textbook reversal signal. It indicates that while bears had the power to break 25,000, they lacked the conviction to stay there.
However, the equal power of the rejection from the top suggests that the bulls are not out of the woods yet. This structure marks a transition from a trending environment to a high-volatility “battle zone.”
🕯 Candle Type
High-Volatility Indecision (Long-Legged Doji) — Indicates a potential pivot point; validation of today’s low is the only thing keeping the current channel structure alive.
🛡 5 Min Intraday Chart
⚔️ Gladiator Strategy Update
ATR: 245.67
IB Range: 147.60 → Medium
Market Structure: ImBalanced
Trade Highlights:
10:22 Short Trade: Target Hit (R:R 1:4.1) (IBL Breakout)
Trade Summary: The strategy successfully identified the morning’s bearish imbalance. The IBL breakout provided a high-probability entry that captured the slide through the 25,000 psychological level, yielding a massive 1:4.1 R:R before the V-shaped recovery commenced.
Personal Note: The system also alerted for a reversal long trade, but I avoided it due to fear and a technically far Stop-Loss (SL).
🧱 Support & Resistance Levels
Resistance Zones:
25180
25270 ~ 25300 (Crucial)
25380
25430
Support Zones:
25060
25009 ~ 24970
24920 (Line in the Sand)
🧠 Final Thoughts
“The channel bottom has been tested—and it held.”
Today was a survival test for the bulls. The Long-Legged Doji at these levels suggests that a bottom might be in, but turning bullish won’t be easy.
For the upcoming session, if Nifty respects the 24,920 low, the channel remains valid. However, if that low is breached, the structure is discarded, and we enter a new bearish phase. Expect extreme choppiness as both sides fight for control over the next directional move.
✏️ Disclaimer
This is just my personal viewpoint. Always consult your financial advisor before taking any action.
NZDCAD: Bearish Move After Trap 🇳🇿🇨🇦
NZDCAD looks overbought after a test of a key horizontal resistance.
After a bullish trap, the price returned below that and will most likely
continue retracing.
Goal - 0.8074
❤️Please, support my work with like, thank you!❤️
I am part of Trade Nation's Influencer program and receive a monthly fee for using their TradingView charts in my analysis.
What is Bullish/Bearish Mitigation Block & How to Identify It
Bullish and Bearish Mitigation Blocks are easier to identify than you think.
In this article, I will share with you very efficient price models for the identification of Order Blocks and Mitigation Blocks.
You will learn
what is Mitigation Block,
Bullish/Bearish Mitigation Blocks examples,
how to draw Mitigation Block,
how to use Mitigation Block,
in trading Smart Money Concepts SMC ICT.
Bearish Mitigation Block Model
Let's start with a theory and study Bullish Trend Model & Bearish Mitigation Block Formation.
Please, examine a following price model:
In Smart Money Concepts trading, a bullish price structure is based on a consistent formation of new Higher Highs and Higher Lows.
Such a price model will be used to confirm an uptrend .
The zone based on the last higher low in that will compose a Bullish Order Block Zone - the area from where the last bullish impulse initiated.
I will explain how to draw that zone in the examples below.
Bullish Order Block will be confirmed after a violation of a current high - a Break of Structure BoS and a formation of a new Higher High.
In some instances, a bullish wave that initiates from a potential Order Block Zone will FAIL to break a current structure high and will set a Lower High.
A consequent bearish movement and a breakout of an identified Order Block zone will confirm a formation of a Mitigation Block.
A formation of a Bearish Mitigation Block will be an important event that will signify 2 things:
a violation of a current uptrend,
a market structure shift and a start of a new bearish trend.
A Bearish Mitigation Block zone will be applied as the area to sell from.
Probabilities will be high that a strong bearish movement will follow after its test.
Such a market structure shift is not a random event.
One of the most reliable things that can help you to confirm a coming violation of an uptrend is a test of a significant liquidity supply zone.
The market may reach a supply zone and initiate a bearish reversal, or form a bullish trap and a liquidity sweep first.
Both scenarios are acceptable.
Here is an example of a formation of a bearish Mitigation Block on GBPUSD forex pair.
The pair was in a bullish structure and reached a historic supply zone.
After its test, the price retraced and formed a potential Bullish Order Block Zone from where a new bullish wave started.
Drawing that zone, I took the level of the last Higher Low and the low of the body of that candlestick.
The price did not manage to update the high and set a lower high instead.
With a consequent bearish movement, the underlined Bullish Order Block Zone was broken .
A formation of a new lower low lower close confirmed a bearish market structure shift.
Bullish Order Block Zone turned into a Bearish Mitigation Block - the zone from where the next bearish wave started.
Bullish Mitigation Block Model
Now, let's examine a Bearish Trend Model and Bullish Mitigation Block Formation.
In Smart Money Concepts trading, a bearish price structure is based on a consistent formation of new Lower Lows and Lower High.
Such a price model will be used to confirm a downtrend.
The zone based on the last Lower High in that will compose a Bearish Order Block Zone - the area from where the last bearish impulse initiated.
Bearish Order Block will be confirmed after a violation of a current low - a Bearish Break of Structure BoS and a formation of a new Lower Low.
In some instances, a bearish wave that initiates from a potential Order Block Zone will FAIL to break a current structure low and will set a Higher Low .
A consequent bullish movement and a breakout of an identified Order Block zone will confirm a formation of a Bullish Mitigation Block.
A formation of a Bullish Mitigation Block will be an important event that will signify 2 things:
a violation of a current downtrend,
a market structure shift and a start of a new bullish trend
.
A Bullish Mitigation Block zone will be applied as the area to buy from.
Probabilities will be high that a strong bullish movement will follow after its test.
Such a market structure shift is not a random event.
One of the most reliable things that can help you confirm a coming violation of a downtrend is a test of a significant liquidity demand zone.
The market may reach a demand zone and initiate a bullish reversal , or form a bearish trap and a liquidity sweep first.
Both scenarios are acceptable.
Here is an example of a formation of a bullish Mitigation Block on USDJPY forex pair.
The pair was in a bearish structure and reached a historic demand zone.
After its test, the price pulled back and formed a potential Bearish Order Block Zone from where a new selling wave started.
Drawing that zone, I took the level of the last Lower High and the high of the body of that candlestick.
The price did not manage to update the low and set a Higher Low instead.
With a consequent bullish movement, the underlying Bearish Order Block Zone was broken .
A formation of a new higher high higher close confirmed a bullish market structure shift.
Bearish Order Block Zone turned into a Bullish Mitigation Block - the zone from where the next bullish wave started.
Please, also not, that testing a Bullish Mitigation block there was a liquidity grab and a bearish trap below that. Smart Money will often manipulate the market, hunting your stop loss before an expected price movement begins.
The Takeaway
A proper combination of structure mapping and liquidity analysis will help you to predict a market structure shirt and a mitigation block creation in a bullish and bearish trend before they happen.
The models that I shared will help you to confirm bullish and bearish breaker Mitigation Blocks trading Forex or any other markets with Smart Money Concepts SMC ICT.
❤️Please, support my work with like, thank you!❤️
I am part of Trade Nation's Influencer program and receive a monthly fee for using their TradingView charts in my analysis.
CRUDE OIL (WTI): Confirmed CHoCH
It appears that WTI Crude Oil will rise.
The price bounced strongly after the last test
of the underlined horizontal support.
A confirmed bullish change of character, accompanied
by an imbalance, provides a strong confirmation.
I expect a pullback to 61.0 level.
❤️Please, support my work with like, thank you!❤️
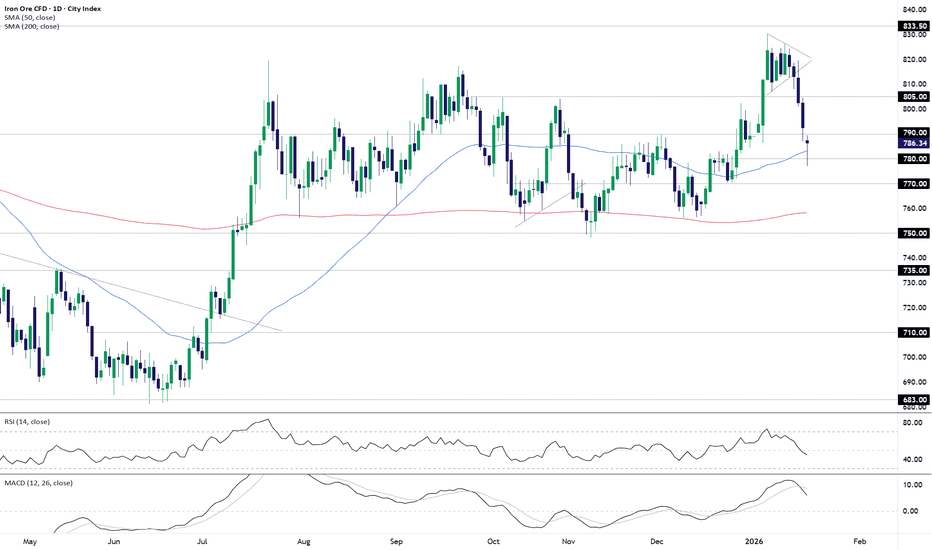
Iron ore snaps back with bullish daily reversalAfter a violent breakdown earlier this week, we have just seen a violent bounce in our iron ore contract, delivering a bullish reversal pattern on the dailies. However, before considering longs, it would be good to see further buying on Wednesday.
Tuesday’s hammer was sparked from a zone consisting of the 50DMA and ¥780, the latter coinciding with where the price was capped in late December before eventually breaking higher. As such, the bounce from beneath the level suggests it may now have flipped to offering support, allowing it to be used for protection for those contemplating long trades.
¥790 is a level overhead that needs to be watched given how much work either side of it the contract has done over the past year. It is regularly tested but with far fewer sustained crossovers, meaning price action today may be instructive on whether to buy the dip or fade the bounce.
Should the price push above ¥790 and close there, long trades could be established above the level with a stop beneath for protection, targeting ¥805 initially. ¥830 and ¥833.50 are other potential options should the reversal gain momentum.
Of course, if the bounce proves to be a false signal and the price reverses back below the 50DMA and ¥780 zone, the setup could be flipped with shorts established beneath the latter with a stop above for protection. ¥770, the 200DMA and ¥750 screen as potential targets, depending on the desired risk reward of the trade.
The message from RSI (14) and MACD is one of shifting momentum, with the former trending lower beneath 50, indicating building downside strength. MACD has also crossed the signal line from above but remains in positive territory. While not an outright bearish message yet, should current trends persist it would favour short setups over longs.
Good luck
DS
CADCHF LONG Market structure bullish on HTFs DW
Entry at both Weekly and Daily AOi
Weekly Rejection at AOi
Previous Weekly Structure Point
Daily Rejection at AOi
Daily Previous Structure Point
Daily EMA retest
Around Psychological Level 0.57500
H4 Candlestick rejection
TP: WHO KNOWS!
Entry 100%
REMEMBER : Trading is a Game Of Probability
: Manage Your Risk
: Be Patient
: Every Moment Is Unique
: Rinse, Wash, Repeat!
: Christ is King.
EURCAD SHORTMarket structure bearish on HTFs 3
Entry at Daily AOi
Weekly Rejection at AOi
Weekly Previous Structure Point
Daily Rejection at AOi
Daily EMA Retest
Previous Structure point Daily
Around Psychological Level 1.61500
Touching EMA H4
H4 Candlestick rejection
Rejection from Previous structure
TP: WHO KNOWS!
Entry 115%
REMEMBER : Trading is a Game Of Probability
: Manage Your Risk
: Be Patient
: Every Moment Is Unique
: Rinse, Wash, Repeat!
: Christ is King.
US CRUDE OIL (WTI): Confirmed Bullish ContinuationI am quite pleased with how 📈USOIL reacted on an important horizontal support level on a 4-hour timeframe.
After the test of the support, the pair started to consolidate and formed a horizontal range.
A breakout above the resistance of this range is a strong bullish indicator.
We are currently seeing a retest of this broken resistance, and we can anticipate continued growth.
Our target is 61.30.
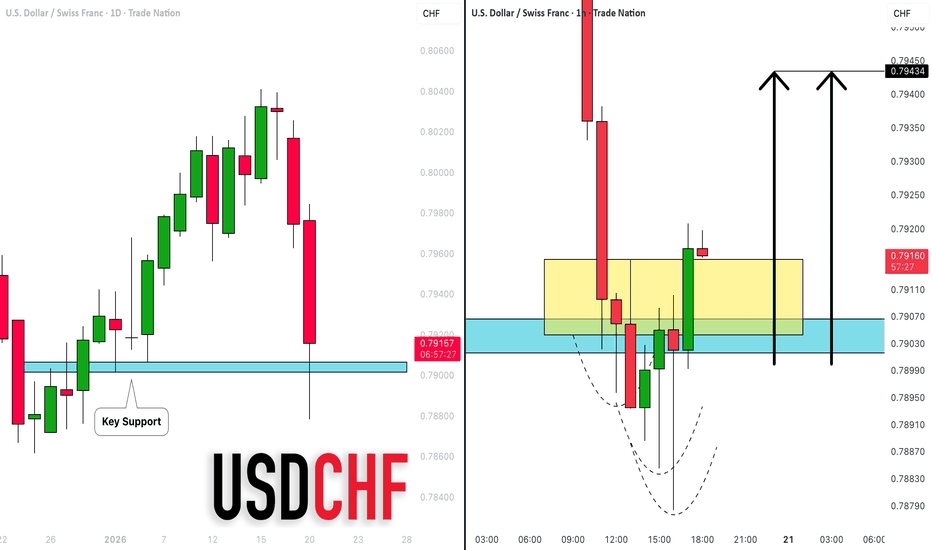
USDCHF: Time to Recover 🇺🇸🇨🇭
USDCHF is ready to recover after a test of a key daily support
and a bearish trap below that.
Expect a rise to 0.7943
❤️Please, support my work with like, thank you!❤️
I am part of Trade Nation's Influencer program and receive a monthly fee for using their TradingView charts in my analysis.
Why Spotify Stock Is Set to Drop Big TimeI am going to say something that might hurt a few feelings today. If you’re buying Spotify stock right now after this rally… price action is already shaking its head.
This stock just had a strong rally, supply is stepping in, and smart money is doing what smart money always does: selling into strength.
Let me show you why buying Spotify stock now is suicidal, and why patience — yes, boring patience — will likely be rewarded much lower.
Expecting the stock to drop big time, still 50% left to drop until the quarterly demand level at $200 is reached. Bearish long-term option strategies is the way to go.
Downdraft in DoorDash?DoorDash hit a record high in late 2025, but now it may face downside.
The first pattern on today’s chart is the price action on October 16. The delivery stock hit a record high, but was rejected and closed under the previous session’s low. Prices remained below the outside day, confirming it as a bearish reversal pattern.
Second, DASH gapped lower on November 6 following quarterly results. It tried to rebound but was rejected six weeks later.
Next, the 50-day simple moving average (SMA) had a “death cross” below the 200-day SMA in late December. That may suggest its long-term direction has turned bearish.
Finally, MACD is falling and the 8-day exponential moving average (EMA) is below the 21-day EMA. Those signals may reflect a short-term downtrend.
TradeStation has, for decades, advanced the trading industry, providing access to stocks, options and futures. If you're born to trade, we could be for you. See our Overview for more.
Past performance, whether actual or indicated by historical tests of strategies, is no guarantee of future performance or success. There is a possibility that you may sustain a loss equal to or greater than your entire investment regardless of which asset class you trade (equities, options or futures); therefore, you should not invest or risk money that you cannot afford to lose. Online trading is not suitable for all investors. View the document titled Characteristics and Risks of Standardized Options at www.TradeStation.com . Before trading any asset class, customers must read the relevant risk disclosure statements on www.TradeStation.com . System access and trade placement and execution may be delayed or fail due to market volatility and volume, quote delays, system and software errors, Internet traffic, outages and other factors.
Securities and futures trading is offered to self-directed customers by TradeStation Securities, Inc., a broker-dealer registered with the Securities and Exchange Commission and a futures commission merchant licensed with the Commodity Futures Trading Commission). TradeStation Securities is a member of the Financial Industry Regulatory Authority, the National Futures Association, and a number of exchanges.
TradeStation Securities, Inc. and TradeStation Technologies, Inc. are each wholly owned subsidiaries of TradeStation Group, Inc., both operating, and providing products and services, under the TradeStation brand and trademark. When applying for, or purchasing, accounts, subscriptions, products and services, it is important that you know which company you will be dealing with. Visit www.TradeStation.com for further important information explaining what this means.
Nifty Analysis EOD – January 20, 2026 – Tuesday🟢 Nifty Analysis EOD – January 20, 2026 – Tuesday 🔴
100-Day Low Breach: Nifty Panics as 25,500 Support Crumbles.
🗞 Nifty Summary
The Nifty opened with a misleading 30-point Gap Up, but the bullish sentiment was vaporized within the first minute.
Mirroring yesterday’s bearish intent, the index slipped 150 points from the first tick. While bulls attempted to form a base around 25,435, the 25,500 level acted as a massive supply barrier, repelling every recovery attempt.
The subsequent breach of the November 7, 2025, swing low triggered a wave of panic selling that no support level could arrest. Nifty plummeted to test 25,180, marking a deep low of 25,171.35. Closing at 25,232.50, the index has recorded its lowest close in the last 100 days, losing -353.00 points (-1.38%).
The primary catalyst for this carnage was a classic structural failure; once key supports were breached, the vacuum created led to a complete “washout” of long positions.
🛡 5 Min Intraday Chart with Levels
🛡 Intraday Walk
The day was a masterclass in “Momentum Expansion.” The initial gap-up was a clear trap, and the 150-point slide set a grim tone for the session.
The mid-day attempt to hold 25,435 was crushed by the overhead supply at 25,500. As soon as the “Line in the Sand” from November ‘25 was crossed, the algorithmic selling took over.
The index is now trading at the bottom band of the channel on the Daily Time Frame. After such a massive 414-point range expansion, the market is severely stretched, suggesting that while the bias is bearish, a “dead cat bounce” or a narrow consolidation phase is likely in the upcoming session.
📉 Daily Time Frame Chart with Intraday Levels
🕯 Daily Candle Breakdown
Open: 25,580.30
High: 25,585.00
Low: 25,171.35
Close: 25,232.50
Change: −353.00 (−1.38%)
🏗️ Structure Breakdown
Type: Strong Bearish Momentum candle.
Range: ≈ 414 points — Very high volatility; major range expansion.
Body: ≈ 348 points — Aggressive selling with almost no intraday recovery.
Upper Wick: ≈ 5 points — Total lack of buying interest at the open.
Lower Wick: ≈ 61 points — Late short-covering from the extreme lows.
📚 Interpretation
The candle structure represents a complete breakdown of market confidence. Opening at the high and closing near the low (despite a minor bounce) confirms that the bears are in absolute control. The breach of the 100-day closing low and the November swing low confirms that the medium-term structure has turned bearish. Distribution is at its peak.
🕯 Candle Type
Strong Bearish Momentum Candle — Indicates decisive selling dominance. This is a “breakout” candle from a larger structural range; typically leads to further downside unless a sharp reversal occurs.
🛡 5 Min Intraday Chart
⚔️ Gladiator Strategy Update
ATR: 230.62
IB Range: 150.40 → Big
Market Structure: ImBalanced
Trade Highlights:
12:41 Short Trade: Target Hit (R:R 1:6.76)
Trade Summary: The setup was a textbook “Narrow CPR” play. Despite the Big IB, the combination of an Important Level Breakout and extreme bearish sentiment supported a high-conviction trade. The sustained fall allowed the strategy to capture a massive 1:6.76 R:R, effectively leveraging the panic selling.
🧱 Support & Resistance Levels
Resistance Zones:
25380
25430
25480 ~ 25495
25550
25605
Support Zones:
25270
25180 ~ 25145
25060
25000 ~ 24970
🧠 Final Thoughts
“Panic is the harvest of broken levels.”
The Nifty has reached the bottom of its daily channel, and the RSI is likely approaching oversold territory.
For tomorrow, expect a decrease in volatility with a smaller range movement. We might see 25,060 act as a temporary floor, or potentially triggering a “dead cat bounce” back toward the 25,380 resistance.
Regardless of the bias, we will wait for the Initial Balance (IB) to form before committing to any intraday actions. The strategy is to respect the trend but be wary of a sharp, low-volume bounce from the channel extremes.
✏️ Disclaimer
This is just my personal viewpoint. Always consult your financial advisor before taking any action.


