Evening Doji Star Sets On USDCHF, Price To FollowOn Wednesday, November 5th, Price on OANDA:USDCHF rose and tested the Resistance Level that's been overhead since August. Today with the decline in price on the Daily, suggests that we are looking at a very strong 3 Candlestick Pattern, the Evening Star Doji!
The Evening Star Doji is a Bearish Reversal Candlestick Pattern consisting of 3 candles: first being a large Bullish candle, second is a Doji candle representing the indecision between Bulls and Bears then followed by the 3rd candle being a large Bearish Candle, meaning Bears have overcome the Bulls.
Now if Price really is to reverse, the following candle after this pattern is formed should be a Bearish one, considering the Confirmation candle will confirm the reversal in price and continue to fall!
Candlestick Analysis

Bitcoin Below a Key Resistance – Day 2👋🏻 Hey everyone! Hope you’re doing great! Welcome to SatoshiFrame channel.
✨ Today we’re diving into the 1-Hour BITCOIN analysis. Stay tuned and follow along!
🪙 On the 1-hour timeframe, Bitcoin is currently ranging below its key resistance zone at $106,590 in a multi-timeframe structure. A confirmed breakout above this level could potentially lead to further bullish momentum toward the next resistance area.
📊 Looking at Bitcoin’s volume, we can see that as price reached this crucial resistance, volume has decreased, showing more selling interest among traders. However, the interesting observation here is that even selling volume itself has slightly declined, and during the latest reaction to this resistance (in the 15-minute multi-timeframe), we witnessed an increase in buying volume.
✍️ The possible breakout scenario for this resistance is quite simple and comes with a small stop-loss range. You can consider entering a trade based on this scenario, but always remember proper risk and capital management.
↗️ Long Position Scenario 1 : Breakout above the $106,590 resistance accompanied by increasing buying volume on either the 1-hour or 15-minute multi-timeframe. If we get a candle setup (Indecision + SMA7) before and after the breakout, it can serve as a valid entry signal.
↗️ Long Position Scenario 2 : Breakout above the $106,590 resistance with rising volume and the formation of a higher low on the multi-timeframe compared to the previous low. In this case, we can enter a long position and set the stop-loss below the potential higher low.
❤️ Disclaimer : This analysis is purely based on my personal opinion and I only trade if the stated triggers are activated .

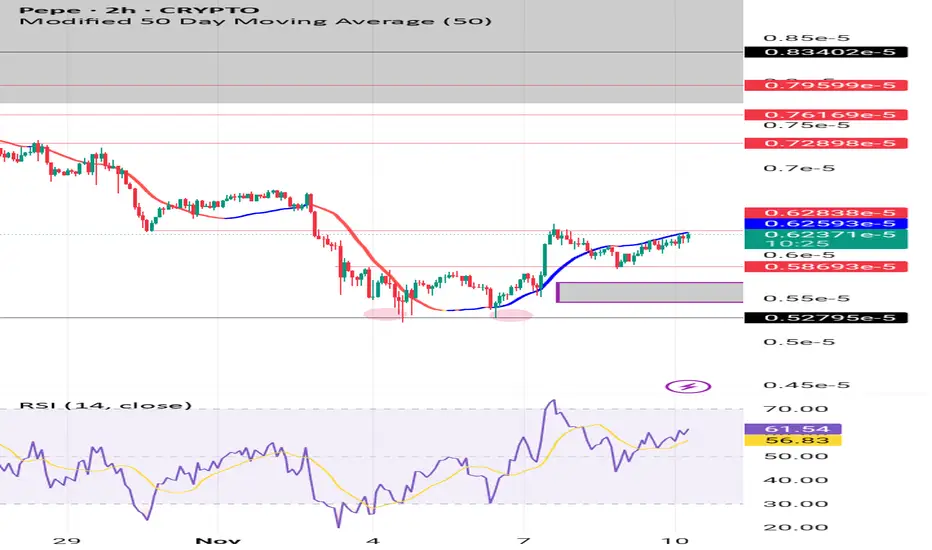
PEPE/USD (2 hour chart Analysis)🟢 PEPE/USD (2-Hour Chart Analysis)
PEPE is currently trading around $0.00000620, sitting slightly below its 50-period moving average, which shows that the short-term trend is still under pressure. The RSI on the 2-hour chart is hovering below 50 — meaning momentum remains weak, but not oversold enough to confirm exhaustion. Price has formed a shallow base near the $0.00000590-$0.00000600 zone, an area that also aligns with a small fair value gap (FVG), suggesting it could act as short-term support if buyers step back in. This area will likely determine whether the next move is a bounce or another slide.
My bias is mildly bullish, but only if confirmation steps in. If PEPE breaks above the 50-period MA with convincing volume, it could trigger a short-term upside move toward $0.00000640-$0.00000650. However, if the price fails to reclaim that moving average and loses support near $0.00000590, a deeper correction could follow. The best move here is patience — let the market show its hand before reacting. As always, PEPE is a high-volatility meme token, so manage risk wisely and never trade with emotions.
Top 3 Lessons From Trading Since 2017In life you have to know the following:
Learn to keep secrets.
This is very hard especially if you are a leader
i see many many influences make this mistake
Even i myself i have made
this mistake so many times.
Some topics are just to sensitive to share.
Its a sad reality that some people
don't want to know the truth
even if the truth is going to help them.
If you have a business
learn to give your employees more details
The more details you give employees
the more they can help you out.
This also applies to leadership positions.
If you are leader of a group
you have to try your best to give more
details.
Now this does not mean give them
all the details at once
it just means learn to understand
if they did not understand the first time
they did the task you
asked them to do.Be patient with
your employees they are not
perfect give them
time to digest information.
This wont be easy because some employees
dont follow instructions.
Learn to respect monetary limits.
In as much as you want to show off
like every person i know.
You have to hold back and learn to reserve your capital
This is a very powerful lesson that
you can apply
to your trading knowledge as well.
Capital reserving is part of risk management
Look at the MACD indicator on the daily chart
the histogram is Dark green
this is the highest probability of trading that you
could wish for.Of course seeing
such a trade doesn't mean you will
always find good trades
The MACD Histogram is
my favourite indicator
learn more about it
Rocket boost this content to learn more.
Trade safe.
Disclaimer: Trading is risky learn risk management and profit
taking strategies.
Please use a simulation trading account
before oyu trade with real money.

Nifty Analysis EOD – November 10, 2025 – Monday🟢 Nifty Analysis EOD – November 10, 2025 – Monday 🔴
Bullish Breakout Sustained — Can Buyers Target the Next Major Zone?
🗞 Nifty Summary
Nifty continued its recovery, successfully breaching and closing above the previous day’s high (PDH), signaling strong follow-through. Despite giving up half of the day’s gains in a volatile final hour, the index settled at 25574.25, confirming that bulls remain in control of the short-term sentiment.
This session effectively formed an Open=Low (OL) structure (ignoring a minor 6-point shadow), reflecting strong conviction from the open. To maintain this bullish momentum, bulls must decisively close above 25650 and aim for 25790. Should momentum falter, holding the 25400 level is critical for survival in the current structural battle.
🛡 Intraday Walk
The session commenced with a flat to positive bias, immediately spiking 70 points within the first minute to breach the PDH and R1, marking an initial day high at 25591.45. This initial surge could not be held, leading to a brief slip back toward the session’s opening level.
From there, a strong and gradual ascent began, successfully clearing the PDH, R1, and CDH. Nifty then crossed the Important Resistance Zone of 25615 ~ 25635, establishing a new intraday peak at 25651.95.
After marking this high, Nifty entered a tight consolidation phase for the next 2 hours and 15 minutes, ranging narrowly between 25652 ~ 25620. This equilibrium was shattered at 13:40, triggering a breakdown and a surge in volatility. A sharp, sudden fall and immediate recovery from the mean level likely trapped many short-term traders.
A final attempt to breach the day high failed, and bears took charge, dragging the index down by around 87 points, pushing it below the mean and IB High. Ultimately, Nifty surrendered half of its morning gain, but closed convincingly at 25574.25, above the previous day’s high.
🛡 5 Min Intraday Chart with Levels
📉 Daily Time Frame Chart with Intraday Levels
🕯 Daily Candle Breakdown
Open: 25,503.50
High: 25,653.45
Low: 25,503.50
Close: 25,574.35
Change: +82.05 (+0.32%)
🏗️ Structure Breakdown
Type: Bullish candle with a relatively narrow body but clean structure.
Range (High–Low): ≈ 149.95 points — a modest intraday movement.
Body: ≈ 70.85 points — reflective of a steady upward close.
Lower Wick: No lower wick → buying strength evident from the very start of the session (Open = Low).
Upper Wick: Small upper wick → mild profit booking near the top, but buyers held control until the close.
📚 Interpretation
The day opened precisely at the session’s low, signaling that sellers had zero conviction from the start. Prices sustained gains throughout the session, closing well above the midpoint of the range. This structure indicates controlled, steady buying throughout the majority of the day—a powerful sign of returning confidence and structural strength following last Friday’s reversal.
🕯 Candle Type
This session formed a Bullish Marubozu variant (Open = Low, strong close). It reflects decisive bullish sentiment, often acting as a continuation signal or early confirmation after a period of consolidation.
🛡 5 Min Intraday Chart
⚔️ Gladiator Strategy Update
ATR: 199.99
IB Range: 80.45 → Medium
Market Structure: ImBalanced
Trade Highlights:
09:35 Long Trade – Target Achieved (R:R 1:2.38)
13:05 Short Trade - Target Achieved (R:R 1:3.14)
Trade Summary: The Gladiator Strategy successfully captured the initial bullish momentum and later capitalised on the profit-booking phase, securing two high-R:R exits.
🧱 Support & Resistance Levels
Resistance Zones:
25585
25615 ~ 25635
25680
25715
25790
Support Zones:
25550
25510
25460 ~ 25440
🧠 Final Thoughts
“When the market opens at the low and stays there, you are looking at commitment, not doubt.”
Today’s Open=Low structure was a clear continuation signal, teaching us that conviction often trumps recent volatility. The primary lesson is that while consolidation (like the midday range) can be boring, the breakout (or breakdown) that follows is where the most powerful trades are found. For motivation, remember that even a strong bullish day offers tactical counter-trend opportunities, as proven by the successful late-day short trade.
✏️ Disclaimer
This is just my personal viewpoint. Always consult your financial advisor before taking any action.

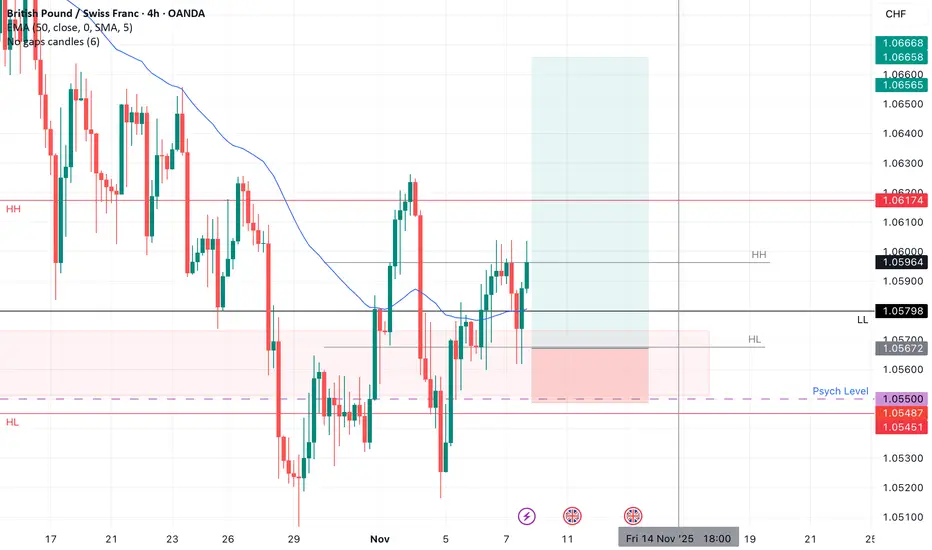
GBPCHF LONGMarket structure bullish on HTFs DH
Entry at Daily AOi
Weekly Rejection at AOi
Daily Rejection at AOi
Previous Daily Structure Point
Around Psychological Level 1.05500
Touching EMA H4
H4 Candlestick rejection
Rejection from Previous structure
TP: WHO KNOWS!
Entry 90%
REMEMBER : Trading is a Game Of Probability
: Manage Your Risk
: Be Patient
: Every Moment Is Unique
: Rinse, Wash, Repeat!
: Christ is King.
Good follow up candle but Nifty. Nifty today gave a good follow-up candle after Friday's green candle where it confirmed Mother line support. Nifty today closed at 25574. Nifty made a high of 25653 but could not hold 25650 level which was very important for further progress. Once Nifty gives a closing above 25653 now we can see further positivity in the market. The resistances for Nifty remain at 25653, 25819, 25951 and 26155. The channel top for Nifty is in the zone of 26306 to 26498 if we and when we get a closing above previous all time high of 26277. Supports for Nifty now remain at 25440, 25338 (Mother line support) and 25239. A closing below 25239 can bring further weakness which can drag Nifty towards 24892, Father line support of 24660 or even 24292 which is currently the mid channel support. As of now shadow of the candle looks positive and RSI is also turning bullish.
Disclaimer: The above information is provided for educational purpose, analysis and paper trading only. Please don't treat this as a buy or sell recommendation for the stock or index. The Techno-Funda analysis is based on data that is more than 3 months old. Supports and Resistances are determined by historic past peaks and Valley in the chart. Many other indicators and patterns like EMA, RSI, MACD, Volumes, Fibonacci, parallel channel etc. use historic data which is 3 months or older cyclical points. There is no guarantee they will work in future as markets are highly volatile and swings in prices are also due to macro and micro factors based on actions taken by the company as well as region and global events. Equity investment is subject to risks. I or my clients or family members might have positions in the stocks that we mention in our educational posts. We will not be responsible for any Profit or loss that may occur due to any financial decision taken based on any data provided in this message. Do consult your investment advisor before taking any financial decisions. Stop losses should be an important part of any investment in equity.
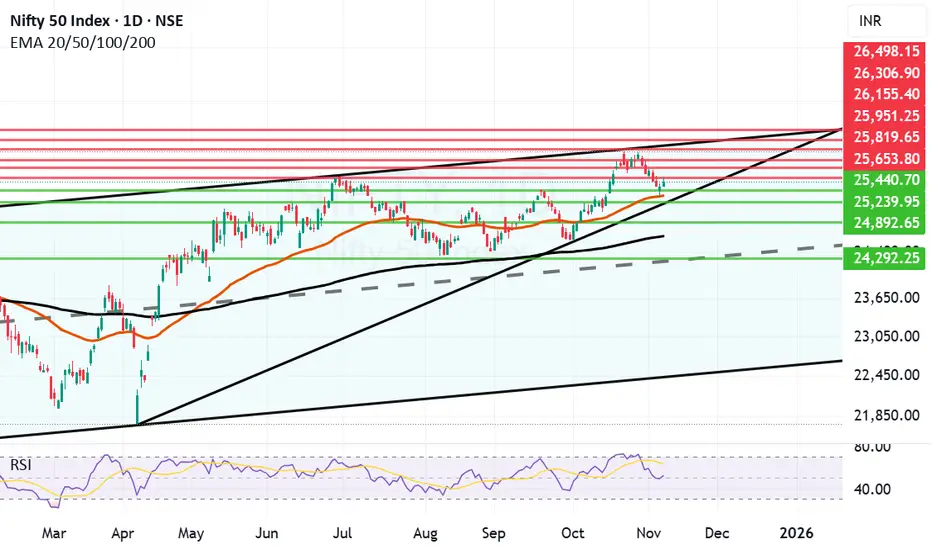
Chart Talk - Nifty it not yet Complete Bullish Hey Guys Welcome to Chart Talk
Today Nifty opened Gap-up and sustained went upside but after that the resistance came so market down over all trend looks down for tomorrow I have explained my View
Thank you

USDJPY | Institutional Sells from HTF Supply Zone (Instant ExecuUSDJPY has tapped into a higher-timeframe supply zone that aligns with the weekly sweep and 4H CHoCH, confirming potential downside momentum.
After the recent BOS, price retraced back into the previous structural supply, forming an S&S pattern (sweep and shift) within the same zone.
The setup aligns with bearish intent from institutional order flow, suggesting smart-money distribution before the next leg down.
🔹 Execution: Instant market sell from 154.15–154.20
🔹 Stop-Loss: Above 154.55 (protected high)
🔹 Target: 152.80 (Realistic TP area)
🔹 Bias: Bearish continuation into lower liquidity zones
Technical Confluence:
• W1 sweep confirms distribution phase
• 4H CHoCH + BOS = structural shift bearish
• S&S rejection inside refined M30 supply
• Liquidity resting below recent lows (152.80)
This setup respects SMC principles — liquidity sweep → structural shift → premium entry — under institutional context.
💬 Monitor for a clean M15–M5 confirmation candle close to maintain precision entry and manage partials along the way.

GBPAUD: Bullish Move From Support 🇬🇧🇦🇺
GBPAUD is going to continue recovering after a test
of a significant daily support.
A strong buying imbalance on an hourly time frame
suggest a strong bullish pressure.
Expect a growth at least to 2.0198
❤️Please, support my work with like, thank you!❤️
I am part of Trade Nation's Influencer program and receive a monthly fee for using their TradingView charts in my analysis.

US 500 - Has All the Good News Been Priced?After a volatile and nervy 5 days for US stock indices the week ended on a slightly more stable and positive footing.
In relation to the US 500 index this volatility saw it open on Monday November 3rd around 6885, trade down to a low of 6633 early on Friday November 7th, before rallying by over 1% late in the session to close the week at 6742. The driver for the rally was news that Democrats and Republican lawmakers had restarted negotiations to try and resolve what has become the longest US government shutdown in history.
This shutdown has been reported by Bloomberg to be costing the US economy around $15 billion per week in lost productivity and has stopped the release of key US economic data readings, leaving Federal Reserve (Fed) policymakers in the dark regarding the health of the US labour market (Non-farm Payrolls) and the direction of inflation (CPI/PPI/PCE). Two areas which are crucial in helping them decide whether they have room, or the need to cut interest rates again at their next meeting in December.
Perhaps unsurprisingly, after a jittery week where the lofty valuations of AI firms were called into question and weighed on the price of the US 500 index, traders may now be looking at whether a resolution to the shutdown, which would restart the economic data flow again ahead of the Fed’s next rate decision on December 10th could be possible, bringing with it a potentially much needed boost to flagging sentiment.
On Sunday, traders received the news that the Senate had moved closer to an agreement, an update which has helped the US 500 to register an early gain of 0.5% (6790 at 0700 GMT) to start this new trading week. However, even if the agreed bill is eventually passed by the Senate, it must be approved by the House of Representatives and signed by President Trump (Reuters), meaning there could be more volatility ahead for the US 500.
Technical Update: Conflicting Signals Within Weekly & Daily Perspectives
Since the October 30th all-time high at 6925, the US 500 index has slipped just over 4.2%, reflecting an unwind of potentially over-extended upside conditions.
Looking at the charts there appears to be conflicting technical signals between the weekly and daily perspectives at present, leaving the directional bias uncertain heading into the new week.
Upcoming sessions could offer clarity on whether the constructive themes emerging on the daily chart or the possibly negative developments evident in the weekly view may take control.
Weekly Chart – Potential Negative Outlook?:
Over the past three weeks, a possible Evening Star pattern has emerged on the weekly chart, a potentially negative development. Last week’s price weakness may have completed a sentiment shift, and if downside momentum builds, it could lead to further declines in the sessions ahead.
It remains to be seen whether this leads to further price weakness, but downside pressure may now build. If developed further, breaks below support at 6503, the October 2025 low could materialise, opening the door to a deeper phase of weakness toward 6214, a level equal to the August 2025 low, potentially even 6105, the 38.2% Fibonacci retracement of the April to October 2025 rally.
Daily Chart – Potential Positive Sentiment Shift?:
Following the recent sharp price decline, the daily chart presents a dilemma for traders, especially against the backdrop of a potentially negative weekly setup. Friday’s session initially extended recent downside moves but found support at 6647, the 38.2% Fibonacci retracement of the April to October rally. From there, fresh strength emerged, and the session closed near its opening level at the upper end of the day’s range.
Candlestick analysis suggests a potentially positive Dragonfly Doji has formed, hinting at an attempt to resume price strength. Confirmation is key, a positive candle on Monday, seen with a close above todays 6769 opening level, would offer weight to this pattern.
While not a guarantee of further upside, such activity might also see a close above resistance at 6779 (half the latest decline) a level at present being tested (0700 GMT), to potentially suggest a retest of 6925, the October 30th high.
Initially it is unclear whether the weekly or daily outlook will gain the upper hand in the US 500 index, but next week’s price action, especially the moves on Monday, could be important.
With the weekly chart hinting at a negative reversal risk and the daily chart showing signs of potential stabilisation, even possible positive risks, Monday’s candle direction may offer clues, and traders may be watching closely for evidence of the next directional themes.
The material provided here has not been prepared accordance with legal requirements designed to promote the independence of investment research and as such is considered to be a marketing communication. Whilst it is not subject to any prohibition on dealing ahead of the dissemination of investment research, we will not seek to take any advantage before providing it to our clients.
Pepperstone doesn’t represent that the material provided here is accurate, current or complete, and therefore shouldn’t be relied upon as such. The information, whether from a third party or not, isn’t to be considered as a recommendation; or an offer to buy or sell; or the solicitation of an offer to buy or sell any security, financial product or instrument; or to participate in any particular trading strategy. It does not take into account readers’ financial situation or investment objectives. We advise any readers of this content to seek their own advice. Without the approval of Pepperstone, reproduction or redistribution of this information isn’t permitted.

The bulls are back, and going long remains the main theme.#XAUUSD OANDA:XAUUSD TVC:GOLD
Although the beginning of the week didn't offer a pullback entry opportunity, gold rallied immediately after the open, breaking through 4030 as expected and continuing its upward trend, officially signaling the return of the bulls to the market.
From the hourly chart, gold broke through the resistance of the upward channel at 4055 and continued to fluctuate upwards, indicating that the bullish momentum remains strong in the short term. However, attention should be paid to the resistance at 4080-4100 from the weekly MA5 moving average and the daily middle line, and be wary of a possible pullback after a surge. Therefore, in the short term, avoid blindly chasing the rally, patiently waiting for a pullback to buy remains our main trading strategy. The first support level to watch is the 4055-4045 level, a previous resistance turning point, followed by the important support at 4030-4020.
Therefore, if gold prices fall back after encountering resistance during the European session, we can consider going long on gold in batches based on the strength of the pullback.

GBP/USD: Bullish Reversal Confirmed?!📈GBPUSD formed an inverted head and shoulders pattern on the 4-hour timeframe.
The breakout above its neckline serves as a strong bullish reversal signal.
The broken neckline of this pattern is now expected to act as a significant support level.
We anticipate a subsequent upward movement from this point, targeting at least the 1.3216 resistance level.

CHFJPY: Trend Continuation on Market OpenKey Observations
Pair is in a very structural uptrend according to the D1 TF
Price crossed and closed above DTL last Friday on the H1 TF
Current expectation is for price to continue upside momentum; however, reduced position size due to lower volatility during market open

“ETHEREUM Just Flipped Bullish — Strong Reversal Signal Ethereum just printed a strong bullish breakout from key structure on the 4-hour chart.
✅ Signal: Strong bullish engulfing candle closing above resistance
🎯 Long Entry: $3,550 zone
🛑 Stop Loss: $3,517
🎯 Target: $3,700+
This move shows clear momentum shift — bulls stepping back in with strength after multiple rejections.
I’ll be watching closely for a retest of the breakout zone before continuation.
What’s your take — do we break $3,700 next, or is this a bull trap? 👀
Drop your thoughts and analysis below!
#Ethereum #ETHUSDT #CryptoTrading #PriceAction #TradingView #CryptoAnalysis #ETH #BullishSetup #SmartMoney #CryptoCommunity #TradeWithMky

EURUSD: Opening ATL BreakKey Observations
D1 timeframe indicates structural downtrend
Price is attempting to revert back below the horizontal trend line (HTL)
Price rests below EMA band, which also indicates downtrend
On the H1 timeframe, price crossed below the intraday ascending trend line (ATL)
However, EMA20 has not crossed EMA60 so definitely need to remain cautious

Long trade Buyside trade idea...?
📘 Trade Journal Entry
Pair: EURJPY
Date: Fri 7th Nov 2025
Session: New York PM
Direction: Buy-side Trade
Timeframe: 1 Hour
🔹 Trade Details
Entry: 177.239
Take Profit (TP): 178.819 (+0.89 %)
Stop Loss (SL): 176.847 (–0.22 %)
Risk / Reward (RR): 4.03 R
1Hr TF overview
🔹 Market Context
🧾Price formed a liquidity base below 176.80 after multiple rejections, indicating absorption of sell-side orders.
🧾Subsequent break of structure and clean reclaim above the KAMA adaptive MA confirms short-term momentum rotation to the upside.
🧾The POI sits within a prior discount OB (176.80–177.00), aligning with Fibonacci 0.75 retracement and a key fair-value gap fill.
🧾Volume activity usually increases in the NY PM session, reinforcing institutional participation in the move.
🧾Higher-timeframe bias remains bullish — structure maintains higher-highs and higher-lows sequence since late October.
🔹 Model Type
Re-accumulation → Breaker Block → Continuation Model
Prior consolidation acted as a re-accumulation zone beneath minor resistance.
Entry executed on retest of the breaker block, confirming bullish displacement.
Trade targets the upper liquidity pocket near 178.80, corresponding to prior equal highs and premium inefficiency.
🔹 Execution Notes
Entry triggered on retracement into the NY PM session fair-value zone (177.20–177.00).
SL is placed just below the breaker block low (176.85). TP positioned at equal highs 178.80, ahead of a major liquidity cluster. Confirmation via bullish MGB candle + KAMA cross, ensuring continuation probability.
🔹 Trade Narrative
This EURJPY setup follows a buyside liquidity draw from an intraday accumulation range.
Price reclaimed structure above 177.00 with clear volume expansion and session alignment.
The confluence between structural shift, breaker block retest, and KAMA slope change supports a strong continuation narrative toward the 178.80–179.00 liquidity zone. The trade represents a controlled intraday continuation play within an already established bullish environment.

BTCUSD – Short Setup from Daily Supply Zone | R:R 5.59Price has retraced and we can expect if price rejects the daily supply zone (around 109,354–111,246 USD) after a strong bearish impulse. This zone aligns with prior imbalance and bearish order flow, offering a high-probability sell limit opportunity.
Trade Setup Details:
Type: Sell Limit
Entry: 109,354
Stop Loss: 111,246
Take Profit: 98,780
Risk-Reward: 5.59R
Technical Context:
Daily structure remains bearish with lower highs forming.
The 30m supply zone confluences with the daily supply, reinforcing the rejection area.
Target set near previous demand base and liquidity sweep around 98,780.
Trade Plan:
Wait for price to tap into supply and show confirmation of rejection before executing. Manage risk responsibly and trail stop once price clears 1R.

Long trade
1Ht TF overview
📘 Trade Journal Entry
Pair: RENDERUSDT.P
Date: Sun 9 Nov 2025
Session: London → New York Overlap
Direction: Buy-side Trade
Timeframe: 1 Hour (Entry refined on 1-min TF)
🔹 Trade Details
Entry: 2.323
Take Profit (TP): 2.515 (+8.27 %)
Stop Loss (SL): 2.308 (–0.65 %)
Risk / Reward (RR): 12.8 R
🔹 Market Context
🧾Following an aggressive markup leg on Nov 7, the price entered a retracement phase that mitigated the previous bullish FVG.
🧾The discount region (0.75 Fib) aligned with the KAMA dynamic support (≈ 2.31), forming a low-risk accumulation zone.
🧾Volume contraction and the formation of a mini-range indicated absorption of residual supply.
🧾Break above micro-breaker (2.33) confirmed a structural CHOCH on the lower TF, setting up a potential continuation toward 2.51 liquidity.
🔹 Model Type
Re-accumulation → Breaker Block → Continuation Model
A corrective decline retraced into prior OB support; bulls defended it.
Entry executed on confirmation of bullish displacement through intraday structure.
Target aims for upper inefficiency fill near 2.50–2.52 range, aligning with HTF imbalance.
1min Tf overview
📈 Execution Notes
Entry triggered immediately after bullish MSB on 1-min TF.
SL is placed below reactive OB at 2.308 to maintain tight risk.
TP is positioned just under the premium Fib extension,
(0.25 zone ≈ 2.515) to secure profits before the major liquidity pool.
Volume signature: buying pressure returned with a mid-range
engulfing candle — institutional buying confirmed.
🔹 Trade Narrative
This RENDER setup highlights a refined continuation entry within a developing bullish expansion. After the Nov 7 impulse, market structure rotated into a controlled pullback; the reaction from the discount zone confirmed the re-accumulation phase. The buyside trade leverages momentum alignment on KAMA and volume acceleration during session overlap, projecting a measured move toward 2.5 premium liquidity for an approximate 12 R return.
5min TF (Sweep/trigger/model 010)

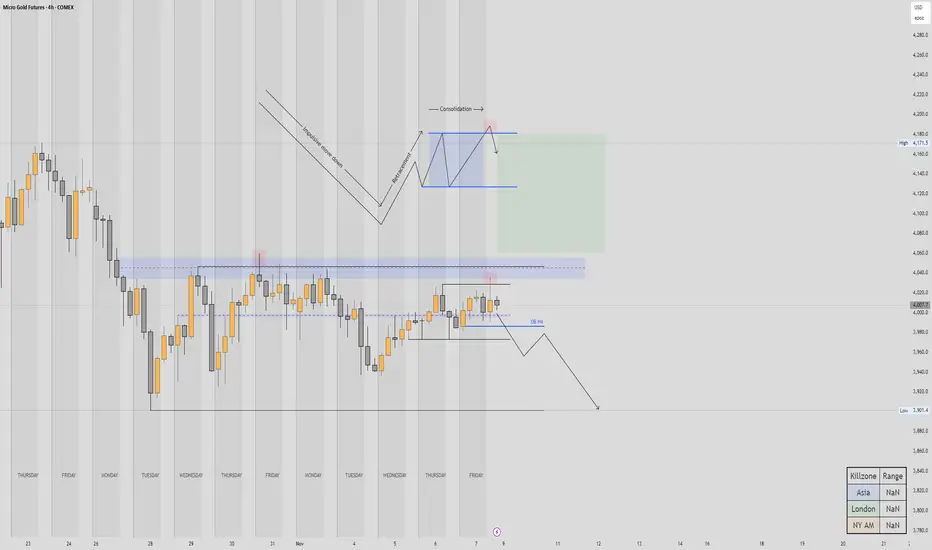
Gold futures to break back down the 4000?As we all know Gold has had an incredible rally this year,
Though, it's been consolidating for the last two weeks, and as far as the structure of the consolidation, some of the liquidity has been taken from the daily FVG on Oct the 30th, leaving a permanent high on the H4 chart with a nice bearish candle
Then it consolidated again for a bit, got an impulse to the downside, retraced with difficulty back to the H4 order block, to consolidate again last 2 days of last week. Finally , it printed what could be more of a permanent high on friday afternoon.
The combination of this, plus the last two day's candles looking bearish, starts to advocate for a bearish bias.
Therefore I'd like to see the price go and reach for the low of the range, after it's breaking the H4 structure
Of course this idea could be invalidated, if Gold was to break above the recent high and the Daily FVG, then we'd reasses the situation.
Still, I would be cautious for longs, Gold has been very extended for a very long time, needs to cool off a bit so we can go buy some coins again!
Cheers!
GBPUSD Retracement then back down GBPUSD kind of the same as EU
Very mean push down last week as expected, but, also it printed a quiet agressive reversal Weekly candle, therefore, I would like to see the price open low, reach into last week's wick, then back into the range, if it was to go and grab some liquidity into the FVG first, that would make a very good candidate for a short term long,
There is always the possibility for the price to open higher and trade higher then we'd adjust but, prefered scenario, trade lower, then back to previous week high,
If it does that, I'm not sure we'll have the reversal back to resume the downtrend this week, we left a lot of liquidity on the upside, I don't see the price just shooting down, it's possible, but less probable,
So for this week, looking at the continuation of the retracement up, then will start looking for sign or reversals back to the south. This 0.62/0.79 zone looks very appealing!
Good week and happy trading!

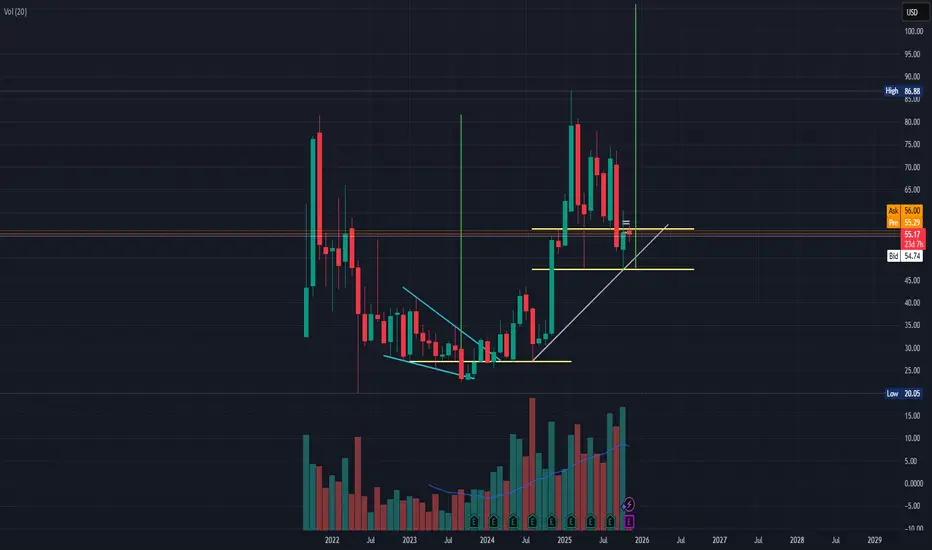
Cup & Handle - BROS (Monthly Chart)As you can see in the monthly chart of BROS, a cup and handle pattern is forming.
The price target of a cup and a handle is the depth of the cup but starting from the the handle's ending candle.
In this graph, you can see that I'm using a little conservative price target: the price target is not from the end of the handle, rather from the support around 47.
That is because the cup depth from the handle would give us 100%+, and though I like such results, I'm a little conservative when it comes to trades of above 50% gain, regardless of trade length (and it's more of personal risk management and it works for me but maybe someone else can see this as a clear sign of consistent buying until PT).
Fundamentally, the earning of 5-Nov-2025 after market, shall play a huge role in succeeding the completion of the cup and handle price target.
My short term price target is 62, and the reason for that is the 20-Aug-2025 and 15-Sep-2025 role reverse from support to resistance (Daily Chart), and considering BROS volatility, it's conservative, yet, risky in nature.
My medium term target is 77.5 which is the highest from the body candle from the left of the cup and handle and not the second one of 79.16, and again, the reason for this is because I want to take a more conservative approach as BROS volatility may hurt high risk-intolerant traders.
The long term target is 105 due to the cup and handle depth.
Generally, I'm a high risk trader. However, with current market conditions and the current phase of uncertainty in U.S. equities due to government shutdown and volatile policies (especially tariffs), one might want to seek more conservativeness in their trading.
That being said, BROS is fundamentally one of the best growth stories I've analyzed. Revenues, earnings, cash management and funding, operational execution, etc., combined they check out the marks of a good investment. Yet, also fundamentally, it has a lot of optimism priced in, and as of this writing, we are confronting investors fears from the current uncertainty, high valuations, and profit taking period. we might see some selling pressure after a strong hike (assuming positive/expectations beat in earnings) due to profit taking and uncertainty. It has a very high valuation comparing to its peers, yet, it also has great growth comparing to its peers...
Not a financial advise, just a guy behind a screen.
Please do not hesitate to share your opinions, as long as it's logical.
Long trade
30min TF
📘 Trade Journal Entry
Pair: ONDOUSDT.P
Date: Sun 9th Nov 2025
Session: Tokyo → London AM
Direction: Buy-side Trade
Timeframe: 30 minutes
🔹 Trade Details
Entry: 0.6526
Take Profit (TP): 0.7791 (+19.97 %)
Stop Loss (SL): 0.6409 (–1.84 %)
Risk / Reward (RR): 14.74 R
🔹 Market Context
The market had completed a multi-week distribution phase from the 0.95 – 0.85 region before entering a deep markdown.
🧾Support levels confirmed at 0.6177 and 0.5955, with price reacting impulsively from this demand zone.
🧾The Order Block at 0.64–0.65 aligns with a discount zone within the overall range (0.75–1.00), forming a high-probability re-accumulation base.
🧾KAMA (Adaptive MA) flattening and beginning to curl upward — signalling momentum shift.
🧾Volume profile shows capitulation flush followed by absorption, typical of a Selling Climax Automatic Rally → Secondary Test transition.
15min TF overview
🔹 Model Type
Accumulation → Breaker Block → FVG Continuation Model
Accumulation occurred after the final markdown sweep; the price broke the structure upward, confirming the intent. Subsequent pullback into the Order Block confluence zone provided the entry trigger at 0.6526. The setup aims for continuation toward the premium inefficiency zone, located near 0.78–0.80.
🔹 Execution Notes
Entry refined within discount range (0.65–0.64) following low-volume retrace into structural support. Stop placed below the most recent Secondary Test wick (0.6409). Target projected at the upper FVG region overlapping the prior distribution midpoint. Confluence factors: OB alignment + Fib 0.618 retracement + KAMA reversal slope + session overlap liquidity injection.
🔹 Trade Narrative
This ONDO setup presents a shift from redistribution to early markup.
After weeks of compression and markdown, ONDO formed a structural low and reclaimed the prior order-block zone. The break of structure confirmed bullish intent, while the entry at the retest captured the transition from accumulation to markup. Target zones align with unmitigated inefficiencies and liquidity above 0.78, offering a strong 14 R+ reward potential under controlled risk.
