I dont make the rules, watch the bear flagbear flag top is based on 10 year trend line (Thick black line). I'm waiting to see where it breaks. Could be violent either way.
Candlestick Analysis

Nifty Analysis EOD – December 12, 2025 – Friday🟢 Nifty Analysis EOD – December 12, 2025 – Friday 🔴
Bullish Confirmation: 26030 Conquered!
🗞 Nifty Summary
The Nifty successfully followed through on yesterday’s strength, opening with a 90-point Gap Up above the PDH and immediately targeting the next resistance level.
The index marked its initial high at 26,038.4 but faced a sharp rejection, causing a full retracement back toward the day’s low. This sharp move proved to be a successful bear trap, as buyers defended the base.
The market then recovered fully, pushing back to the day’s high zone. The session closed strongly at 26,037.15, comfortably above the 26030 resistance level.
Despite the narrow range and multiple fakeouts that troubled intraday traders, the strong closing structure reinforces the bullish bias. Bulls have now cleared the 25920 ~ 25930 resistance and must now conquer the next major hurdle at 26104 to sustain the momentum.
🛡 5 Min Intraday Chart with Levels
🛡 Intraday Walk
The day’s narrative was defined by high volatility within a very narrow range. The initial gap-up hit the target resistance and triggered the sharp rejection, but the failure of sellers to break the day’s low confirmed strong underlying demand.
The rest of the day saw the Nifty hover near the Day High/IBH, with multiple false attempts to breach the IBH. This narrow, choppy consolidation was necessary after the strong move from the 25700 base. The close at 26,037.15 is strategically important as it converts the 26030 resistance into new support, setting the stage for the next upward push.
📉 Daily Time Frame Chart with Intraday Levels
🕯 Daily Candle Breakdown
Open: 25,971.20
High: 26,057.60
Low: 25,938.45
Close: 26,046.95
Change: +148.40 (+0.57%)
🏗️ Structure Breakdown
Type: Bullish candle with a strong body.
Range (High–Low): ≈ 119 points — controlled volatility.
Body: ≈ 76 points — healthy bullish follow-through.
Upper Wick: ≈ 11 points — minimal rejection near highs.
Lower Wick: ≈ 33 points — buyers absorbed early selling pressure.
📚 Interpretation
The candle is strongly bullish, reinforcing the strength seen in the previous session’s recovery. The healthy body size and the close near the day’s high with minimal upper wick suggests bulls maintained control and are positioned for a continuation move. This structure invalidates the short-term bearish arguments and confirms the upward trend.
🕯 Candle Type
Bullish Continuation Candle — Indicates buyers maintaining momentum; trend strength remains intact.
🛡 5 Min Intraday Chart
⚔️ Gladiator Strategy Update
ATR: 203.87
IB Range: 75.30 → Medium
Market Structure: ImBalanced
Trade Highlights:
10:26 Short Trade - SL Hit (IBL Breakout)
14:08 Long Trade - SL Hit (IBH Breakout)
Trade Summary: The tight, volatile, and range-bound nature of the session, coupled with multiple fakeouts, created a difficult environment for the strategy, resulting in two stop-loss hits. The market lacked clear directional follow-through after the initial sharp reversal.
🧱 Support & Resistance Levels
Resistance Zones:
26070
26104 (Next Major Hurdle)
26155
Support Zones:
25985
25930 ~ 25920 (Polarity Flip Support)
25890
🧠 Final Thoughts
“The 26104 gate awaits the bulls.”
The strong close above 26030 successfully converts this level into immediate support. The immediate support zone is now 25920 ~ 25930, which was the major resistance just yesterday—a perfect polarity flip. The key focus for the next session is the 26104 resistance. A decisive move above this level will maintain bullish momentum and target 26155.
✏️ Disclaimer
This is just my personal viewpoint. Always consult your financial advisor before taking any action.

Nifty Analysis EOD – December 11, 2025 – Thursday🟢 Nifty Analysis EOD – December 11, 2025 – Thursday 🔴
Bulls Recapture Lost Ground: Strong Recovery Confirms Demand at 25700 Base.
🗞 Nifty Summary
Despite early indications from Gift Nifty suggesting a large Gap Up, the Nifty only opened up 27 points. It immediately filled the gap, testing the 25800 level, and sharply faced rejection, falling below 25700 to mark a low at 25,693.25.
This aggressive dip served to trap bears before a powerful V-shaped recovery began. Buyers stepped in decisively at the 25715 ~ 25740 support, breaching the Day High and testing 25840, and gradually reaching 25900.
Multiple attempts to conquer the strong overhead resistance zone of 25920 ~ 25930 failed, but the Nifty successfully closed near the day’s high at 25,898.55. This strong bullish close recaptures the ground lost yesterday and shows a decisive change in short-term sentiment.
🛡 5 Min Intraday Chart with Levels
🛡 Intraday Walk
The day started with a crucial test: the early breakdown below the PDL was swiftly negated by strong buyer defense at the 25700 level.
This V-shaped recovery confirms the conviction of the bulls at the key support base. The remainder of the session was a sustained, steady grind upward.
The most significant takeaway is the successful close near the PDH, signaling strong momentum.
However, the consistent rejection at 25920 ~ 25930 confirms this remains the most immediate and difficult overhead supply zone.
📉 Daily Time Frame Chart with Intraday Levels
🕯 Daily Candle Breakdown
Open: 25,771.40
High: 25,922.80
Low: 25,693.25
Close: 25,898.55
Change: +140.55 (+0.55%)
🏗️ Structure Breakdown
Type: Bullish candle with a strong lower wick.
Range (High–Low): ≈ 230 points — high intraday activity.
Body: ≈ 24 points — minor profit booking near highs.
Upper Wick: ≈ 83.6 points — strong rejection near the day’s high
Lower Wick: ≈ 78 points — decisive buying from lower levels, forming a long lower shadow.
📚 Interpretation
The candle is strongly bullish, demonstrating that despite the sharp early volatility, demand aggressively absorbed the selling pressure. The strong body and close near the high signals that bulls have regained control of the short-term trend. The long lower wick suggests the low of the day served as a successful bear trap, and the rally has strong underlying support.
🕯 Candle Type
Bullish Candle with Strong Lower-Wick Support — Indicates demand dominance and potential continuation if follow-up buying appears.
🛡 5 Min Intraday Chart
⚔️ Gladiator Strategy Update
ATR: 203.87
IB Range: 109.80 → Medium
Market Structure: Balanced
Trade Highlights:
11:17 Long Trade - Target Hit (R:R 1:2.15) (IBH Breakout + Vwap & Trendline support)
13:07 Short Trade - SL Hit (Contra Trade : Trendline Breakout)
Trade Summary: The volatile reversal day provided mixed results. The strategy successfully captured the core bullish trend with a high R:R long trade following the confirmed recovery, but the attempt to catch the trendline failure later in the day resulted in a stop-loss hit.
🧱 Support & Resistance Levels
Resistance Zones:
25930 ~ 25920 (Immediate Polarity Flip Resistance)
25985
26030
Support Zones:
25740 ~ 25715 (Critical Immediate Base Support)
🧠 Final Thoughts
“The 25920 zone is the key to unlocking the next 26,000 target.”
The bulls successfully reclaimed the ground lost yesterday, and the 25715 ~ 25740 support is now confirmed as a strong base. The immediate challenge for tomorrow is the 25920 ~ 25930 resistance. If this is broken and held, a short covering rally could quickly trigger toward 26030 and potentially 26104. A break and sustain above 26104 would be a very strong signal for a broader reversal.
✏️ Disclaimer
This is just my personal viewpoint. Always consult your financial advisor before taking any action.


Long trade 🟢 FLOKIUSDT — Institutional Buyside Expansion Setup (1H)
Market: FLOKIUSDT Perpetual
Timeframe: 1H
Session: Tokyo PM → London → NY
5.00 pm
Model: AMD (Accumulation → Manipulation → Distribution)
📌 TRADE DETAILS
Type: Buyside Trade
Entry: 0.00004768
Stop: 0.00004719 (-1.03%)
Target: 0.00005290 (+10.94%)
Risk–Reward: 10.65R
🧱 1. STRUCTURAL CONTEXT
Price is trading inside a high-confluence discount zone formed after a completed bearish leg.
Multiple sell-side liquidity sweeps occurred below 0.000045, followed by structural stabilisation and BOS.
Key observations:
HTF downtrend paused
Sell-side liquidity fully engineered
Price re-accepted above key discount
Structure transitioned from distribution → re-accumulation
🔁 2. AMD MODEL APPLICATION
A-Leg (Accumulation):
Repeated liquidity sweeps below prior lows with diminishing downside follow-through.
M-Leg (Manipulation):
Final spring below demand during low-liquidity session, confirmed by volume expansion.
D-Leg (Distribution / Expansion):
Clean BOS + FVG formation → controlled pullback → expansion leg initiated.
This trade executes inside the early D-Leg.
📊 3. VOLUME SPREAD ANALYSIS (VSA)
Stopping volume visible at the lows
Wide-spread down bars closing off the lows → absorption
Subsequent rallies occurred on lower relative volume (supply exhaustion)
No-supply tests confirmed inside demand
✔ VSA supports a markup phase, not continuation lower.
🧠 4. FOOTPRINT & DELTA CONFIRMATION
Repeated green delta clusters at the entry zone
Buyers absorbing offers on each pullback
No stacked red delta at highs (no distribution signal)
Delta expansion aligned with BOS
✔ Flow confirms buyside dominance, not retail chasing.
📐 5. FIBONACCI ANCHORING
Anchors: High → First BOS Down → Swing Low
Confluence:
Entry aligned with 0.382–0.5 retracement
Expansion targets align with 1.0 → 1.272 extensions
Target 0.00005290 sits inside premium liquidity
🧭 6. SESSION LOGIC
Tokyo: Accumulation + liquidity build
London: Manipulation & BOS
New York: Expansion & delivery.

Bullish but not chasing the rally, will it test 4380 again?#XAUUSD TVC:GOLD OANDA:XAUUSD
With a series of positive news recently, the market remains bullish in the short term. Judging from the Asian session, gold prices have been fluctuating at high levels. In the short term, they may test the resistance level of 4290-4300. We are bullish but will not chase the rise. Our trading strategy is still to buy on dips.
Short-term support is seen at 4260-4250. If the price retraces to this support level and holds, a small long position in gold can be considered. The key support level to watch remains unchanged at 4235-4225.

12th Dec |LIVE TRADE| Pullback Entry Advanced Price ActionThis is a live trade video from start to finish.
1:4/5 Risk to Reward.
Yesterday’s analysis played out and today I took an advanced pullback entry — without waiting for a candlestick confirmation.
The decision was based purely on price behaviour, structure and how the pullback was forming.
In this video I’ve shared:
How I read pullbacks without candle confirmation
Live price action psychology while the trade was running
Real confusion, hesitation, and emotional control during the trade
Why I decided to hold and where most traders panic
How the target eventually played out
The difference between knowing price action and trusting it in real time
This isn’t a perfect trade video.
It’s a real trader’s mindset inside a running position —> thoughts, doubts, patience, and execution.
No indicators.
No hindsight.
Just live price action, live emotions, and real decision-making.
Sharing this purely for learning and transparency.

GC daily trade plan for Dec 12Gold broke out of Daily consolidation range and closed above it as well as above previous Weekly high. This morning PWH held and might send price higher towards ATH.
I will be looking to buy gold today.

GOLD (XAU/USD): Strong Bullish Signal📈Gold has been in a significant consolidation phase since October, with the market remaining within a broad horizontal range on a daily chart.
Given the recent bullish movement, Gold now appears to be strongly bullish.
A breakout above the resistance level of this range suggests the completion of a bullish accumulation period.
This development opens up the potential for further growth.
The next resistance level to observe is 4,300.

EUR/JPY: More Growth Ahead!The 📈EURJPY pair successfully breached a notable daily/intraday resistance cluster, confirming a bullish Break of Structure.
Today, we are observing a retest of the previously broken structure, accompanied by subsequent consolidation.
A bullish violation of its intraday resistance would provide further indication of upward momentum.
I anticipate that the pair will continue to ascend and reach the 183.20 level in the near future.

CADJPY: Trend Continuation
Daily TF indicates continued uptrend after two weak bearish bars
Price on H1 TF is crossing above descending trend line (DTL)
Price above EMA60 also indicates relatively stronger upside potential

Dax to the upside!Hi
on the 4h TF. Dax bounced strongly from the bottom to break a critical resistance level then went to the next resistance then broke through it to the upside and even bounced up from after it settled on with a pin bar 4H candle and that is the big view of the DAX based on the 4H TF.
3 TPs are there, however, if you accept and tolerate the bearish pullbacks on the journey to TP3, as long the last support level or (the above line) will not be broken by a 4H candle (closing price not by a wick) then TP3 will be your main and real target on DAX.
Fundamentally the next week will offer the Fed interest rate decision which has strong expectations of another rate cut! and may we see currently the preparation on the chart for that move!
Note:
Please do not share or copy my own work! It reflects my own vision and view to that index and it is advertised to not be taken as a legal advice for traders to follow, however, it is not more than an own opinion and analysis to be shared with you!
Good luck ;)

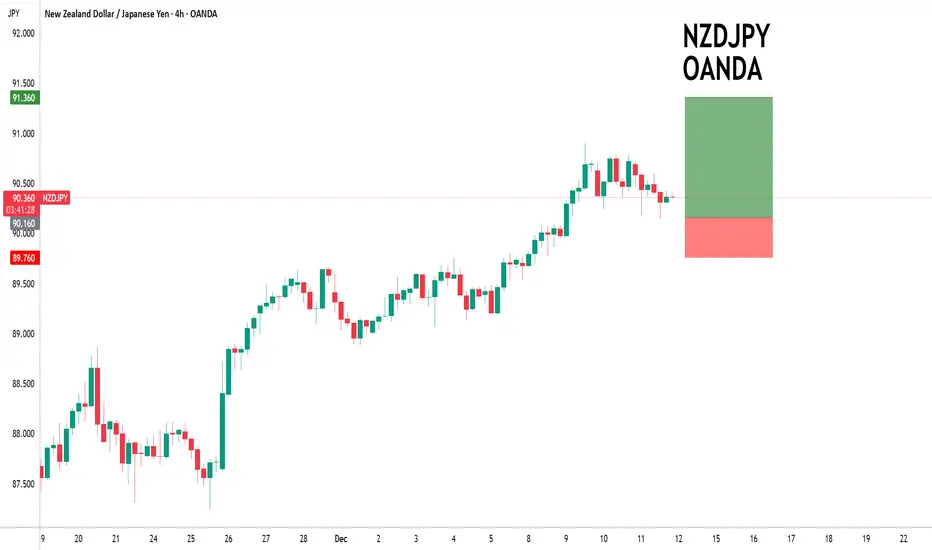
NZDJPY to continue in the upward move?NZDJPY - 24h expiry
Our short term bias remains positive.
There is no clear indication that the upward move is coming to an end.
Offers ample risk/reward to buy at the market.
The sequence for trading is higher highs and lows.
Daily signals are bullish.
We look to Buy at 90.16 (stop at 89.76)
Our profit targets will be 91.36 and 91.56
Resistance: 90.90 / 91.50 / 92.00
Support: 90.14 / 89.50 / 88.88
Risk Disclaimer
The trade ideas beyond this page are for informational purposes only and do not constitute investment advice or a solicitation to trade. This information is provided by Signal Centre, a third-party unaffiliated with OANDA, and is intended for general circulation only. OANDA does not guarantee the accuracy of this information and assumes no responsibilities for the information provided by the third party. The information does not take into account the specific investment objectives, financial situation, or particular needs of any particular person. You should take into account your specific investment objectives, financial situation, and particular needs before making a commitment to trade, including seeking, under a separate engagement, as you deem fit.
You accept that you assume all risks in independently viewing the contents and selecting a chosen strategy.
Where the research is distributed in Singapore to a person who is not an Accredited Investor, Expert Investor or an Institutional Investor, Oanda Asia Pacific Pte Ltd (“OAP“) accepts legal responsibility for the contents of the report to such persons only to the extent required by law. Singapore customers should contact OAP at 6579 8289 for matters arising from, or in connection with, the information/research distributed.
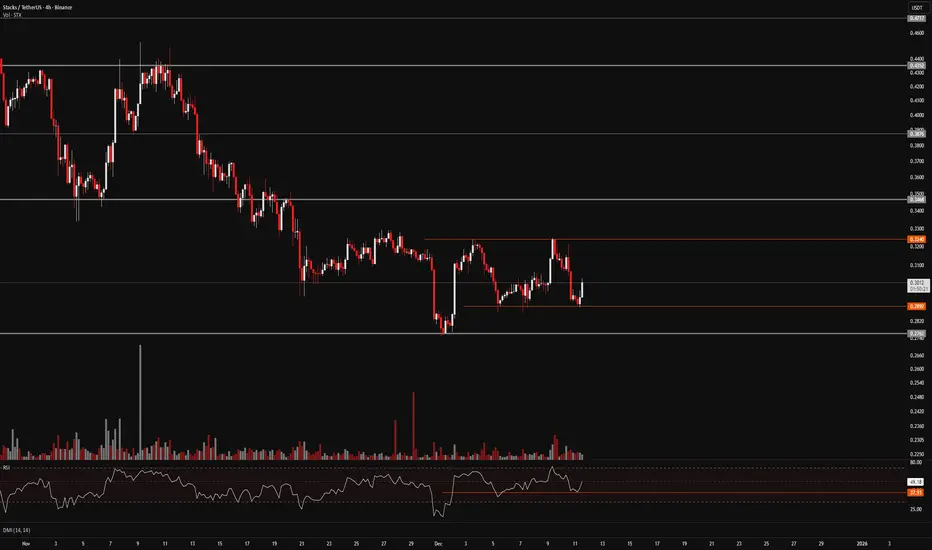
FireHoseReel | STX Breakout Loading at Key Levels🔥 Welcome To FireHoseReel !
Let’s jump into Stacks (STX) market analysis.
🪙 Stacks (rank #88) powers Bitcoin smart contracts, letting users build DeFi, NFTs, and apps on BTC with security anchored to the Bitcoin chain.
👀 STX 4H Overview
STX is in a clear downtrend on the monthly, weekly, and daily charts. On the 4H timeframe, it has formed a small consolidation zone. A breakout in either direction can create a tradable setup from this consolidation.
📊 Volume Analysis
Stacks is currently showing significant volume decline, and the last volume spike leaned toward selling pressure. A breakout through the orange pre-breakout zones could trigger a notable increase in volume.
✍️ STX Trading Scenarios
🟢 Long Scenario:
A breakout above $0.324 with rising buy volume creates a pre-breakout setup targeting the $0.346 resistance—suitable for a risky long entry.
🔴 Short Scenario:
Losing the $0.2899 support with increasing sell volume—especially if RSI dips into oversold—could act as a pre-breakout signal for a deeper move toward $0.2762.
🧠 Protect your capital first. No setup is worth blowing your account. If risk isn’t controlled, profit means nothing. Trade with rules, not emotions.
FireHoseReel | BNB Daily Analysis #19🔥 Welcome To FireHoseReel !
Let’s dive into BinanceCoin (BNB) analysis.
👀 BNB 4H Overview
BNB is currently moving inside a consolidation box on the 4H timeframe, with volume steadily decreasing inside this range. A breakout from either the top or bottom of the box could trigger a strong move. Price is now approaching the key resistance at $915.
📊 Volume Analysis
Price pushed into resistance with a clear volume divergence, and after sellers stepped in with increased selling volume, BNB was rejected downward. If selling volume continues to rise, the newly-formed support zone may break, allowing price to move lower.
✍️ BNB Trading Scenarios
🟢 Long Scenario 1:
A breakout above $915 with strong buying volume and a volatility-range break above 61.63 can provide a solid long setup.
🔴 Short Scenario:
A breakdown of the newly-formed multi-timeframe support at $864, confirmed by increasing selling volume, can create a valid short opportunity.
🧠 Protect your capital first. No setup is worth blowing your account. If risk isn’t controlled, profit means nothing. Trade with rules, not emotions.

Long trade
🟩 Buy-Side-trade
Buy-side Trade
Pair: AUDNZD
Date: Thu 4th Dec 2025
Time: 2:00 am (NY Time)
Session: Tokyo Session AM
📘 Trade Details
Entry: 1.14615
Profit Level: 1.15475 (+0.75%)
Stop Level: 1.14483 (–0.12%)
Risk–Reward (RR): 6.52
📗 Model / Structure (ICT / SMC)
Market Structure Shift (MSS) → bullish BOS
Price trades into discount retracement zone
FVG (Fair Value Gap) inside mitigation zone
Imbalance fill → rejection → bullish displacement
EMA/WMA alignment confirms directional trend
📙 Liquidity Story
Swept liquidity beneath prior swing low (red marker)
Inducement engineered below 1.14300
We assume price is now delivering into inefficiency above 1.15000
Liquidity magnets aligning with:
1.15200 micro-high
1.15500 extension
0.50 & 0.75 fib levels align with higher-timeframe targets
📕 Sentiment / Narrative
AUD strengthening from commodity sentiment
NZD losing footing on macro softness
Tokyo Session → bullish continuation characteristics
Multi-session volatility expansion supports upward delivery
📒 Outcome / Expectations
We assume expansion towards 1.15400–1.15600
Clean inefficiency above → strong draw-on-liquidity
Stop placed under structural pivot protected by OB
Clear upside space for continuation to weekly premium zone

Long trade
🟩 Buy-Side trade
Pair: NVDA
Date: Mon 1st Dec 2025
Time: 12:30 pm
Session: NY Session PM
Entry: 180.25
TP: 195.71 (8.57%)
SL: 178.54 (0.949%)
RR: 9.04
🟦 STRUCTURE
NVDA formed a bullish MSS → BOS on the 1H
Price retraced into discount (0.618 fib region)
Strong displacement candle confirmed the long bias
FVG inside retracement zone provided algorithmic entry logic
Target aligns with HTF premium zone around 195–200
🟨 LIQUIDITY
Sweep of sell-side liquidity beneath 178.50–179.00
Inducement engineered before bullish expansion
Upside liquidity magnets:
187.80 (0.382 retracement)
195.70 HTF equilibrium level
Gap above → likely draw-on-liquidity
Large volume cluster supports bullish continuation
🟧 SENTIMENT
NVDA remains fundamentally bid due to AI/semiconductor strength
Broader tech sector showing rotation back into high-beta names
NY PM session typically generates continuation moves
Market repricing risk-on after morning volatility clearance

Long trade
🟦 TAB 1 — TRADE DETAILS
Pair: FLOKIUSDT
Direction: 🟩 Buy-side
Entry: 0.00004531
Take Profit: 0.00005294 (+16.84%)
Stop Loss: 0.00004475 (-1.23%)
Risk–Reward: 13.62R
Session: NY PM
2️⃣ TAB 2 — AMD MODEL (
A-Leg — Accumulation
Sell-side liquidity taken at 0.0000417
Volume climax + stopping action
Session accumulation across Tokyo → London
M-Leg — Manipulation
Sharp wick into deep discount
Re-test FVG at 0.00004520
Footprint absorption confirms the manipulation phase
D-Leg — Distribution / Expansion
Now active:
7️⃣ TAB 7 — VOLUME SPREAD ANALYSIS (VSA)
High-volume stopping bars at lows
No-supply tests before breakout
Rising volume on BOS
Falling volume on pullback = re-accumulation
1️⃣7️⃣ TAB 17 — MACRO REGIME CONFIRMATION
US indices recovering
BTC risk-on
ETH strength increasing
Liquidity rotation into meme assets
Volatility compression → expected breakout
1️⃣8️⃣ TAB 18 — BUBBLES VOLUME (DELTA PRO)
Current Bubble Read:
Large green delta clusters during retest
No major red bubbles capping highs
Increasing positive delta during markup
Volume-normalised bubble expansion → acceleration phase
This confirms continuation, not distribution.
Bullish Flow = Intact
Smart Money = Still buying dips
Next Delta Burst Expectation = 0.000049–0.000050

S&P500 INDEX (US500): Bullish Move After Trap
I see a confirmed liquidity grab after a test of a major
intraday demand zone on US500.
An occurrence of a buying imbalance afterward
suggests a strong bullish pressure.
I expect a rise at least to 6875
❤️Please, support my work with like, thank you!❤️
I am part of Trade Nation's Influencer program and receive a monthly fee for using their TradingView charts in my analysis.


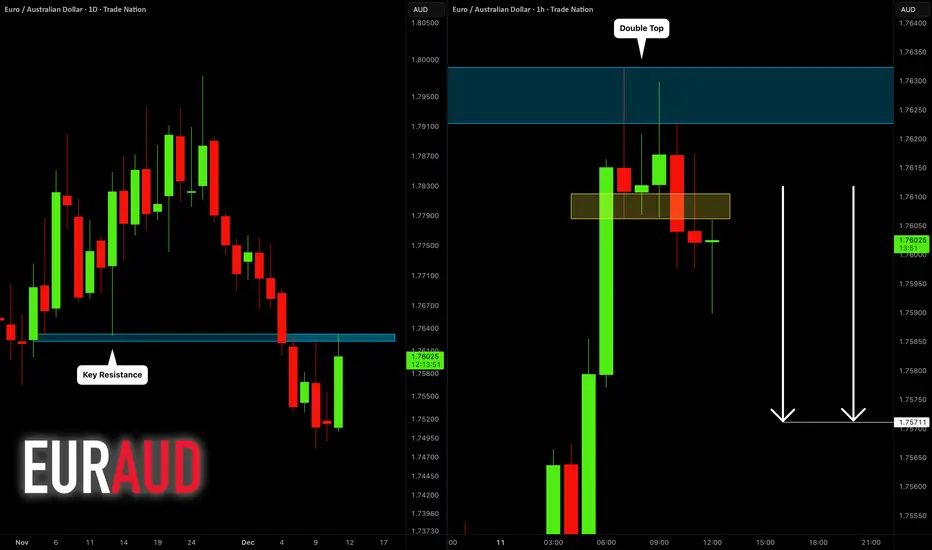
EURAUD: Bearish Move From Key Level 🇪🇺🇦🇺
EURAUD will most likely drop from a key daily resistance level.
I opened my short position on a retest of a broken neckline of
a double top pattern on an hourly.
Goal - 1.7571
❤️Please, support my work with like, thank you!❤️
I am part of Trade Nation's Influencer program and receive a monthly fee for using their TradingView charts in my analysis.
ETH Long-Term Ultra Bullish Outlook | Smart Money Zones TradeWithMky Analysis — Weekly Timeframe
Ethereum continues to respect major Smart Money levels, forming a broader accumulation structure inside a high-value demand zone. Price has tapped into the deeper support region where institutional long orders historically activate. As long as ETH holds above these Smart Supports, the long-term structure remains bullish.
A liquidity sweep and deeper retracement toward the $2.4k–$2.1k Smart Support zone could create the perfect Miracle Shot entry, aligning with my strategy’s rule of waiting for exhaustion + re-accumulation before the impulsive leg.
If price respects this zone, the next major target sits at the Smart Resistance around $4,700, which also aligns with a potential long-term breakout and continuation into an ultra-bullish expansion phase.
Key Zones:
Smart Supports: $2,162 – $1,799 – $1,517
Long Accumulation Zone: $2,400 – $2,700
Major Breakout Target: $4,772
This chart outlines a clean roadmap for a future bullish rally, with high-probability long opportunities if price retraces into the smart-money demand zones.
Stay patient. Wait for the setup.
The Miracle Shot always comes to those who wait.

Gold – Potential Choppy Price Action AheadThe market got what it wanted from the Federal Reserve last night when a widely anticipated interest rate cut of 25bps (0.25%) was announced, a move which as a rule is positive for Gold prices as it is an asset that doesn’t bear any interest itself. Initially this was the case, with the popular metal trading from opening levels at 4210 before the Fed decision on Wednesday up to a one week high of 4248 early this morning. However, that is where the positive story ended and Gold prices have since traded back down to 4210 again at the time of writing (0700 GMT).
On a longer-term basis, the drivers underpinning prices still seem to remain in place, namely central bank buying dips, concerns over swelling government debt and an uncertain geopolitical outlook, but in the short-term Gold prices could be at the mercy of general risk sentiment, which is wavering after a disappointing Q3 earnings release from Oracle overnight, and positioning readjustment. This situation isn’t helped by the reality that there is little in the way of scheduled risk events for traders to focus on until the release of US Non-farm Payrolls next Tuesday, December 16th (1330 GMT) and the interest rate decisions from the Bank of England, European Central Bank (December 18th) and Bank of Japan (December 19th).
This backdrop could suggest potential for some choppy price action ahead which may require traders to keep monitoring important support and resistance levels that could impact the direction of Gold moving forward.
Gold Technical Update: Watching the 4245/4265 Resistance Band
Since posting the 4381 October 20th high and 3887 October 28th low, Gold has entered a more balanced phase of sideways trading between these extremes. The over‑extended upside price conditions seen after the recent sharp acceleration higher are currently being unwound by this activity.
This current balance between buyers and sellers is evident in the chart below, but it also highlights that no successful closing breakout has yet materialised in price.
Gold’s initial response to the Fed interest rate cut and subsequent press conference yesterday was more positive, with fresh price strength emerging. However, there is still no evidence of a successful breakout to the topside on a closing basis.
As such, maintaining an awareness of both key support and resistance levels could be important in gauging whether the recent sideways trading range is nearing an end.
Possible Resistance Levels:
As the chart below highlights, there is a combination of potential resistance levels situated just above current price activity. This zone reflects both the downtrend line connecting price highs back to October 20th, which sits at 4245 and the December 1st high at 4265. Having previously marked areas where selling pressure has emerged, traders may now be focused on how this resistance band is defended on a closing basis.
Closing breaks above 4245/4265 could lead to a fresh phase of price strength, marking an upside break in Gold from its sideways activity. While not a guarantee of sustained gains, such a move could open potential to challenge the 4381 October 20th extreme and possibly extend further if that level also gives way on a closing basis.
Potential Support Levels:
For now, the 4245/4265 resistance band remains intact. While this area continues to cap attempts at price strength on a closing basis, risks may shift toward the downside, bringing the Bollinger mid‑average at 4155 into play as a potential support level to monitor.
Closing breaks below this support at 4155, if seen, could suggest scope for continued declines toward 3998, the November 18th low. If this level also gave way, it may open the path toward 3887, the October 28th downside extreme.
The material provided here has not been prepared accordance with legal requirements designed to promote the independence of investment research and as such is considered to be a marketing communication. Whilst it is not subject to any prohibition on dealing ahead of the dissemination of investment research, we will not seek to take any advantage before providing it to our clients.
Pepperstone doesn’t represent that the material provided here is accurate, current or complete, and therefore shouldn’t be relied upon as such. The information, whether from a third party or not, isn’t to be considered as a recommendation; or an offer to buy or sell; or the solicitation of an offer to buy or sell any security, financial product or instrument; or to participate in any particular trading strategy. It does not take into account readers’ financial situation or investment objectives. We advise any readers of this content to seek their own advice. Without the approval of Pepperstone, reproduction or redistribution of this information isn’t permitted.
