AUDJPYFirst Intraday of the week. liq sweep, market structure shift, retracement to OB and Imb.
I told you all I'll be interested in sells on this pair throughout this week because price is in Supply zone.
Manage risk well
Candlestick Analysis

As long as the trend support holds, the outlook remains bullish#XAUUSD OANDA:XAUUSD TVC:GOLD
Looking at the intraday trend, the overall volatility was very limited, but it did not break the upward trend line. The short-term support level to watch is 4200-4185. If the price does not break through the support level on the first pullback, we can continue to consider going long on gold. Pay attention to the short-term resistance level at 4235-4245.

CAD/CHFContinuous Bullish Bias. Buy POI's= OB + unswept liq / imb + liq to be swept.
Manage risk well.

APD, gap closing, RSI buildingAPD has nearly closed its gap at $241. If the RSI can maintain a positive divergence and a new upward momentum this could be a bullish indicator.

Understanding Market Structure: Is My Read Valid? EURUSD I’ve been working on improving the way I read market structure and I want to make sure the thought process I’m developing actually makes sense. From what I’m seeing, price has been respecting a series of higher lows, so I’m treating the trendline as part of the overall bullish structure. When price broke above a key resistance level and later came back into that same area, I interpreted that as a potential S/R flip and built a demand zone around it, especially since it lines up with the trendline and the origin of the last impulsive move. My current understanding is that if buyers are still in control, this is the logical area where they would defend the trend. I also marked the swing low sitting just below this zone as the point where a break and close would signal a change of character and invalidate the uptrend altogether. On the other side, I identified a previous minor high that price would need to break with real displacement for the continuation to be confirmed, because without that break I assume we’re still technically consolidating. Above that, I highlighted the buy-side liquidity that price may reach for if the bullish structure holds. I’ve also been trying to refine how I treat FVGs, since the market creates so many of them. Right now I only consider an FVG relevant if it forms with displacement, is tied to a structural break, hasn’t been rebalanced, and still sits within the context of a valid trend. If structure breaks or the gap gets filled, I stop tracking it. Altogether I’m just trying to combine trend structure, S/R flips, liquidity, displacement, and FVG logic into one clearer framework, but I’m still learning and don’t want to assume I’m interpreting everything correctly. Any feedback or refinement from more experienced traders would be appreciated.

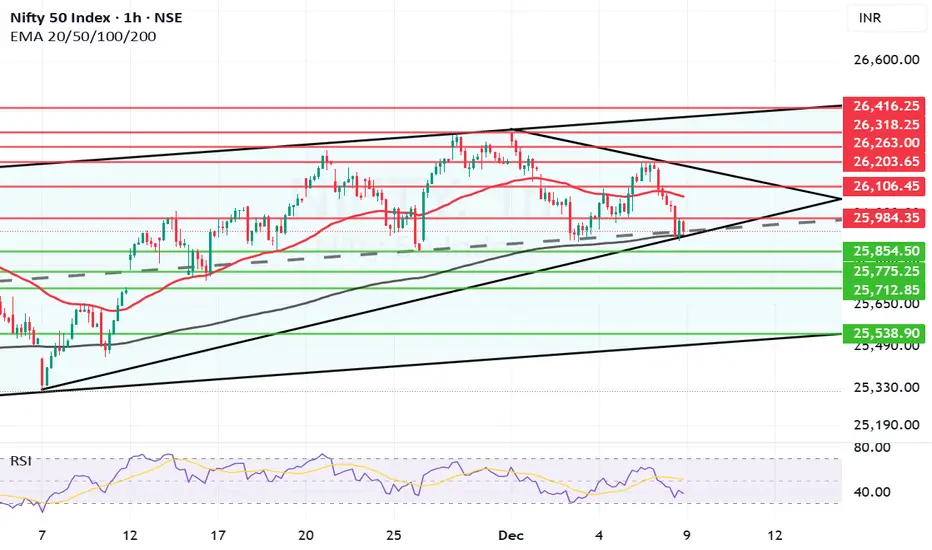
Nifty near father line support on hourly chart.After the drubbing today at browsers where Nifty ended 225.9 points below previous close has closed at 25960. Below the comfort level of 26K. The sell of was global today due to US FED meet later tonight.
Supports for Nifty are at 25915 (Major Father line support). If this support is broken Nifty will become weak and can further plummet towards 25854, 25775 or even 25712. The channel bottom support for Nifty will be near 25538.
Resistances for Nifty are at 25984, 26066 (Mother line resistance), 26203, 26263, 26318 and finally channel top resistance is near 26416.
Shadow of the candle is looking neutral despite the fall today. If the father line support at 25915 is not broken we can see a swift recovery in Nifty.
Disclaimer: The above information is provided for educational purpose, analysis and paper trading only. Please don't treat this as a buy or sell recommendation for the stock or index. The Techno-Funda analysis is based on data that is more than 3 months old. Supports and Resistances are determined by historic past peaks and Valley in the chart. Many other indicators and patterns like EMA, RSI, MACD, Volumes, Fibonacci, parallel channel etc. use historic data which is 3 months or older cyclical points. There is no guarantee they will work in future as markets are highly volatile and swings in prices are also due to macro and micro factors based on actions taken by the company as well as region and global events. Equity investment is subject to risks. I or my clients or family members might have positions in the stocks that we mention in our educational posts. We will not be responsible for any Profit or loss that may occur due to any financial decision taken based on any data provided in this message. Do consult your investment advisor before taking any financial decisions. Stop losses should be an important part of any investment in equity.
USDCHFCurrently bullish Overall. Price have broken the trend line supporting sells. Retracement from the market POI to the breaker should push price higher.
I'll be taking a short term risky sells at that POI now. Manage risk

Nifty Analysis EOD – December 8, 2025 – Monday🟢 Nifty Analysis EOD – December 8, 2025 – Monday 🔴
Bears Launch Aggressive Counter: All Gains from the Previous 3 Sessions Wiped Out.
🗞 Nifty Summary
The Nifty started flat to negative, quickly breaching the 26104 support and establishing the Initial Balance (IB) range between 26070 ~ 26104.
The market action was clearly controlled by sellers, leading to a massive 100+ point plunge around 1 PM. This sharp fall broke the PDL and tested the important structural support of 25920 ~ 25930.
The market was completely dominated by bears, resulting in a dramatic wipeout of all gains accumulated from the preceding Thursday, Friday, and Wednesday sessions. Nifty closed at 25,960.55, significantly below the psychological 26K level and below the close of the last eight consecutive sessions.
The day ended with an 80-point recovery attempt from the low, which was rejected by the PDL, pushing the index back toward 25920.
🛡 5 Min Intraday Chart with Levels
🛡 Intraday Walk
The initial breakdown below 26104 was a strong signal, indicating that the buyers lacked the conviction seen last week. The range-bound nature of the first half (within the IB Range) was deceptive; the sharp 1 PM drop confirmed the underlying seller dominance.
The ability of the bears to hold the market down and close it below the PDL, despite the 80-point recovery attempt from the day’s low, is a major bearish technical achievement. The market is now testing the base formed back on Wednesday’s low.
📉 Daily Time Frame Chart with Intraday Levels
🕯 Daily Candle Breakdown
Open: 26,159.80
High: 26,178.70
Low: 25,892.25
Close: 25,960.55
Change: −225.90 (−0.86%)
🏗️ Structure Breakdown
Type: Strong Bearish candle (Bearish Engulfing pattern).
Range (High–Low): ≈ 286 points — very high volatility.
Body: ≈ 199 points — reflecting powerful, clear downside pressure.
Upper Wick: ≈ 19 points — buyers attempted a mild push above the open but were immediately rejected.
Lower Wick: ≈ 68 points — some late buying emerged near the bottom (25900 zone).
📚 Interpretation
This is a definitive bearish candle. The long real body and the massive range expansion (engulfing multiple prior sessions) signal a major shift in short-term sentiment. The failure of the small early recovery attempt confirms seller dominance. The close below the PDL puts the market in a precarious position, although the lower wick shows buyers are attempting to defend the 25900 zone.
🕯 Candle Type
Strong Bearish Candle with Lower-Wick Support Attempt — Shows heavy selling pressure and requires strong bullish follow-up to prevent continuation.
🛡 5 Min Intraday Chart
⚔️ Gladiator Strategy Update
ATR: 202.85
IB Range: 101.10 → Medium
Market Structure: Balanced
Trade Highlights:
10:58 Short Trade - Target Hit (R:R 1:5.51) (IBL + Symetrical Traiangle Breakout)
Trade Summary: The strategy successfully identified the directional breakdown below the Initial Balance Low (IBL) and the subsequent move, capturing an outstanding high R:R short trade that maximized profit from the day’s dominant bearish trend.
🧱 Support & Resistance Levels
Resistance Zones:
25985
26030
26070
26104 (Previous Key Support)
Support Zones:
25930 ~ 25920 (Immediate Base)
25860 ~ 25840
25740 ~ 25715
🧠 Final Thoughts
“The fight is now at the 25900 base.”
The bearish engulfing candle has confirmed the start of a deep retracement. The critical battleground for Tuesday is the 25930 ~ 25920 zone.
If bears breach and sustain below this support, we are likely heading for the next major support zone at 25860 ~ 25840. Only a decisive reclamation and close above 26030 can negate the current bearish short-term structure.
✏️ Disclaimer
This is just my personal viewpoint. Always consult your financial advisor before taking any action.

CADJPY: Bullish Continuation Ahead 🇨🇦🇯🇵
There is a high probability that CADJPY will continue
rising after a confirmed breakout of a key daily/intraday
horizontal resistance cluster.
Next goal - 112.88
❤️Please, support my work with like, thank you!❤️
I am part of Trade Nation's Influencer program and receive a monthly fee for using their TradingView charts in my analysis.

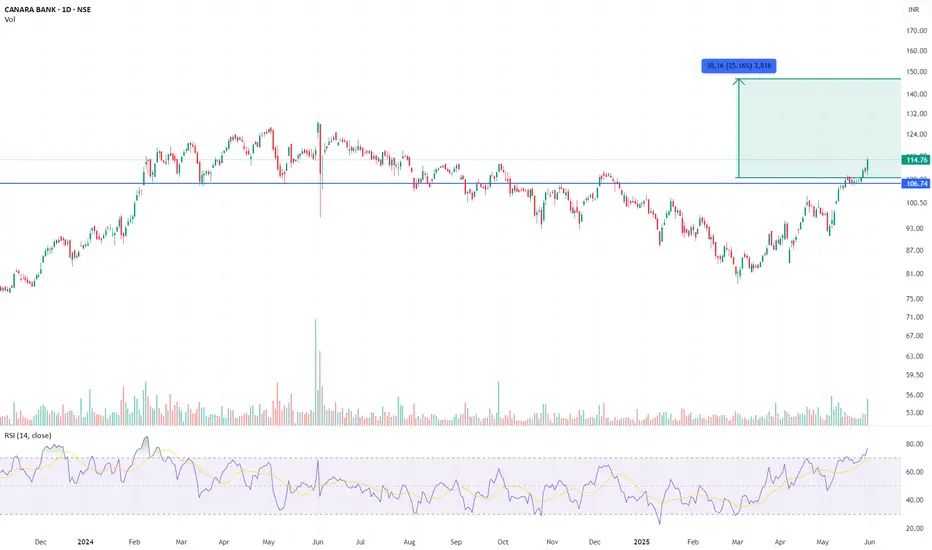
Canara Bank – Breakout With Retest, Momentum BuildingBullish | Timeframe: 1Y | Type: Positional Swing
Chart Setup:
Canara Bank has broken out of a 15-month consolidation zone above the ₹112–₹114 resistance, which acted as a neckline. Price rallied sharply from the ₹85 base, and the breakout was supported by strong volumes and momentum.
The most recent candle shows a shallow retest, with an intraday dip to ₹109 followed by a strong close above the breakout zone — classic confirmation of support holding.
Measured Move Target: ₹150–₹160
Invalidation / Stop Loss: Close below ₹108
Rationale:
Strong price-volume structure
Retest of breakout zone successful
PSU banking theme in favour
Momentum intact above all major moving averages
Disclaimer:
This idea is purely for educational purposes and reflects a technical setup based on chart patterns and price action. It is not a recommendation to buy or sell securities. PSU banks can be volatile and sensitive to macro/policy triggers. Traders should manage risk independently, use stop-loss, and size positions based on personal risk tolerance. Always do your own due diligence before taking any trade.
CHFJPY Forex-cross pair demand levelWaiting fot CHFJPY Forex-cross pair to reach the daily demand level the same way other JPY forex cross-pairs have done, or new imbalances. Waiting for now.

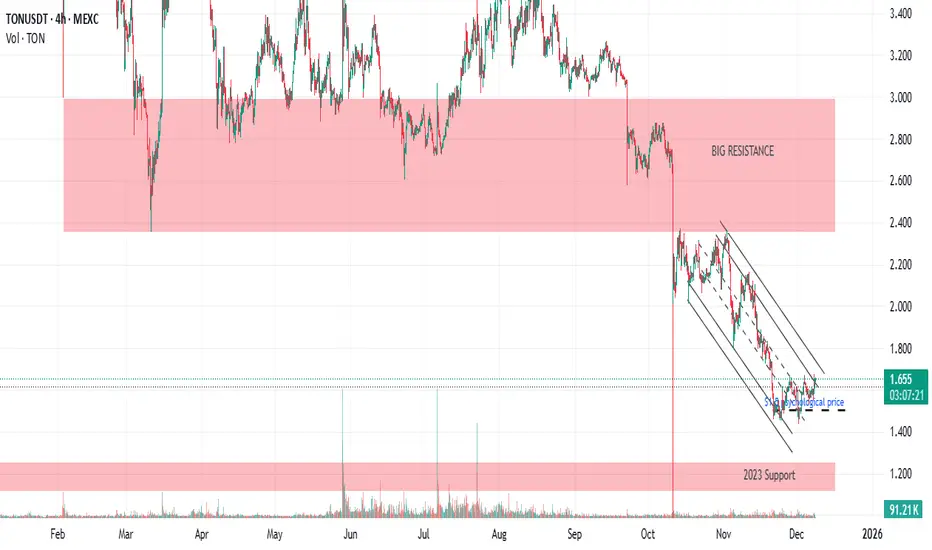
TONCOIN heads towards major resistance at $3After the decline that occurred on 10/10, MEXC:TONUSDT closed the wick candle with a very neat trendline.
Will it break the trendline and try to rise to $3 resistance?
$1.5 would be the psychological price
Gold (XAU/USD) – Breakdown & Two Clear ScenariosGold recently moved inside a defined price range between 4260–4160, even forming a bullish triangle pattern, suggesting indecision with a slight bias upward. During today’s session, price has broken below the Previous Day Low (PDL), which now acts as short-term resistance.
From here, we can play two likely scenarios:
📈 Bullish Scenario
If gold reclaims and breaks above the PDL, we may see price retrace toward the Previous Day High (PDH).
Upside potential lies near ~4240, with buyers regaining control.
📉 Bearish Scenario
If the PDL remains as strong resistance and price rejects it, a throwback could lead gold to test liquidity near the 4100 zone.
This area also coincides with the midline of the bullish channel, making it a key support zone for potential buys.
🌐 Fundamental Context
According to Reuters, recent weeks have seen a weakening USD and high market expectations of a Fed rate cut in December, which supports gold as a non-yielding asset.
However, stronger-than-expected U.S. employment data and rising Treasury yields have created periodic pullbacks, showing short-term pressure.
Safe-haven demand remains a factor due to ongoing geopolitical tensions and global economic uncertainty, further boosting gold’s medium-term bullish story.
OANDA:XAUUSD

FireHoseReel | BNB Daily Analysis #19🔥 Welcome To FireHoseReel !
Let’s dive into BinanceCoin (BNB) analysis.
👀 BNB 1H Overview
BNB reacted to its resistance yesterday and activated its long trigger. It is now still struggling with the same resistance zone, while we have slightly moved the resistance higher for the new trigger.
📊 Volume Analysis
BNB volume has formed a divergence with price. A clear resistance breakout requires rising buy volume for confirmation. Keep in mind that all valid breakouts need volume convergence—otherwise, a fakeout is very likely.
✍️ BNB Trading Scenarios
🟢 Long Scenario:
A breakout above the current resistance at $904, supported by increasing buy volume, could open a valid long setup.
🔴 Short Scenario:
A breakdown below the maker-buyer low at $877, confirmed with strong selling pressure on the 1H timeframe, could activate a short setup.
🧠 Protect your capital first. No setup is worth blowing your account. If risk isn’t controlled, profit means nothing. Trade with rules, not emotions.

CRUDE OIL (WTI): Confirmed BoS
I see a confirmed bullish break of a significant daily structure
and a candle close above that on WTI Crude Oil.
With a high probability, the market will continue rising and
reach 60.65 resistance soon.
❤️Please, support my work with like, thank you!❤️
I am part of Trade Nation's Influencer program and receive a monthly fee for using their TradingView charts in my analysis.

Ethereum crypto strong demand at $2,880 playing outEthereum tapped a major demand zone at $2,880, and the reaction is clear: buyers stepped in, just like they usually do when a clean, fresh imbalance takes control. The last time ETH reacted to a similar structure on the bigger timeframes, we saw extended bullish legs unfolding week after week.
Right now, the question is simple:
Will this demand level hold long enough to push ETH toward $4,120 and beyond?
Based on the current imbalance structure, the answer leans strongly toward yes.

Looking to buy GCGC fell on Friday leaving inefficiency above. 4H closed bullish with expansion candle. Looking to buy from 15M engulfed candle (order block). Going for bit more than 2R. 4H candle high is the first target

The #1 Trading Strategy💹 CAD/JPY Alert!
Looking at the charts, this pair is showing strong signs for a buy:
✅ Holding trendline support
✅ Respecting the uptrend
✅ Stoch RSI bouncing from the oversold zone
All signs point to momentum continuing upward. 🚀
Always remember: trade smart, manage your risk! 🛡️
#Forex #CADJPY #TrendlineSupport #StochRSI #ForexTrading #PriceAction #SmartTrading #FXSignals

NQ Monday, 8 Dec to Sunday, 14 Dec trading weekly lookoutWe will layout either one of this trading variations. On variation A we will trade lower to get some sellside liquidity to push higher or we will push higher first and tap into the daily fvg then shoots lower.

Hammer Candle Sparks Bullish HopesCoiling within a falling wedge and having printed a hammer candle on the daily timeframe last Friday, a resumption of the broader bullish trend in CHF/JPY may soon be on the cards. However, with RSI (14) and MACD turning neutral on directional bias, confirmation of the bullish signal would be preferred before considering long setups.
192.70 is a level worth keeping an eye on during Monday’s session, coinciding with the high set on 30 October where the price bounced strongly following a failed downside break on Friday. Should we see a retest of the level followed by another bounce, it would strengthen conviction about establishing long positions, creating a setup where entry could be made above the level with a stop beneath it or Friday’s low to protect against an extension of the latest pullback.
The first topside level of note for bulls would be the November downtrend, currently around 194.00. If the pair were to break and hold above this level, it would signal a potential return to the November high of 195.73, putting both it and horizontal resistance at 194.57 on the radar as other bullish targets.
Of course, should CHF/JPY resume its push lower, it would open the door for bearish setups, especially if we see a close beneath 192.70. If that were to eventuate, shorts could be established on the break with a stop above for protection, targeting the influential 50DMA where the price has bounced on six separate occasions since August when breached. A sustained move beyond that level would put 190.54 resistance and uptrend support dating back to February on the radar for bears.
Good luck!
DS

GOLD (XAUUSD): Sticking to The Plan
Gold stuck on a key daily resistance this week.
To buy, we continue waiting for its breakout.
A daily candle close above 4266 will confirm a violation.
A bullish continuation will be expected to 4355 then.
❤️Please, support my work with like, thank you!❤️
I am part of Trade Nation's Influencer program and receive a monthly fee for using their TradingView charts in my analysis.

FireHoseReel | BNB Daily Analysis #18🔥 Welcome To FireHoseReel !
Let’s dive into BinanceCoin (BNB) analysis.
👀 BNB 1H Overview
BNB is still holding the same position as yesterday, and due to the holiday period, the market hasn’t shown major changes. I’ve only adjusted the newly formed resistance slightly and moved it to $898.22.
📊 Volume Analysis
BNB volume was very low yesterday, but today it’s showing a moderate increase. Sundays usually bring more activity than Saturdays, so with rising volume, any trigger activation could lead to a faster move.
✍️ BNB Trading Scenarios
🟢 Long Scenario:
A breakout above the newly formed resistance at $898.22, supported by rising buy volume, could act as a risky long trigger. The next key long level lies around $922.57.
🔴 Short Scenario:
A 15-minute base has formed in this zone, which may offer a quick entry with a tight stop. The main short trigger is at $877.33—a confirmed break with volume could validate a short entry.
🧠 Protect your capital first. No setup is worth blowing your account. If risk isn’t controlled, profit means nothing. Trade with rules, not emotions.

GBPNZDPair found a weekly resistance zone around 2.34000 and failed to break above. Came back down and broke a minor D/H4 support around 2.31500, went to retest both the zone and 50EMA also forming an evening star pattern.
