Hammer Candle Sparks Bullish HopesCoiling within a falling wedge and having printed a hammer candle on the daily timeframe last Friday, a resumption of the broader bullish trend in CHF/JPY may soon be on the cards. However, with RSI (14) and MACD turning neutral on directional bias, confirmation of the bullish signal would be preferred before considering long setups.
192.70 is a level worth keeping an eye on during Monday’s session, coinciding with the high set on 30 October where the price bounced strongly following a failed downside break on Friday. Should we see a retest of the level followed by another bounce, it would strengthen conviction about establishing long positions, creating a setup where entry could be made above the level with a stop beneath it or Friday’s low to protect against an extension of the latest pullback.
The first topside level of note for bulls would be the November downtrend, currently around 194.00. If the pair were to break and hold above this level, it would signal a potential return to the November high of 195.73, putting both it and horizontal resistance at 194.57 on the radar as other bullish targets.
Of course, should CHF/JPY resume its push lower, it would open the door for bearish setups, especially if we see a close beneath 192.70. If that were to eventuate, shorts could be established on the break with a stop above for protection, targeting the influential 50DMA where the price has bounced on six separate occasions since August when breached. A sustained move beyond that level would put 190.54 resistance and uptrend support dating back to February on the radar for bears.
Good luck!
DS
Candlestick Analysis

GOLD (XAUUSD): Sticking to The Plan
Gold stuck on a key daily resistance this week.
To buy, we continue waiting for its breakout.
A daily candle close above 4266 will confirm a violation.
A bullish continuation will be expected to 4355 then.
❤️Please, support my work with like, thank you!❤️
I am part of Trade Nation's Influencer program and receive a monthly fee for using their TradingView charts in my analysis.

FireHoseReel | BNB Daily Analysis #18🔥 Welcome To FireHoseReel !
Let’s dive into BinanceCoin (BNB) analysis.
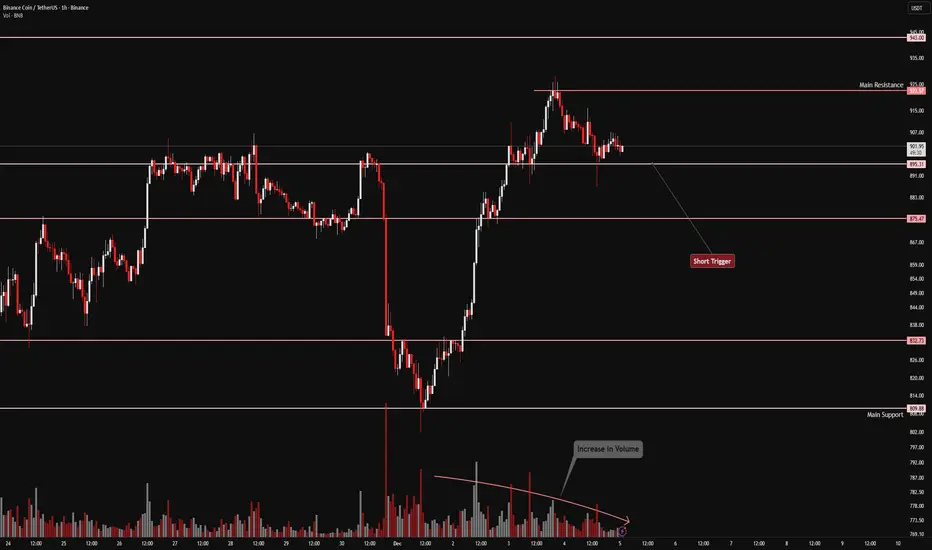
👀 BNB 1H Overview
BNB is still holding the same position as yesterday, and due to the holiday period, the market hasn’t shown major changes. I’ve only adjusted the newly formed resistance slightly and moved it to $898.22.
📊 Volume Analysis
BNB volume was very low yesterday, but today it’s showing a moderate increase. Sundays usually bring more activity than Saturdays, so with rising volume, any trigger activation could lead to a faster move.
✍️ BNB Trading Scenarios
🟢 Long Scenario:
A breakout above the newly formed resistance at $898.22, supported by rising buy volume, could act as a risky long trigger. The next key long level lies around $922.57.
🔴 Short Scenario:
A 15-minute base has formed in this zone, which may offer a quick entry with a tight stop. The main short trigger is at $877.33—a confirmed break with volume could validate a short entry.
🧠 Protect your capital first. No setup is worth blowing your account. If risk isn’t controlled, profit means nothing. Trade with rules, not emotions.

GBPNZDPair found a weekly resistance zone around 2.34000 and failed to break above. Came back down and broke a minor D/H4 support around 2.31500, went to retest both the zone and 50EMA also forming an evening star pattern.

Top 3 Mistakes Forex Traders MakeI had to Docukent this trade because it reminds of the time.
This time was slow.I tried to buy between two Moving Averages.
The 50 EMA and the 200 EMA.
Then I put a chart pattern.
This chart pattern is called the trendline support.
But there is a problem.
How do I use a chart pattern on forex trading?
And how do I trade with confidence so I used the following.
1-The trendline support
2-The Stochastic
3-RSI
These three tools are the mistakes that forex traders don't use.
Rocket boost this content to learn more.
Disclaimer ⚠️ Trading is risky please learn about risk management and profit taking strategies.
Also feel free to use a simulation trading account before you use real money.
BTC/USD – Band Rejection + Gap Squeeze Play (Textbook Execution)Caught a clean 30m bullish band rejection on BTC/USD, aligned with a textbook gap-up squeeze setup. Price gapped above the lower Bollinger Band after a clear downtrend, forming a strong engulfing candle. Entry triggered on break of the rejection candle high at 89,276.
Trade Highlights:
- Entry: 89,276 (2 lots)
- Target 1: Midline (9 EMA) hit at 89,372 (+0.11%)
- Target 2: Upper Band hit at 89,672 (+0.44%)
- Stop: 89,044 (below rejection low)
- Result: Full 1:1 RR achieved on both lots
Setup Confluence:
- Lower band rejection with hammer
- Gap-up ≥ 1% with strong close
- X/Y band stretch> 1.6 confirms squeeze
- No opposite rejection before midline
Takeaway: A+ setup with high-probability structure and mechanical execution. Kill fast, ride smart.

Gold risky scalpVery risky scalp am holding. Gold is bullish overall. Counter trend trade.
You can join me if you can. Risk little and manage trade well. Breakeven at 1:3RR


FireHoseReel | XRP Breaks Key Support, Eyes $1.99 Next🔥 Welcome To FireHoseReel !
Let’s jump into Ripple (XRP) market analysis.
👀 XRP 4H Overview
Compared to most coins in the market, XRP has experienced a sharper sell-off. Based on chart data, it has now broken its dynamic support and is currently moving toward the next dynamic support around $1.9928.
📊 Volume Analysis
XRP volume has declined due to the holiday period, so we rely more on past reactions. Previously, price attempted to defend this zone and bounce higher. This time, however, the level has been broken with a strong sell-off candle.
✍️ XRP Trading Scenarios
🟢 Long Scenario:
A breakout above the local high at $2.2454, supported by strong buying volume, could trigger a sharp upside move.
🔴 Short Scenario:
At the moment, a stop can be defined above the previous 4H candle. For a safer entry, wait for a reaction at $1.9928—if this support breaks with selling pressure, a short setup becomes valid.
🧠 Protect your capital first. No setup is worth blowing your account. If risk isn’t controlled, profit means nothing. Trade with rules, not emotions.

FireHoseReel | BNB Daily Analysis #17🔥 Welcome To FireHoseReel !
Let’s dive into BinanceCoin (BNB) analysis.
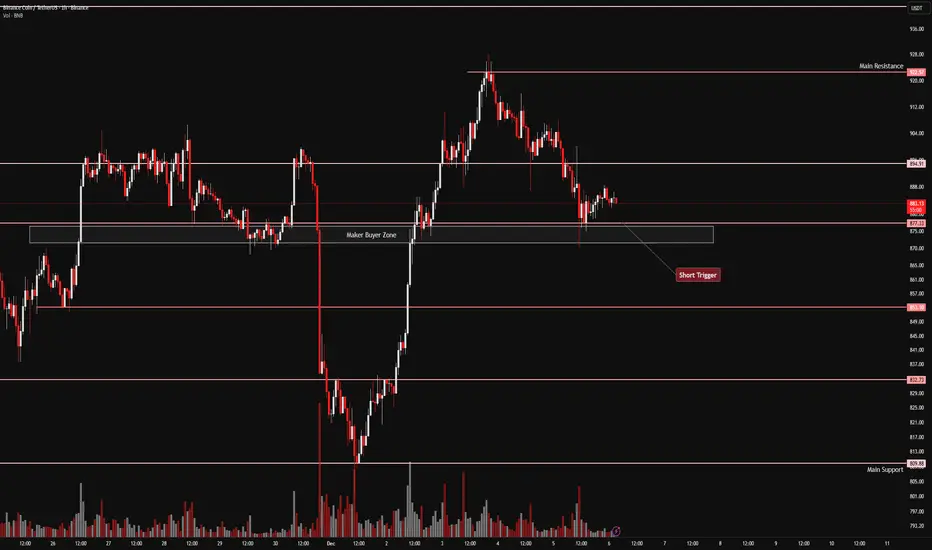
👀 BNB 1H Overview
After the recent drop, BNB is currently ranging between $895 and $877. A breakdown below the range floor could trigger a deeper correction. This support also aligns with the 38% Fibonacci retracement, making it a valid technical level.
📊 Volume Analysis
Volume increased during the sell-off, then dropped sharply in momentum. A strong sell-off candle hit the maker-buyer zone, followed by range consolidation. Due to the holiday period, volume conditions remain weak.
✍️ BNB Trading Scenarios
🟢 Long Scenario:
A breakout above the range high at $922 could activate the next long trigger.
🔴 Short Scenario:
A breakdown of the current floor (maker-buyer zone), potentially driven by a long squeeze and sudden volatility spike, could open the door for a short entry after a pullback with tighter risk.
🧠 Protect your capital first. No setup is worth blowing your account. If risk isn’t controlled, profit means nothing. Trade with rules, not emotions.
FireHoseReel | HYPE on 0.618 Fibonacci Decision Zone🔥 Welcome To FireHoseReel !
Let’s jump into HyperLiquid (HYPE) market analysis.
👀 HYPE 1H Overview
HYPE is currently trading near a key support zone and is forming a lower low compared to the previous bottom. This area also aligns with the 0.618 Fibonacci retracement, making it a critical reaction zone.
📊 Volume Analysis
HYPE volume has dropped significantly. The first strong increase in volume is likely to define the next major move. Volume is the most reliable confirmation here.
✍️ HYPE Trading Scenarios
🟢 Long Scenario:
A breakout above $35.945, either through a short squeeze or strong buy volume, can activate a bullish move to the upside.
🔴 Short Scenario:
A breakdown below the current support near $33.179 with rising sell volume can trigger a solid short setup.
🧠 Protect your capital first. No setup is worth blowing your account. If risk isn’t controlled, profit means nothing. Trade with rules, not emotions.

FireHoseReel | BNB Daily Analysis #16🔥 Welcome To FireHoseReel !
Let’s dive into BinanceCoin (BNB) analysis.
👀 BNB 1H Overview
BNB is currently hovering near a key support zone. A breakdown below this level could trigger a deeper correction toward lower prices.
📊 Volume Analysis
Trading volume has dropped sharply at this corrective level. A new surge in either buy or sell volume could ignite a strong momentum move.
✍️ BNB Trading Scenarios
🟢 Long Scenario:
A breakout above $922.57 with rising buy volume could offer a solid long opportunity.
🔴 Short Scenario:
A breakdown below the current support at $895, accompanied by strong selling pressure, could trigger a valid short setup.
🧠 Protect your capital first. No setup is worth blowing your account. If risk isn’t controlled, profit means nothing. Trade with rules, not emotions.
EUR/USD Long Position Idea (December 7th-13th)Leaving a longer stop loss for Wednesday news. This is on H1 time frame so will be very noisy but EURO still outperforming dollar especially with US FED turning more dovish Initiating Quantitative Easing and dropping tightening (likely).

The overall trend remains unchanged, it's still a bullish market#XAUUSD TVC:GOLD OANDA:XAUUSD
Gold has now broken out of the triangle pattern. Looking at the daily, 4H, and hourly charts, MA5 is around 4215. Furthermore, the short-term moving averages are showing an upward trend. Therefore, I believe we can consider taking a small long position in gold when it retraces to around 4215-4205 during the European session.

SILVER (XAGUSD): Consolidation & Trading Plan
Silver keep coiling within a narrow range on a daily.
Depending on the side of its breakout, I expect 2
potential scenarios.
If the market breaks and closes above 59.0 - the resistance
of the range, expect a bullish continuation to 60.0 level.
If the market breaks and closes below 56.2 - the support
of the range, expect a down movement to 54.5
Alternatively, keep trading the market within the range,
buying from the support and selling from the resistance.
❤️Please, support my work with like, thank you!❤️
I am part of Trade Nation's Influencer program and receive a monthly fee for using their TradingView charts in my analysis.

Nifty Analysis EOD – December 5, 2025 – Friday🟢 Nifty Analysis EOD – December 5, 2025 – Friday 🔴
Monetary Policy Boost: Bulls Secure Strong Close Above 26100 Targeted…!
🗞 Nifty Summary
The session began flat to positive, marking the day’s low early at 25,985. In anticipation of news, Nifty stayed range-bound within a tight 40-point range for the first hour. The announcement of the monetary policy rate cut acted as a strong catalyst, immediately triggering high volatility.
The index sharply broke the IBH and PDH, but the next candle was met with a 100-point rejection, trapping early breakout traders. After taking temporary support at the CPR Zone, Nifty resumed its upward conviction, systematically breaching 26132 and testing the Gap Zone.
Following a small consolidation near the Gap Zone (25-30 points), the final surge broke resistance again, taking Nifty to the 26200 level. The day closed at 26,186.45, adding +152.70 points (+0.59%).
This closing is significantly above the 26100 target expected yesterday, confirming powerful bullish control heading into the weekend.
🛡 5 Min Intraday Chart with Levels
🛡 Intraday Walk
The initial fakeout after the news announcement was crucial, shaking out weak hands before the real directional move began.
Once the market absorbed the volatility, the moves were aggressive and targeted. Nifty utilized CPR and 26132 as springboards, confirming that buyers viewed every dip as a buying opportunity in the post-policy environment.
The final close near the day’s high is a definitive technical signal that the strength has returned, and the index is ready to challenge higher structural levels next week.
📉 Daily Time Frame Chart with Intraday Levels
🕯 Daily Candle Breakdown
Open: 25,999.80
High: 26,202.60
Low: 25,985.35
Close: 26,186.45
Change: +152.70 (+0.59%)
🏗️ Structure Breakdown
Type: Strong Bullish candle (Near Marubozu)
Range (High–Low): ≈ 217 points — high volatility and wide trading range.
Body: ≈ 187 points — reflecting dominant upside momentum.
Upper Wick: ≈ 16 points — very limited rejection near highs.
Lower Wick: ≈ 14 points — buyers strongly defended the early weakness.
📚 Interpretation
This candle is a powerful confirmation of bullish conviction, showing decisive absorption of the early selling and continuous buying pressure throughout the session. The wide body and the close near the high signal that buyers are firmly in control. This structure strongly supports trend continuation and suggests that the recent indecision has been resolved in favor of the bulls.
🕯 Candle Type
Strong Bullish Marubozu-Style Candle — Represents decisive buying control and potential momentum continuation.
🛡 5 Min Intraday Chart
⚔️ Gladiator Strategy Update
ATR: 192.7
IB Range: 76.75 → Medium
Market Structure: Balanced
Trade Highlights:
10:16 Long Trade - SL Hit (IBH + PDH Breakout)
10:49 Long Trade - Target Hit (R:R 1:3.34) (IBH + PDH Breakout)
Trade Summary: The volatile, news-driven session initially led to a Stop Loss on the first breakout attempt. However, the strategy quickly adapted, capturing a high R:R profitable long trade on the confirmed directional breakout, successfully aligning with the strong bullish momentum post-monetary policy announcement.
🧱 Support & Resistance Levels
Resistance Zones:
26202 (PDH)
26220 ~ 26235
26277 (ATH)
Support Zones:
26155
26104 (Must Hold)
26070 ~ 26030
🧠 Final Thoughts
“The monetary policy provided the spark needed to re-engage the bull run.”
The successful close above 26132 is a game-changer. The immediate bias for Monday is strongly bullish. We must now watch the critical overhead resistance at 26220 ~ 26235.
A decisive breach here will immediately target the All-Time High at 26277. The 26104 level is the new line in the sand; as long as Nifty holds this support, the bullish momentum remains intact.
✏️ Disclaimer
This is just my personal viewpoint. Always consult your financial advisor before taking any action.

GBPUSD 1HA structured approach to market analysis combining Fibonacci retracement levels with key Support & Resistance zones.
Price action is monitored to identify reaction points, liquidity zones, and potential reversal or continuation setups.
The analysis focuses on high-probability confluence areas where Fibonacci ratios align with historical structure levels, helping traders spot optimal entry points, stop-loss zones, and profit-taking targets.

EURUSD 15 MINA structured approach to market analysis combining Fibonacci retracement levels with key Support & Resistance zones.
Price action is monitored to identify reaction points, liquidity zones, and potential reversal or continuation setups.
The analysis focuses on high-probability confluence areas where Fibonacci ratios align with historical structure levels, helping traders spot optimal entry points, stop-loss zones, and profit-taking targets.

EURNZD LONG IDEA Trade idea: LONG OANDA:EURNZD
Going long on EURNZD pair as it has reached the last Fibbonacci retracement level 78%. As we can see, a clear break of structure to the up side and price is showing some signs of weakness.
Entry Price: 2.0182
Stop-Loss (SL) 2.0077
Take-profit (TP) 2.0682
With a clear RRR of 1:3
DISCLAIMER: This is not financial advice. All trading involves risk. Do your own research

CARDANO (ADAUSD): Bullish Reversal Confirmed?!
There are multiple bullish clues on ADA on a daily time frame
that make me think that the market is ready for a reversal.
First, the price formed a high momentum bullish candle.
Then, the market violated a resistance line of a falling
wedge pattern.
A change of character occurred afterward.
The market has a great potential to rise more
and reach 0.474 resistance soon.
❤️Please, support my work with like, thank you!❤️
I am part of Trade Nation's Influencer program and receive a monthly fee for using their TradingView charts in my analysis.

NZDCAD: Confirmed BoS 🇳🇿🇨🇦
I see a confirmed Break of Structure on NZDCAD.
There is a high probability that the pair will continue rising now.
Expect a bullish movement to 0.80878
❤️Please, support my work with like, thank you!❤️
I am part of Trade Nation's Influencer program and receive a monthly fee for using their TradingView charts in my analysis.

PEP (PEPSI) Is ready to RISEThere is a bullish candle and the RSI has risen sharply forming a breakaway gap and the stock is ready to rise higher on increased momentum

EUR/USD: Important Bullish Breakout The EURUSD pair has successfully violated and closed above a significant resistance level, which was established by a prior higher high.
This confirmed break of structure suggests a strong likelihood of continued bullish movement.
The subsequent resistance level is observed at the 1.1700 psychological mark.
This level may represent the next goal for buyers.
