US 500 – Signs of Fatigue After a Strong Recovery?It’s been an edgy start to December for the US 500 index, a month which is historically one of the strongest. Part of the reason could be that the last 7 trading days of November saw a 5.3% rally from lows of 6508 (Nov 21st) to 6852 (Nov 28th) as markets reacted positively to more dovish commentary from Federal Reserve policymakers, which revived the possibility of a final Fed rate cut at their last meeting of the year on December 10th.
Now Fed speakers are in the blackout period before that meeting where they are banned from publicly discussing current policy and it suddenly feels like a long time to wait to hear the outcome of their deliberations, especially with the US 500 sitting a mere 2% from its record highs of 6925 set on October 30th.
Traders also must contend with a busy data schedule across this week, and it didn’t get off to the best start with yesterday’s US ISM Manufacturing PMI survey showing activity falling further into contraction territory (below 50), with sagging order books and higher prices being paid.
However, while manufacturing activity is important to the US economy, by far the biggest driver is services and the ISM Services PMI survey is due for release tomorrow at 1500 GMT. Last month’s reading sat comfortably in expansion territory (above 50) and US 500 traders will be looking to judge this new release against the previous month. Any disappointment could weigh on sentiment and vice versa.
The available updates on the US labour market could also be important as they could impact the Fed rate decision next week. The ADP monthly private sector payrolls is released tomorrow at 1315 GMT, with the Challenger job cuts due Thursday at 1230 GMT and weekly jobless claims due at 1330 GMT. The shock weaker Challenger job cuts reading last month initiated some extra US 500 volatility and it will be interesting to see if this happens again.
The technical backdrop is also potentially crucial going into such a critical period and the current assessment can be seen below.
Technical Update: Signs of Fatigue After Strong Recovery?
The US 500 index has staged an impressive recovery of more than 5.3% since the November 21st low, as recent price weakness once again found dip buyers. This pattern has been a consistent feature in US equities for some time. However, as the chart below highlights, the latest upside move in price has yet to achieve a close above the potential resistance defined by the October and November highs.
This may be seen by some as the latest buying failing to breach a previous price peak, thereby disrupting the pattern of higher highs and higher lows. In other words, a possible sign of slowing upside price momentum.
Of course, this does not necessarily signal the end of recent price strength. However, it may remain prudent to monitor both support and resistance levels closely, as doing so may help clarify whether the latest activity reflects a slowing of upside momentum that could lead to renewed weakness, or simply a pause in the advance before fresh price strength emerges.
Potential Resistance Levels:
As strong as the rally from the November 21st low appears, it currently remains capped below 6880, the November 12th session high. As the chart below highlights, this 6880 level represents the last recovery high and failure point, where selling pressure was sufficient to reverse the price advance back to the downside. Traders are therefore possibly viewing 6880 as the first potential resistance level to the current rally.
While not a guarantee of continued upside, closing breaks above 6880 may be interpreted as a sign of price strength resuming. If this proves to be the case, closes above 6880 could pave the way for attempts to challenge 6925, the October 30th session high, with possibilities for further gains should that level also give way on a closing basis.
Potential Support Levels:
If resistance at 6680 continues to hold, traders may begin to suspect that upside price momentum is slowing, which in turn could see renewed selling pressure. At the same time, attention may shift to 6751 as the first support. This level is equal to the Bollinger mid‑average.
While much will depend on future market sentiment and price trends, closing breaks below 6751 could open scope for further declines. Such moves, if seen, may lead to tests of 6722, the 38.2% Fibonacci retracement of the latest advance, and potentially even extend toward 6681, the deeper 50% retracement.
The material provided here has not been prepared accordance with legal requirements designed to promote the independence of investment research and as such is considered to be a marketing communication. Whilst it is not subject to any prohibition on dealing ahead of the dissemination of investment research, we will not seek to take any advantage before providing it to our clients.
Pepperstone doesn’t represent that the material provided here is accurate, current or complete, and therefore shouldn’t be relied upon as such. The information, whether from a third party or not, isn’t to be considered as a recommendation; or an offer to buy or sell; or the solicitation of an offer to buy or sell any security, financial product or instrument; or to participate in any particular trading strategy. It does not take into account readers’ financial situation or investment objectives. We advise any readers of this content to seek their own advice. Without the approval of Pepperstone, reproduction or redistribution of this information isn’t permitted.
Candlestick Analysis

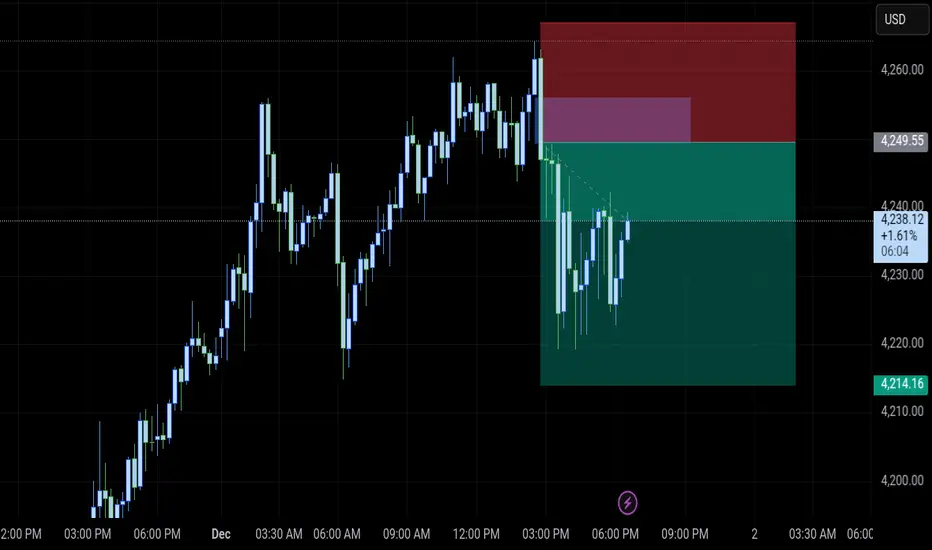
Technical corrections do not mean reversal of the bullish trend#XAUUSD OANDA:XAUUSD TVC:GOLD
📊 From the current structure, gold rebounded to a high of around 4264 yesterday before fluctuating downwards.
💠 However, the price of gold has not yet effectively broken below the daily MA5 and MA10, and there is still some support below.
📈 The brief pullback is a build-up for a better rise later.
🌈 As I said yesterday, the technical indicators showed a bearish divergence, indicating a need for technical correction. Therefore, it is not surprising that gold prices will fall in the short term.
💡 The key focus for today is the daily MA5 and MA10. The first support level is at 4205-4195. If the price retraces to this level, you can consider a small long position in gold, with appropriate SL orders.
💡 If the price falls below the 4205-4195 support zone, it is advisable to remain on the sidelines and not rush into further trading. Because the downside potential may open up, the price may fall back to the 4160-4140 Fibonacci retracement zone in the short term. This area will determine whether the upward trend can continue. Pay close attention to any stabilization signals in this area during the day.

USDCAD: Another Bullish Confirmation 🇺🇸🇨🇦
A quick follow-up for the yesterday's post for USDCAD.
I see another bullish pattern on a 4H time frame now.
The price formed a cup & handle pattern and broke its neckline.
I still expect a move up to 1.402
❤️Please, support my work with like, thank you!❤️
I am part of Trade Nation's Influencer program and receive a monthly fee for using their TradingView charts in my analysis.

Gold is still showing us it's bearish intent on the macroEasy peasy reading on the week so far. Let me know if I missed anything. I'm here for the sharing of info 💎

USD/CAD: Bullish Move After Bear TrapI see a potential bearish trap on #USDCAD following a test of a significant daily support level.
The formation of a cup and handle pattern on the 4-hour timeframe after the market opened indicates considerable buying interest.
I anticipate a rise to 1.4031.

Nikkei signals flash bearish as BOJ hawkish bets buildA bearish engulfing candle on our Japan 225 contract coincides with an obvious three-candle evening star pattern in futures, delivering a double dose of bearish signals that point to growing downside risks for Japanese stocks.
Currently, long-running uptrend support dating back to the April lows and the 50DMA are in close proximity beneath where the contract trades, making that a key support zone to focus on should the signals from the price action prove reliable.
If we see a clean break and close beneath the zone, it would allow for shorts to be established with a stop above the 50DMA to protect against reversal, targeting 48,400 support initially. If that gives way, 47,000, 45,170 and 42,000 were levels that saw plenty of price action either side earlier in the year, putting them on the radar as targets should we see a sustained unwind.
Of course, if the support zone comprising the 50DMA and uptrend support holds, it would allow for long setups to be considered, targeting 50,580 and 51,500 resistance initially. A stop beneath the 50DMA would protect against reversal.
RSI (14) and MACD are delivering neutral signals, a departure from what was seen in recent months when upside strength was dominant. While both indicators are gradually moving towards bearish territory right now, the preference remains to let price action and signals determine how to proceed.
Good luck!
DS

US Dollar Seasonality Patterns for DecemberI delve into excel to assess seasonal patterns within the month of December for the US dollar index, EUR/USD, AUD/USD and USD/CHF.
Matt Simpson, Market Analyst at City Index.

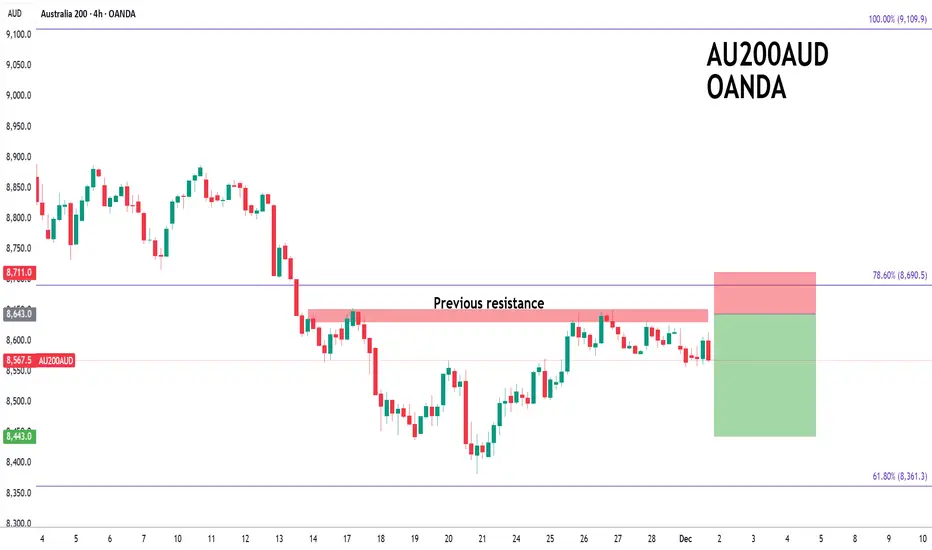
ASX200 to continue in the downward move?AU200AUD - 24h expiry
8649 has been pivotal.
20 1day EMA is at 8657.
Daily signals are bullish.
Our short term bias remains negative.
Price action continued to range between key support & resistance (8560 - 8640) although we expect a break of this range soon.
We look to Sell at 8643 (stop at 8711)
Our profit targets will be 8443 and 8403
Resistance: 8620 / 8649 / 8700
Support: 8556 / 8500 / 8410
Risk Disclaimer
The trade ideas beyond this page are for informational purposes only and do not constitute investment advice or a solicitation to trade. This information is provided by Signal Centre, a third-party unaffiliated with OANDA, and is intended for general circulation only. OANDA does not guarantee the accuracy of this information and assumes no responsibilities for the information provided by the third party. The information does not take into account the specific investment objectives, financial situation, or particular needs of any particular person. You should take into account your specific investment objectives, financial situation, and particular needs before making a commitment to trade, including seeking, under a separate engagement, as you deem fit.
You accept that you assume all risks in independently viewing the contents and selecting a chosen strategy.
Where the research is distributed in Singapore to a person who is not an Accredited Investor, Expert Investor or an Institutional Investor, Oanda Asia Pacific Pte Ltd (“OAP“) accepts legal responsibility for the contents of the report to such persons only to the extent required by law. Singapore customers should contact OAP at 6579 8289 for matters arising from, or in connection with, the information/research distributed.
FireHoseReel | USDT Dominance at a Critical Turning Point🔥 Welcome to FireHoseReel !
Let’s dive into the USDT Dominance (USDT.D) analysis.
👀 USDT.D 1H OverView
USDT dominance moved higher after breaking our key level and is now facing a rejection near 6.491%.
⚡️ Fibbo Retracement
We have applied Fibonacci retracement from the recent low to the high, which clearly highlights the critical levels.
Forming a higher low on these zones could confirm a renewed bullish continuation in dominance.
However, a break below the 0.618 Fibonacci level and the formation of a lower low could act as an early trend reversal signal, forcing us to shift our multi-timeframe market bias.
❤️ Risk Management & Emotional Discipline
Crypto trading is highly risky. Without proper risk management and emotional control, trading is no different from gambling.
Logic must always come before emotions. Learn to manage your trades—and enjoy the process of trading with control and discipline.

FireHoseReel | TON’s Last Support of Defense🔥 Welcome to FireHoseReel !
Let’s dive into the analysis of Telegram Coin (TON).
👀 TONUSDT 4H Overview
TON has reached a very critical support zone. A clean break below this level could activate our next short trigger and lead to a deeper drop than many expect.
📊 Volume Analysis
Selling pressure during the formation of this support has been significant. With heavy market FOMO, many traders have already exited their TON positions. If this downside momentum continues, TON could enter a deeper corrective phase.
🔁 TONBTC Prespective
Meanwhile, the TON/BTC pair is also in a bearish structure, indicating that TON’s relative strength against Bitcoin is weakening.
📌 Trading Scenario
At the moment, TON presents one primary scenario, focused on the short side, which you can use alongside your own trading setup.
🔴 Short Scenario
A breakdown below the current support at $1.465, confirmed by a strong increase in sell volume, could trigger a sharp decline in TON.
❤️ Risk Management & Emotional Discipline
Crypto trading is highly risky. Without proper risk management and emotional control, trading is no different from gambling.
Logic must always come before emotions. Learn to manage your trades—and enjoy the process of trading with control and discipline.

FireHoseReel | CAKE at a Critical Support Zone🔥 Welcome To FireHoseReel !
Let's dive into Cake analysis, the native token of PancakeSwap DEX.
👀 CAKE – Short-Term Market Breakdown
After breaking its newly formed support at $2.342, CAKE moved sharply lower and formed a temporary support around $2.233.
A breakdown below $2.233 could activate the next major downside trigger.
📊 Volume Analysis
Selling pressure on CAKE has intensified aggressively.
In a single 4H candle, sellers dominated the market with heavy force.
If sell volume expands again, the current downtrend is likely to continue with momentum.
🔁 CAKE/BTC Perspective
The CAKE/BTC pair is still holding a bullish structure, but a loss of its current support could trigger a corrective phase in the BTC pair as well.
📌 Trading Scenario
This scenario can be used alongside your own trading strategy and risk management.
🔴 Short Scenario
Breakdown below the newly formed support at $2.233
Must be accompanied by a strong increase in sell volume
This could push CAKE lower and may also trigger a support breakdown on CAKE/BTC, adding further downside pressure.
❤️ Risk Management & Emotional Discipline
Crypto trading is highly risky. Without proper risk management and emotional control, trading is no different from gambling.
Logic must always come before emotions. Learn to manage your trades—and enjoy the process of trading with control and discipline.

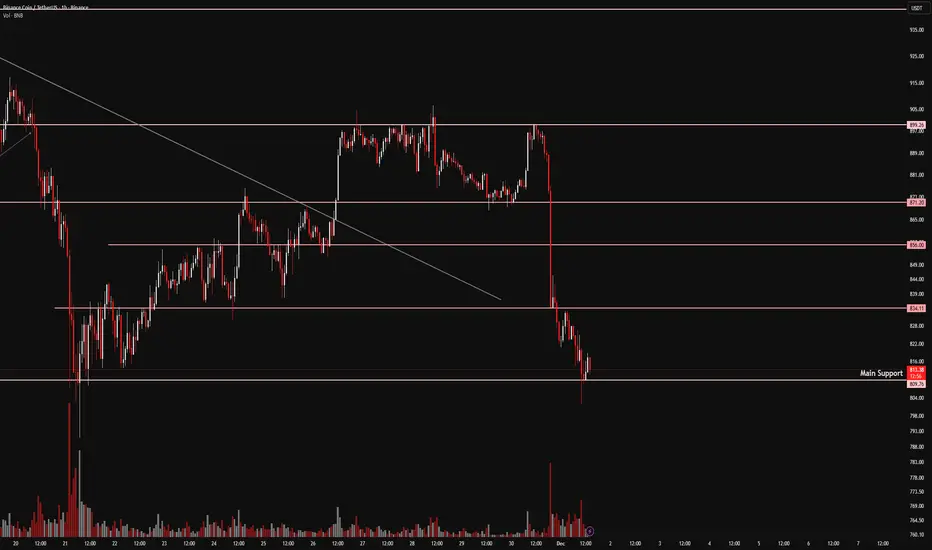
FireHoseReel | BNB Daily Analysis #12🔥 Welcom To FireHoseReel !
Let's dive into BinanceCoin (BNB) Analysis .
👀 BNB – Short-Term Breakdown Watch
After losing the $871 support, BNB experienced a sharp sell-off into the current zone since last night. We are now waiting for the next directional move.
A clean break below $810 could activate our next major trigger.
📊 Volume Behavior
Selling pressure has clearly increased during the recent drop.
During any short-term correction, buy volume is expected to stay weak, keeping pullbacks shallow.
For a valid continuation to the downside, the $810 support must break with strong sell volume.
📌 Today’s Active Scenario
For today, only one primary scenario is in focus, and it can be used alongside your own trading strategy.
🔴 Short Scenario
• Breakdown below $810
• Confirmed by a clear increase in sell volume
This would provide a solid short entry setup.
Even if market FOMO is extreme, decisions must stay strictly logic-based. A second touch after the break offers a more reliable entry.
❤️ Risk Management & Emotional Discipline
Crypto trading is highly risky. Without proper risk management and emotional control, trading is no different from gambling.
Logic must always come before emotions. Learn to manage your trades—and enjoy the process of trading with control and discipline.
FireHoseReel | BNB Daily Analysis #11🔥 Welcome To FireHoseReel !
Let's dive into BinanceCoin ( BNB ).
👀 BNB is currently attempting to break a strong support zone at $873. A confirmed breakdown of this level could activate our short trigger.
📊 BNB volume has dropped sharply. One key reason is a completed multi-timeframe distribution structure, along with the impact of the current holiday period. The first strong volume expansion will likely define the next price direction.
🧮 The RSI oscillator remains in the 36.5 range, similar to yesterday. A breakout from this range, aligned with volume expansion, would confirm momentum entering BNB’s next move.
✍️ I will update the scenarios for you, though they remain mostly unchanged from yesterday, with only minor shifts in support levels.
🔴 Short Scenario: A clean break below the marked support with rising sell volume can provide a valid short setup. However, without RSI confirmation, risk should be reduced due to the possibility of a fake breakdown.
🛞 Risk Management & Disclaimer
Please remember to always use proper risk management and position sizing. Nothing in this analysis is financial advice. The market can change quickly, so always trade based on your own strategy, research, and risk tolerance. You are fully responsible for your own trades.

FireHoseReel | LTC:When does Litecoin explode next?🔥 Welcome to FireHoseReel!
Let’s dive into the 4H Litecoin (LTC) analysis.
👀 Litecoin is currently trading below a descending curve trendline.
Each time price hits this curve, it gets rejected to the downside. Price is now approaching the end of this compression zone, while a key support has formed at $81.48 near the bottom.
📊 Litecoin volume has been declining during the recent drop and is now at very low levels.
Once volume expands again, any upcoming move in LTC is likely to become more impulsive and powerful.
✅ The LTC/BTC pair is also in a strong corrective phase, showing a noticeable decline in Litecoin’s relative strength against Bitcoin.
✍️ You can review the main Litecoin scenarios below and use them alongside your own trading strategy if needed.
🟢 Long Scenario:
A breakout above the descending curve trendline, followed by a clean pullback, and then a push toward the static resistance at $87.42 with rising buy volume, could activate our long trigger.
🔴 Short Scenario:
A breakdown below the $81.48 support with a confirmed close below this level and increasing sell volume could activate our short trigger.
❤️ Risk Management & Emotional Discipline
Crypto trading is highly risky. Without proper risk management and emotional control, trading is no different from gambling.
Logic must always come before emotions. Learn to manage your trades—and enjoy the process of trading with control and discipline.

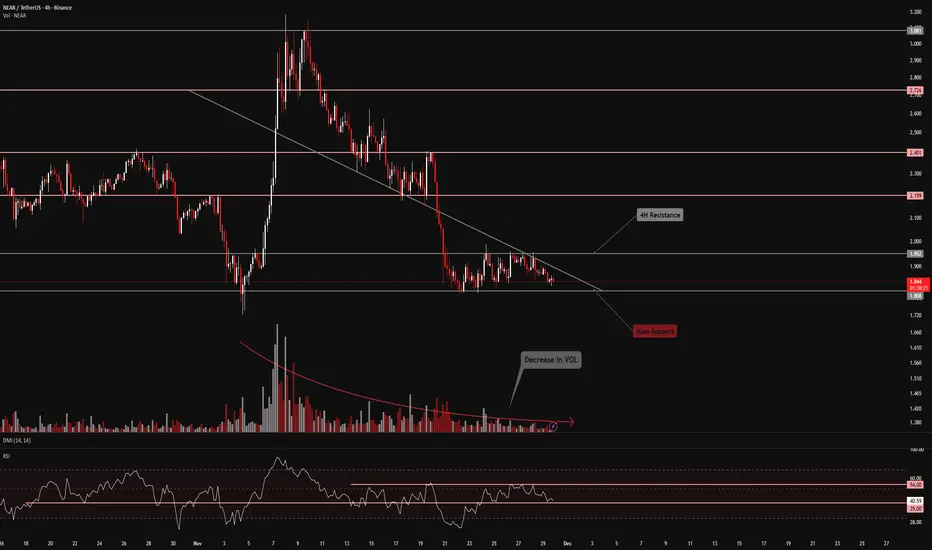
FireHoseReel | NEAR: Bulls and Bears Face Off at Key Levels🔥 Welcome to FireHoseReel !
Let’s dive into the 4H analysis of NEAR.
👀 After a sharp and powerful rally, NEAR faced a heavy rejection at the $3.081 level and entered a corrective phase.
This correction has been unusually deep and aggressive.
📉 NEAR is now sitting on a critical support at $1.808. Losing this level could activate our short trigger and open the door for further downside.
📊 NEAR’s trading volume has dropped, similar to many other coins in the market.
The first solid volume expansion will likely signal NEAR’s next directional move.
🔭 NEAR is known for making sharp moves after losing or reclaiming key support or resistance levels, which often provides excellent risk-to-reward opportunities.
✍️ Potential NEAR scenarios are outlined below.
Always make sure to use them alongside your own trading strategy.
🟢 Long Scenario:
A breakout above the major resistance at $1.952, supported by rising buy volume and an RSI break above 54, could trigger a valid long setup.
🔴 Short Scenario:
A breakdown below the critical support at $1.808, combined with increasing sell volume and RSI dropping below 39, could lead to a significant downside move.
❤️ Risk Management & Emotional Discipline
Crypto trading is highly risky. Without proper risk management and emotional control, trading becomes pure gambling.
Let logic always lead your decisions—not emotions. Trade with control and discipline.
Bitcoin's daily chart on fire
Daily time frame with a medium-term view
1. Market trend:
Downward trend
2. Supports and resistances:
Support levels:
1- 84.646
2- 76.236
3- 67.672
Resistance levels:
1- 100.889
2- 110670
3- 123.410
3. Technical tools and indicators:
The RSI oscillator has reached near the oversold zone again after a short-term rest, and if it enters the oversold zone, it could signal further price declines.
4. Price patterns:
No specific pattern is observed.
5. Trade volume:
The trading volume is increasing in the downward trend.
Market scenarios ahead:
- Price increase scenario (bullish):
For the bullish scenario, we need the price to close above 100889; in that case, the targets of 110670 and 123410 are accessible.
- Price decrease scenario (bearish):
If the candle closes below the price of 84646, we enter the bearish scenario, in which case the targets of 76236 and 67672 are accessible.
Final note:
This view is merely a personal analysis, and the responsibility for trading transactions rests entirely with the trader. Always consider proper and safe risk management.
#Technical_Analysis #Financial_Markets #closetrader

BTCUSDT decision BYBIT:BTCUSDT.P expecting to hunt the liquidity and wait for the reaction after touching the order block.
Too late for a short and too early for a long position.
I'll update the chart accordingly.

Nifty Analysis EOD – December 1, 2025 – Monday🟢 Nifty Analysis EOD – December 1, 2025 – Monday 🔴
Exhaustion Gap Turns Lethal: Bears Take Driving Seat
🗞 Nifty Summary
The Nifty opened with a substantial 108-point Gap Up, placing it above the 26300 level and the Previous Day’s High (PDH)—a clear sign of early bullishness.
After the Initial Balance (IB) formation, bulls failed decisively to hold 26277 (the ATH zone), and the index slipped to fill the gap. Once the 26220 support was briefly tested, a trendline push initiated a sharp sell-off below the PDC, hitting 26150.
After forming a base near the PDL and S1 zone, bulls attempted a recovery, but the confluence of 26220 + CPR Zone + VWAP all acted as strong resistance, pushing Nifty back down.
The session closed at 26,175.75, near the PDL, with a loss of -27.20 points (-0.10%). The day confirms that the initial gap-up was an exhaustion move. After the critical break below the IB Low, bears remained firmly in the driving seat throughout the session.
🛡 5 Min Intraday Chart with Levels
🛡 Intraday Walk
The day began with a false signal. The gap-up failed to find follow-through buying, indicating strong supply near the ATH. The decisive shift occurred when the price failed to hold the 26277 zone, leading to the gap-fill and a breakdown below the IB Low. The subsequent inability to regain and hold the 26220 level—a key pivot from the previous two days—confirmed the bearish reversal.
Today’s Daily Candle range engulfs the previous two-day range, which is a clear technical sign of heavy selling pressure at higher levels. However, the bounce from the 26150 region suggests that buyers are ready to support the index near 26100.
📉 Daily Time Frame Chart with Intraday Levels
🕯 Daily Candle Breakdown
Open: 26,325.80
High: 26,325.80
Low: 26,124.20
Close: 26,175.75
Change: −27.20 (−0.10%)
🏗️ Structure Breakdown
Type: Bearish candle (Near Bearish Marubozu).
Range (High–Low): ≈ 202 points — expanded volatility.
Body: ≈ 150 points — reflecting clear, continuous downward movement from open to close.
Upper Wick: ≈ 0 points — Market opened at the high, showing zero buying follow-through above the open. This signals immediate and strong rejection.
Lower Wick: ≈ 52 points — buyers attempted to defend lower levels (around 26150) but were unable to regain control.
📚 Interpretation
The candle opened at the high (Bearish Marubozu with lower wick defence), confirming immediate supply and an exhaustion gap.
The range engulfing the past two sessions is a strong bearish signal. Tomorrow is the Weekly Expiry, and the crucial question is whether Nifty can hold 26100 to attempt one more challenge of 26277 and achieve a strong close.
🕯 Candle Type
Bearish Marubozu (with strong directional selling pressure).
🛡 5 Min Intraday Chart
⚔️ Gladiator Strategy Update
ATR: 197.31
IB Range: 56.35 → Small
Market Structure: ImBalanced
Trade Highlights:
10:39 Short Trade - Target Hit ( R:R 1:2.54)
12:52 Long Trade - Target Hit ( R:R 1:1.93)
Trade Summary: The strategy adapted well to the day’s sharp, imbalanced moves. Despite the overall bearish sentiment, the system successfully captured high R:R opportunities on both the significant short-side move from the exhaustion gap and a key long-side recovery.
🧱 Support & Resistance Levels
Resistance Zones:
26220 (Immediate Pivot/CPR)
26277 (Old ATH/Key Resistance)
26320
Support Zones:
26104 (Previous Strong Resistance, now first support)
26030
25985
25930 ~ 25920
🧠 Final Thoughts
“The gap-up was the liquidity required for the short.”
The failure to hold the ATH zone, coupled with the Bearish Engulfing candle, shifts the short-term bias to bearish. The fate of the weekly expiry hinges on 26104. If Nifty breaks and sustains below 26100, we should see an aggressive drop towards 26030 quickly. For bulls to survive, they must reclaim 26220 immediately on the open.
✏️ Disclaimer
This is just my personal viewpoint. Always consult your financial advisor before taking any action.

GOLD (XAU/USD): Bullish ContinuationThere is a strong likelihood that Gold will continue to appreciate following a confirmed breakout above a significant intraday/daily resistance cluster.
We anticipate a move upwards to at least 4300.

USDJPY Buys trade IdeaThis is a risky low confirmation buy setup. Anticipating for a continuous bullish Price Action when price mitigates the OB/Demand zone.
Manage risk well.

CRUDE OIL (WTI): Bearish Movement After Trap
There is a high probability that Crude Oil will drop
after a false violation of an intraday resistance.
A double top pattern above that and a return
of the price below the underlined structure after
a neckline breakout give a strong signal.
I anticipate a bearish movement to 58.68
❤️Please, support my work with like, thank you!❤️

AUDUSD is bearish in for a while!AUDUSD is bearish in 1-5min timeframe having met necessary conditions as explained in the image above.
Conditions:
1. Create a liquidity sweep on the highs and only then;
2. Break of structure on the swing low.
