EURGBP SHORTsMarket structure bearish on HTFs DH
Entry at both Weekly and Daily AOi
Weekly Rejection at AOi
Daily Rejection at AOi
Previous Daily Structure Point
Around Psychological Level 0.88000
Touching EMA H4
H4 Candlestick rejection
Rejection from Previous structure
TP: WHO KNOWS!
Entry 100
REMEMBER : Trading is a Game Of Probability
: Manage Your Risk
: Be Patient
: Every Moment Is Unique
: Rinse, Wash, Repeat!
: Christ is King.
Candlestick Analysis

Nifty Analysis EOD – November 27, 2025 – Thursday🟢 Nifty Analysis EOD – November 27, 2025 – Thursday 🔴
Nifty Marks New All-Time High at 26,310.45, Followed by Intraday Consolidation.
🗞 Nifty Summary
Following yesterday’s powerful performance, the Nifty started another 60 points up, very close to the All-Time High (ATH). It filled the initial gap within the first five minutes, then successfully broke the previous ATH, marking a new record high and day high at 26,310.45.
However, the market was unable to sustain this top level. The 26220 zone provided multiple supports but was eventually breached around 1 PM, causing Nifty to fall to the next support zone of 26180 ~ 26132, where the day low was marked at 26,141.90.
A recovery pushed the index 80 points back up, but the 26220 level—formerly support—now acted as resistance. The day closed essentially flat at 26,215.55, adding a marginal +10.25 points (+0.04%).
The day was characterized by a single distribution, consolidating the massive gains from yesterday’s rally. After 14 months (since Sept 27, 2024), we are at a new ATH—a major psychological milestone.
🛡 5 Min Intraday Chart with Levels
🛡 Intraday Walk
The initial breakout above the ATH was quickly rejected, leading to an intraday price correction. The action confirmed that while there is buying interest at lower levels (the long lower wick), there is significant supply entering the market right at the new highs.
The wide, 168-point range and the inability to close strongly above the 26220 level indicate that the momentum has paused. This pattern suggests consolidation or profit-booking after a major breakout, which is often healthy before the next sustained move.
📉 Daily Time Frame Chart with Intraday Levels
🕯 Daily Candle Breakdown
Open: 26,261.25
High: 26,310.45
Low: 26,141.90
Close: 26,215.55
Change: +10.25 (+0.04%)
🏗️ Structure Breakdown
Type: Indecision / Neutral Bearish candle (close slightly below open).
Range (High–Low): ≈ 169 points — moderate intraday volatility.
Body: ≈ 46 points — relatively small body showing indecision and lack of directional conviction.
Upper Wick: ≈ 49 points — buyers attempted to break higher (to the ATH) but faced selling pressure.
Lower Wick: ≈ 74 points — strong defense by buyers, preventing a deeper downside.
📚 Interpretation
This candle reflects equilibrium after a significant push. The long lower wick highlights strong demand on dips, while the upper wick confirms selling pressure at the new ATH. The small body signals a pause, indicating neither bulls nor bears could take decisive control. The market is consolidating its position above the old ATH zone (26277).
🕯 Candle Type
Indecision / Neutral Bearish Candle with Lower-Wick Support — Shows balance between buyers and sellers; potential pause before next directional move.
🛡 5 Min Intraday Chart
⚔️ Gladiator Strategy Update
ATR: 210.90
IB Range: 195.5 → Big
Market Structure: ImBalanced
Trade Highlights:
10:49 Long Trade - SL Hit
13:11 Short Trade - Trailing SL Hit
Trade Summary: The choppiness around the ATH breach led to a challenging day for directional strategies. The lack of clean follow-through resulted in minor losses on the attempts to catch the trend, reflective of the market’s consolidation phase.
🧱 Support & Resistance Levels
Resistance Zones:
26220 (Immediate Resistance)
26277 (Old ATH, Now Immediate Resistance)
26310 (New ATH)
Support Zones:
26104 (Previous Strong Resistance, now first support)
26030
25985
25930 ~ 25920
🧠 Final Thoughts
“Consolidation is healthy, but the portfolio question remains.”
While the index achieved a new ATH, the indecisive close means the market is taking a breath. The immediate bias is neutral-to-positive, contingent on holding the 26180 ~ 26132 support zone.
A successful move above 26277 on Friday will confirm the resumption of the uptrend. Regarding the lack of portfolio participation: this often happens when the rally is concentrated in a few large-cap index heavyweights; it’s a cautious sign suggesting poor market breadth.
✏️ Disclaimer
This is just my personal viewpoint. Always consult your financial advisor before taking any action.

Nifty makes ATH, Profit Booking strikes thereafter. What next?Nifty made a new ATH today exactly after 14 Months although it is a point to rejoice. On the hindsight there is no growth for last 14 months. Such phases do come even in a Bull market but a closing above Today's ATH that is 26310 will be the real turnaround. Sometimes the indices will not reward you for months years and on some other occasions they will cover it up in few weeks or month. Afterall it is law of averages that catches up.
Nifty has been growing from last 20 years approximately around 15% per year. Last 14 months have been lackluster so if things go well Bulls can have a field day or weeks or months in the coming times. What we need is a weekly or monthly closing above 26310. As you can see in the chart the next resistance after 26310 will be around 26433. Major major Breakout above this zone.
Supports for Nifty are near 26141, 26015, 25834 and finally Mother line support is near 25608 on the daily chart.
Disclaimer: The above information is provided for educational purpose, analysis and paper trading only. Please don't treat this as a buy or sell recommendation for the stock or index. The Techno-Funda analysis is based on data that is more than 3 months old. Supports and Resistances are determined by historic past peaks and Valley in the chart. Many other indicators and patterns like EMA, RSI, MACD, Volumes, Fibonacci, parallel channel etc. use historic data which is 3 months or older cyclical points. There is no guarantee they will work in future as markets are highly volatile and swings in prices are also due to macro and micro factors based on actions taken by the company as well as region and global events. Equity investment is subject to risks. I or my clients or family members might have positions in the stocks that we mention in our educational posts. We will not be responsible for any Profit or loss that may occur due to any financial decision taken based on any data provided in this message. Do consult your investment advisor before taking any financial decisions. Stop losses should be an important part of any investment in equity.

FireHoseReel | AVAX: Building Energy Below Resistance🔥 Welcome To FireHoseReel !
Let’s dive into the analysis of AVAX (Avalanche).
👀 AVAX – 4H Market Structure Overview
On the 4-hour timeframe, after breaking its descending trendline, AVAX showed very strong bullish bias.
Even the pullback after the breakout was very shallow. Price then compressed like a spring and pushed away from the breakout zone with large whale-sized candles.
AVAX is now ranging just below a major resistance.
If this resistance breaks and price holds above it, we can say AVAX is likely to continue its bullish trend.
📊 Volume Analysis
Pay close attention to volume:
• The first volume spike came right after the bearish trendline breakout.
• The second volume increase appeared during the pullback completion at the $13.94 support.
• Now we are seeing the third wave of rising buy volume below resistance. This structure suggests that AVAX may be preparing for another multi-timeframe bullish rally, potentially transferring this momentum into higher timeframes.
✔️ AVAX/BTC – Additional Confirmation Looking at AVAX/BTC gives us a different perspective.
This pair is strongly bullish, confirming that AVAX deserves to stay on our watchlist for potential positions.
AVAX/BTC completed its correction while staying above a bullish curve structure and, just like AVAX/USDT, it is now sitting below resistance.
This resistance creates a trigger at 0.0001654, which is a key breakout level for confirmation.
📌 Trading Scenarios for AVAX, Below are the scenarios you can use alongside your own trading strategy. 👇🏻
🟢 Long Scenario
A breakout above the current AVAX resistance at $13.94, supported by rising buy volume, could start another bullish rally.
However, keep in mind:
• This is still the first direct test of resistance
• Any immediate entry here would be considered high risk
The safer approach is to:
• Wait for a pullback and consolidation
• Then enter after buy volume increases and the pullback structure completes
🔴 Short Scenario
A strong rejection from resistance, followed by:
• A lower high compared to the previous top
• A break of the new local low
• And the appearance of bearish patterns such as Failure Swing or Non-Failure Swing
can offer a valid short entry.
Even if we see equal highs, a confirmed break of the local low can still provide a short opportunity.
🛞 Risk Management & Disclaimer
Please remember to always use proper risk management and position sizing. Nothing in this analysis is financial advice. The market can change quickly, so always trade based on your own strategy, research, and risk tolerance. You are fully responsible for your own trades.

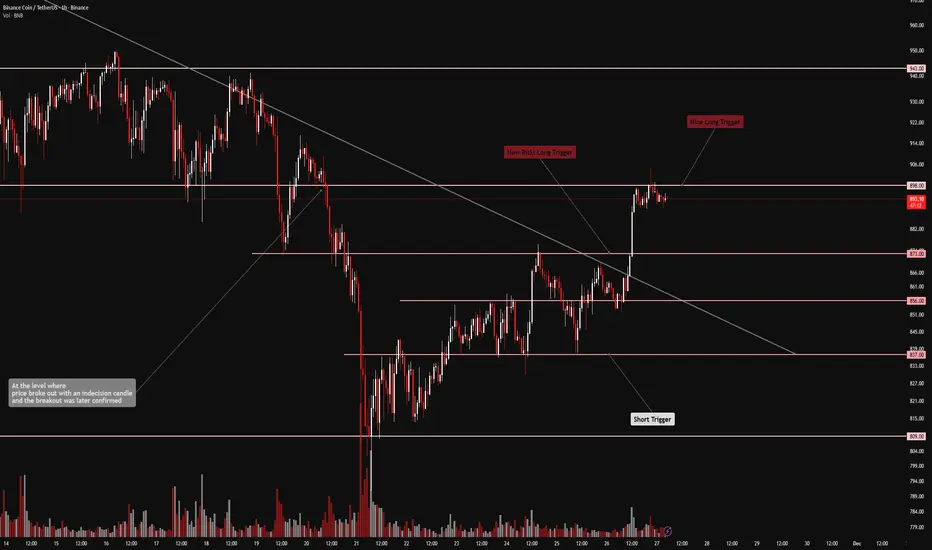
FireHoseReel | BNB Daily Analysis #8🔥 Welcome FireHoseReel !
Let’s dive into the current BNBUSDT Structure .
🔷 BNB Market Update & Trade Scenarios
After our initial trigger was activated, BNB moved higher and the long position was successfully entered. Price is now trading at a major resistance zone, and a confirmed breakout above this area could activate the next long trigger. If the position had been opened earlier with a lower-risk entry, this secondary trigger would now provide a strong opportunity to scale into the position with confirmation.
📊 Volume Insight
From a volume perspective, the breakout and acceptance above the 873 level were supported by a clear expansion in trading volume, confirming strong buyer participation. During the pullback phase, volume noticeably declined, which signals a healthy and controlled correction, not aggressive distribution. For continuation toward the 898 resistance, we now need to see a fresh and decisive increase in buying volume to validate sustained bullish momentum.
📌 Below are the key scenarios based on the current BNB market structure, which can be used alongside your own trading strategy. 👇🏻
🟢 Long Scenario
A clean breakout above the 898 resistance, confirmed by a strong bullish candle close and rising buy volume, could offer a high-quality long setup.
The stop-loss can be safely placed below the most recent local low to maintain a favorable risk-to-reward profile.
🔴 Short Scenario
If price forms a lower high followed by a lower low, or prints a bearish structure such as a failure swing or non-failure swing, with volume confirmation, a valid short setup may emerge—especially since the higher-timeframe market cycle still carries bearish pressure.
🛞 Risk Management & Disclaimer
Please remember to always use proper risk management and position sizing. Nothing in this analysis is financial advice. The market can change quickly, so always trade based on your own strategy, research, and risk tolerance. You are fully responsible for your own trades.
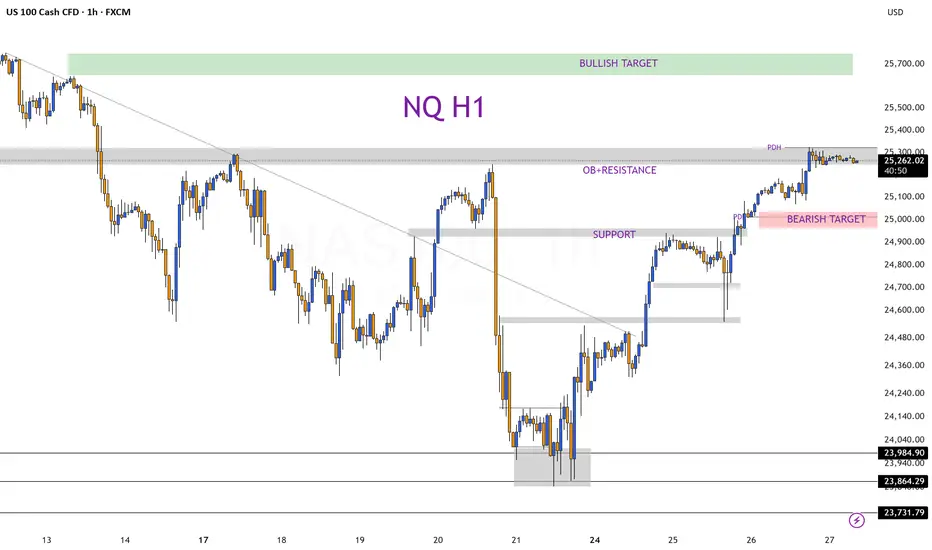
Nasdaq Outlook – Accumulation, Early Close & Two Key ScenariosThe Nasdaq is repeating yesterday’s market structure: Asia has accumulated once again, and London is likely to provide the manipulation phase before setting the day’s direction. Today we must also factor in reduced liquidity, as the New York session will close early due to Thanksgiving—this typically increases intraday volatility and can exaggerate moves in either direction.
Technical Setup:
Price is consolidating tightly, showing clear signs of preparation for a breakout. The bullish momentum remains intact as long as the index holds above the 25,000 region, supported by expectations of a potential Fed rate cut in the coming weeks, which continues to fuel risk-on sentiment across equities.
Scenario 1 (Most interesting):
If price breaks the current accumulation to the downside, I will look for long entries in the 25,090–25,020 zone, aiming for a continuation of the bullish rally.
Scenario 2:
If price breaks upward directly from the range, the next bullish target sits around 25,600.
SP:SPX TVC:DXY TVC:VIX CAPITALCOM:US100
Long trade 🟦 1. Trade Details
Pair: EURUSD
Direction: Buyside
Session: NY Session AM
Entry: 1.15754
Profit Level: 1.16276 (+0.32%)
Stop Level: 1.15707 (-0.04%)
Risk-to-Reward: 7.71R
Entry 5min TF
🟩 2. Higher-Timeframe Context (HTF Bias)
Bias: Bullish recovery after a deep liquidity purge on the downside
The HTF structure shows EURUSD operating within a premium-to-discount reaccumulating after hitting the daily low at 1.1547. The 1.618 external range extension (1.16001) becomes the primary liquidity magnet. Strong displacement printed after sweeping the 8:30 AM liquidity, creating a clear NY session reversal signature.
🟨 3. Liquidity Story & PD Arrays
EURUSD formed a textbook NY Reversal Model:
Liquidity Taken
✔ Sell-side sweep beneath 1.15600 (liquidity purge)
✔ Equal lows removed → shifted the algorithm into accumulation
✔ Inducement above internal structure before the final push
🟥 4. Entry Model Breakdown (ICT/SMC)
Model Used: NY Session AM Reversal → BOS → FVG → Re-entry → Expansion
Key Points
BOS created after the NY 8:30 AM news sweep, confirming a shift in order flow
Price retraced into the discount FVG + 0.382 retracement alignment
Confluence with dynamic support via EMA/WMA cross
Entry taken at 1.15754 as price rebalanced the micro FVG with bullish displacement behind it
Stop placed below the extreme wick at 1.15707.
🟧 6. Market Sentiment & Narrative
Macro Sentiment
USD index showed early weakness at the NY AM window
EURUSD correlational flows supported bullish reaction after CPI volatility
Liquidity build-up during Asia & London provided the perfect fuel for NY session expansion
Narrative Summary
“NY engineered a sell-side sweep below the morning lows. With the liquidity collected, the algorithm repriced aggressively upward, delivering a clean long setup into clear inefficiencies. Structure, FVG, displacement, and PD array alignment all pointed in one direction — higher.”
🟩 8. Continuation Bias
As long as price holds above 1.1590, bullish continuation remains valid
Next HTF targets:
1.1650 (1H imbalance top)
1.1689 (2.618 extension)

Long trade
🟦 1. Trade Details
Pair: AUDUSD
Direction: Buyside
Timeframe: 15-minute
Session: NY Session AM
Entry: 0.64923
Take Profit: 0.65289 (+0.47%)
Stop Loss: 0.64815 (–0.17%)
Risk-to-Reward: RR 4.11
Date/Time: Wed 26 Nov 25 — 10:20 am
🟩 2. HTF Context
The market recently completed a multi-day bearish leg, tapping into HTF discount.
Structure shows a significant wick below 0.6460, creating a major liquidity sweep and shifting HTF order flow. AUDUSD then created progressive M15 BOS structures, reclaiming the 50 EMA and building bullish momentum. The push into the imbalance at 0.6507 is a structural confirmation that price is entering a markup cycle.
🟪 3. Liquidity
Sell-side sweep:
Price took the low at 0.64577, clearing several layers of Asia + NY lows.
Induced shorts on the breakdown → ideal fuel for the reversal.
Buy-side targets above:
M15 FVG cluster around 0.6515 – 0.6530
Thin liquidity pocket at 0.6528
Prior M30 inefficiencies that remain unbalanced
🟥 5. Entry Logic & Execution
Entry at the discount side of the M15 imbalance.
Stop-loss placed beneath the protected swing + FVG tail (0.64815).
Confluence factors:
EMA alignment (bullish cross)
Displacement candle confirming continuation
Rejection of the mid-range supply (0.6504)
🟫 6. Sentiment & Narrative
USD weakening as macro flows rotate out of safe-haven behavior.
AUD benefited from improved Asian session sentiment & commodity correlation.
NY AM session volatility created the ideal expansion window for continuation.
Retail bias heavily short after multi-day downtrend → wrong-footed by the sweep + shift.
🟩 7. Outcome & Forward Bias
Structure remains bullish above 0.6480.
Next HTF draw-on-liquidity levels:
0.6550
0.6580

Long trade Wed 26th Nov 25 — 13:30 PM (NY Session PM)
Entry TF: 5-Min
🟩 1. Trade Parameters
Pair: AUDNZD
Direction: Buy-Side
Entry: 1.14459
Stop Loss: 1.14377
Take Profit: 1.14740
Risk–Reward: 5.6R
🟨 2. Higher-Timeframe Context
HTF (15m / 30m / 1H) structure:
Market formed a deep displacement (observed 1Hr Chart) down during Asia → took equal lows at 1.14300–1.14320. Followed by a strong NY recovery leg, leaving multiple clean FVGs in discount. Price reclaimed the WMA + EMA cluster, signalling a structural shift.
1H candle shows a wick rejection + close above mid-range, aligning with bullish continuation.
1Hr Chart
🟧 3. Liquidity
Liquidity removed before entry
Aggressive sweep of the Asian low (1.1430).
Equal lows formed at 1.1437 → then taken.
Clear liquidity purge to draw in late sellers.
Liquidity above (targets)
1.14740 (clean buy-side liquidity + inefficiency).
Prior NY swing high sits above FVG.
A void from earlier displacement needs filling.
🟥 4. SMC / ICT Technical Model Breakdown
✔ Model: FVG + BOS + Shift in Orderflow
BOS at approx. 1.1456 confirms accumulation reversal.
Price pulls back into a refined 5-min FVG + micro OB.
EMAs flip to bullish stack (yellow over blue).
Entry occurs at the equilibrium inside the pullback.
Entry TF: 5-Min
Key confluences:
MSB + BOS alignment.
Multiple overlapping FVGs acting as support.
Reclaim of discounted zone.
Strong upward displacement candle pre-entry.
🟪 6. Sentiment / Narrative
Narratively:
Market created compression into the low (inducement).
NY PM session usually drives expansion after morning accumulation.
AUD strength rotated strongly in NY hours.
NZD weaker across currencies → strengthening the long bias.
Sweep → reclaim → enter at discount → deliver to imbalance.
🟫 7. Trade Outcome
Status: Pending / active

Long trade📘 TRADE JOURNAL ENTRY — AVAXUSDT (5m)
Pair: AVAXUSDT
Direction: Buyside
Session: NY AM
Entry TF: 5m
Entry: 13.521
Take Profit: 14.557 (+7.23%)
Stop Loss: 13.437 (-0.25%)
Risk-to-Reward: RR 20.86
🟩 2. HTF Context (Structure & Liquidity)
HTF market (1H–4H) was in macro discount, aligning with a bullish retracement model.
Prior days show deep displacement down into a demand zone 13.12 – 13.30.
Clear liquidity sweep of the Friday low, followed by compression and accumulation.
London session earlier in the day created a swing low BOS → signalling bullish continuation.
🟧 3. Model Identification (ICT / SMC Confluence)
ICT Model Used: Buyside Reversal → Displacement → FVG Entry
Confluences: Accumulation wedge → breakout → retest entry.
Liquidity grab below the structural low (13.18 zone).
Break of Structure (BOS) on the 5m confirming short-term trend reversal.
FVG (Fair Value Gap) aligned with entry zone.
Demand zone MITIGATED, validating the bullish bias.
EMA/WMA stack inversion (blue above yellow) signalling bullish strength.
🟪 4. Entry Logic
Entry triggered at 13.521, which aligned with:
Rebalanced FVG
Retest of breaker block inside the premium/discount boundary
Trendline retest + micro BOS confirmation
Volume shift from selling to buying pressure
Stop loss placed logically below the inefficiency + OB low at 13.437
🟥 5. Liquidity Targets (Upside Objectives)
Local buy-side liquidity above 13.897 – cleared
HTF supply zone 13.97 – 14.25 – approached
Full imbalance toward 14.557 – completed
Continuation target: 14.92 (HTF liquidity pool)
🟫 6. Sentiment & Narrative
Tokyo PM session provided clean reaccumulating, typical for continuation plays.
Broader crypto market in a risk-on phase, assisting directional bias.
Retail trapped short after breakdown of London low, providing fuel for the upside run.
Market moved strongly from discount → equilibrium → premium, validating execution.
🟨 7. Outcome Summary
Status: In Session

Long trade 🟩 1. Trade Parameters
Pair: GBPAUD
Direction: Buy-Side
Entry: 2.02991
Stop Loss: 2.02778
Take Profit: 2.03792
Risk–Reward: 8.03R
🟨 2. Higher-Timeframe Context
HTF Structure (15m / 30m / 1H):
Market was coming off a deep liquidity sweep below 2.02400.
A clear BOS printed on the 15m as price broke above internal structure (micro swing at 2.0290).
Price rebalanced a previous 15m FVG and held above the 50 EMA → transition from bearish → bullish orderflow.
🟧 3. Liquidity
The move leading into the entry satisfies the exact ICT liquidity chain:
Liquidity Taken Before Entry
Asia Session Lows swept (yellow markers).
NY Pre-Market Low taken → displacement candle confirmed bullish intent.
Equal lows near 2.0250–2.0260 fully cleared → prime inducement.
Liquidity Resting Above (Targets)
Old High at 2.0379 (primary liquidity magnet).
Multiple FVG inefficiencies (0.75 level) above the entry line.
Prior NY session high → acts as the delivery target.
🟥 4. SMC / ICT Model Breakdown
✔ Sweep → BOS → FVG → Entry inside discount
Sweep: Lows around 2.0240–2.0250 removed.
BOS: Bullish break above 2.0290.
Retracement: Pullback into 2-min FVG + OB alignment.
Entry: In discount of the short-term range, using a tight SL under structural low.
Displacement: Strong bull candle confirming orderflow.
Confluences:
Price traded into HTF demand zone.
EMA/WMA stacking bullish (yellow above blue).
Strong bullish volume spike after BOS.
FVGs acting as support
🟪 6. Sentiment / Narrative
Market sentiment aligned with bullish recovery after liquidity engineering:
NY session typically forms the expansion phase.
Prior consolidation built compression → expansion potential.
Price rejected decisively from extreme discount pricing.
AUD weakness helped pump GBP crosses.
🟫 7. Trade Outcome
Result: Pending / Running according to chart

NZDUSD ShortsMarket structure bearish on HTFs DW
Entry at Daily AOi
Weekly Rejection at AOi
Previous Weekly Structure Point
Daily Rejection at AOi
Previous Daily Structure Point
Around Psychological Level 0.56500
Touching EMA H4
H4 Candlestick rejection
TP: WHO KNOWS!
Entry 90%
REMEMBER : Trading is a Game Of Probability
: Manage Your Risk
: Be Patient
: Every Moment Is Unique
: Rinse, Wash, Repeat!
: Christ is King.

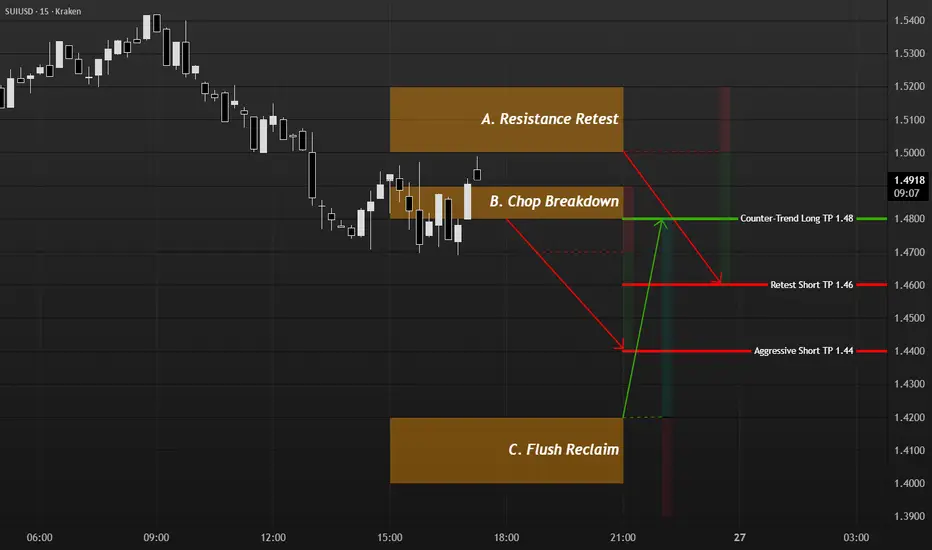
SUI intraday while BTC stallsBTC is chopping at key levels, so I’m not forcing trades there. Instead I’m using SUI on Kraken: strong push up from 1.33 to 1.55 on 24th, then clear distribution and break lower, which gives three structured ideas.
A. Base case: short a failed retest of 1.50–1.52 after rejection, invalidation above 1.54–1.55, targeting 1.46 then 1.42.
B. Aggressive: if price grinds under 1.48 and breaks, I look to sell a retest from below with the same invalidation and target at 1.44.
C. Counter-trend: I only consider a long after a sharp flush into 1.40–1.42 and a clean reclaim on 15m; below 1.40 the bounce idea is off.
This is a map, not signals. I size so a full stop costs about 0.5% of equity and take partial profits at the first target.
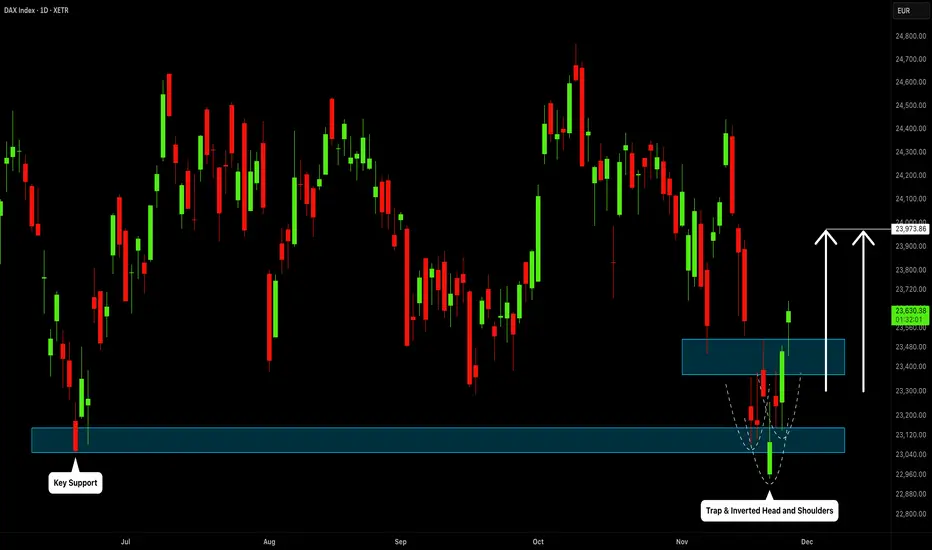
DAX INDEX: Finally Bullish?!
I see a confirmed bearish trap on DAX index
after a test of a key historic support.
An inverted head & shoulders pattern formation
and a bullish violation of its neckline provide strong
signal.
I expect a recovery at least to 24000 now.
❤️Please, support my work with like, thank you!❤️
SPX - Setups for both Long and Short SPX is approaching a trendline that will give us direction is which way to trade. A break above this line we can look for longs, any type of rejection such as bearish engulfings on the line, is a good risk short trade. Feel free to drop opinions!

Market outlook and investment strategy: I am bullish.#XAUUSD TVC:GOLD OANDA:XAUUSD
Judging from the structural trend and the performance of gold in different timeframes, gold has formed a short-term double bottom structure based on the trend line, and the prototype of the W pattern is gradually emerging.
Although the price retreated slightly after touching the channel resistance level around 4160 in the evening, it did not break the current upward structure, and the market is still dominated by bulls. Meanwhile, influenced by multiple positive factors such as geopolitical uncertainties and rising market speculation about a December rate cut, gold still has the potential for further gains.
Therefore, based on the current trend structure and fundamental logic, in the future trading process, we can first pay attention to the short-term resistance of 4170-4180, which is a key resistance under the triangle consolidation pattern. When it first touches this level, we can try to short gold with a small position and set the stop loss above 4185 to prevent the risk of a strong bullish breakout.
Meanwhile, if this strategy is effective, we need to pay attention to the subsequent rebound after the gold price falls back and stabilizes, which will help confirm the completion of the W pattern. At that time, we will focus on the breakout of the neckline at 4200-4205. If it can stabilize above this level, the upside potential will be further opened up, and it may extend to 4240-4245, or even higher!
In summary, our trading strategy must closely follow the confirmation signals of the trend structure. Therefore, it is essential to strictly control position size and stop-loss. We will continue to monitor market dynamics and optimize our trading strategy accordingly.

FLNC - BullishFLNC – Volatility Expansion Thesis
The chart shows a multi-year range with two critical Volatility Expansion levels acting as the fulcrum of every major move. Price has repeatedly expanded away from these levels and then reverted back into them. They function as the midpoint of the entire structure.
1. Primary Setup
Price is attempting to reclaim the upper Volatility Expansion band near 17.40–17.76. Historically, every time price reclaimed this zone, it triggered a multi-month expansion leg to the upside (yellow arrow reference). When price failed this zone, the move unwound back into the lower expansion level at 14.83.
This is the same mechanic repeating now.
2. Why This Area Matters
This 17–18 zone is where prior expansions initiated and where prior failures collapsed. It is the single most important decision-making level on the chart. It represents:
• structural acceptance or rejection
• volume re-accumulation or distribution
• volatility compression or release
Holding above it converts the entire multi-year range into bullish continuation.
3. Current Structure
Price swept the lower expansion level at 14.83, held, and impulsively rotated back toward the upper expansion band. The current rejection wick only matters if price cannot reclaim 17.40–17.76. Reclaiming it confirms buyers stepping back into control and signals a new expansion cycle.
4. Expansion Target
The next untested zone is the large inefficiency at 36–38. This is the same grey box drawn on the chart. It is the only clean upside magnet left once price accepts above the expansion band. Liquidity is thin above 22, so the move accelerates quickly once the reclaim is secured.
5. Trigger
The trade is binary:
• Reclaim 17.40–17.76 → expansion toward 36–38.
• Fail the reclaim → mean reversion back toward 14.83.
Price is sitting right under the trigger and volatility is compressing, which usually leads to an expansion move.

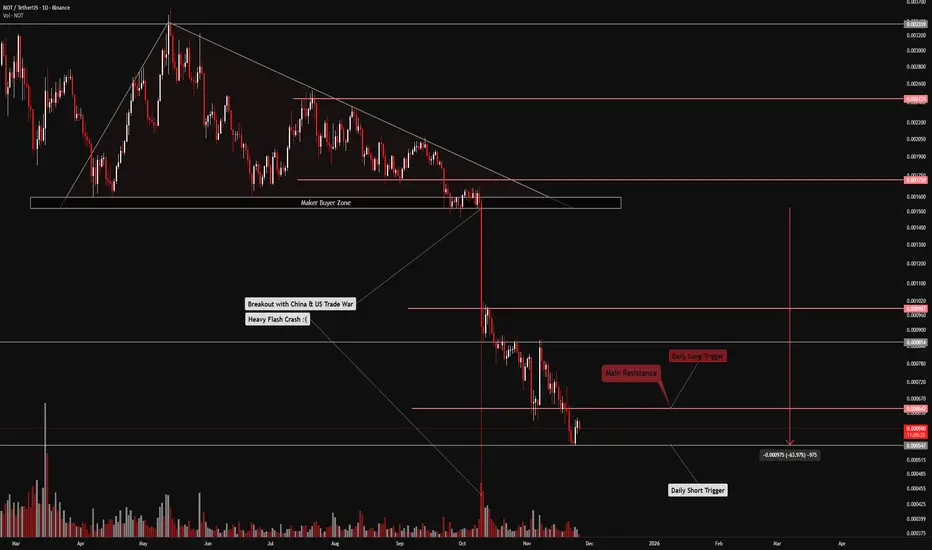
FireHoseReel | NOT: 64% Down — Capitulation or Massive Reversal?🔥 Welcome to FireHoseReel !
Let’s explore the latest Notcoin price structure.
🪐 NOTCOIN – Market Structure & Key Levels Update
Notcoin has suffered a 64% crash following the flash crash triggered by the US–China trade war, marking one of the most severe declines in its history. Since its launch via a Telegram airdrop, Notcoin has consistently shown fragile price behavior, with repeated sharp corrections. Persistent selling pressure has made each pullback deeper, and the recent price action has even added an extra zero — clearly reflecting the gravity of this drawdown.
✨ Market Structure & Liquidity Outlook
At this stage, Notcoin’s structure has become extremely sensitive. Any additional downside could easily trigger a new corrective wave.
On the bullish side, if capital rotation returns to the TON ecosystem, Notcoin may experience a liquidity-driven upside squeeze. However, this scenario is heavily dependent on TON network performance and Telegram execution.
• Key Price Levels
• Daily resistance: 642
• Major support: 547
A daily close above 642 could activate a high-risk long trigger, best approached through futures trading for better flexibility.
On the other hand, a break below 547 may unleash aggressive selling pressure across Notcoin.
📊 Volume Analysis – The Decisive Factor
Volume remains the most critical metric at this stage.
After the flash crash, overall volume declined, but during multi-timeframe corrections, selling pressure clearly resurfaced, as confirmed by recent volume candles.
So far, strong buy-side volume has been rare, while sell pressure has stayed persistent and dominant.
✅ Trading Scenarios :
🔼 Long Scenario
• Confirmed break above 642
• Accompanied by a strong surge in volume
• This could trigger an upside expansion and support holding airdropped NOT or opening futures long positions.
🔽 Short Scenario
• Breakdown below 547
• Followed by a clear increase in sell pressure
• This would signal distribution risk, possibly forcing whale exits. Losing this support could justify reducing exposure and re-entering at lower levels to control risk.
🛞 Risk Management & Disclaimer
Please remember to always use proper risk management and position sizing. Nothing in this analysis is financial advice. The market can change quickly, so always trade based on your own strategy, research, and risk tolerance. You are fully responsible for your own trades.
Nifty Analysis EOD – November 26, 2025 – Wednesday🟢 Nifty Analysis EOD – November 26, 2025 – Wednesday 🔴
The “Greenest Day”: Open = Low and a One-Sided Rally Towards ATH.
🗞 Nifty Summary
Responding strongly to positive news and global market cues, the Nifty started with the formation of Open = Low (25,842.95) and launched a relentless, one-sided rally toward the 26200 level. Many traders were expecting a dip at resistance, but this slow, steady, and strong northern run kept pushing upward.
After a long period, all indices traded firmly in the green. The index closed powerfully at 26,205.30, adding a massive +320.50 points (+1.24%).
The sheer magnitude and structure of the move—a full-body bullish candle—raises the key questions: Was this heavy short covering on the first day of the new expiry, or genuine fresh institutional long positioning? The move has been stunning, and the Nifty is now right on the doorstep of the All-Time High (ATH).
🛡 5 Min Intraday Chart with Levels
🛡 Intraday Walk
The Open = Low condition immediately signaled aggressive buying and zero morning hesitation. The rally consumed all previous resistance levels from the past two days with minimal effort.
This strongly imbalanced market structure created a challenging trading day for those expecting a retracement. The steady climb, driven by strong volumes, suggests high conviction behind the move. The focus now shifts entirely to the imminent challenge of the All-Time High at 26277.
📉 Daily Time Frame Chart with Intraday Levels
🕯 Daily Candle Breakdown
Open: 25,842.95
High: 26,215.15
Low: 25,842.95
Close: 26,205.30
Change: +320.50 (+1.24%)
🏗️ Structure Breakdown
Type: Strong Bullish candle (Marubozu).
Range (High–Low): ≈ 372 points — high volatility and decisive trend strength.
Body: ≈ 362 points — reflecting powerful upside momentum with strong institutional buying.
Upper Wick: ≈ 10 points — buyers held control till the very end, minimal profit booking near the close.
Lower Wick: ≈ 0 points — the market never traded below the open (Open = Low), indicating aggressive, non-stop buying from the first minute.
📚 Interpretation
This is a textbook signal of extreme bullish conviction. The Marubozu-like structure completely engulfs several previous days’ candles, negating the recent bearish retracement and confirming the continuation of the primary trend. The focus now is on follow-through; a move of this strength often precedes an immediate challenge of the next major objective.
🕯 Candle Type
Marubozu Bullish Candle
🛡 5 Min Intraday Chart
⚔️ Gladiator Strategy Update
ATR: 210.90
IB Range: 195.5 → Big
Market Structure: ImBalanced
Trade Highlights:
09:45 Long Trade - Target Hit (R:R 1:2.94)
Trade Summary: Given the powerful one-sided nature of the move, the strategy quickly identified the bullish imbalance and captured the core directional move with a high R:R long trade, performing perfectly in a trending market.
🧱 Support & Resistance Levels
Resistance Zones:
26220 (Immediate Resistance)
26277 (All-Time High / Key Hurdle)
Support Zones:
26104 (Previous Strong Resistance, now first support)
26030
25985
25930 ~ 25920
🧠 Final Thoughts
“Frozen by the move? Now, plan for the ATH breach.”
The market has cleared all immediate resistance and is poised to challenge the All-Time High (26277). Given the strength of today’s close, the bias for Thursday is strongly bullish.
We must watch for an immediate follow-through above 26220. If the market fails to breach the ATH (26277) on the first attempt, a minor dip back to the 26104 support would be healthy before the next attempt.
✏️ Disclaimer
This is just my personal viewpoint. Always consult your financial advisor before taking any action.

NZDCHF: Bearish Move From Trend Line 🇳🇿🇨🇭
On a today's live stream, we discussed a trading setup on NZDCHF.
There is a high chance that the pair will retrace from a solid falling
trend line on a daily time frame.
Goal - 0.456
❤️Please, support my work with like, thank you!❤️
I am part of Trade Nation's Influencer program and receive a monthly fee for using their TradingView charts in my analysis.

FireHoseReel | TOTAL2 Facing Major 4H Resistance🔥 Welcome to FireHoseReel !
Let's dive into total2 market structure.
👀 TOTAL2 4H Analysis
TOTAL2 has reached its four-hour resistance around the one point two four level and is currently showing a clear reaction and rejection from this zone. This resistance can act as a key barrier for Ethereum and ETH-based altcoins, and a breakout above it could activate their long triggers. A descending trendline has already been broken, and then TOTAL2 hit this resistance with a strong whale-sized bullish candle, which clearly highlights the importance of this level.
RSI Osilator📊
Now focus on the RSI oscillator: it is currently sitting near its local top, and the four-hour overbought level has reached the same area as the resistance. This creates a strong overlap between momentum and price resistance. If the RSI pushes beyond this momentum limit together with a clean breakout of the resistance zone, the market could see a much stronger acceleration.
Triggers Zone 🎯
The short trigger for TOTAL2 is located lower at the support zone. A breakdown below this area could push TOTAL2 lower and lead to a deeper market correction. On the upside, a clean break of the resistance zone would confirm bullish continuation for ETH and related altcoins.
🛞 Risk Management & Disclaimer
Please remember to always use proper risk management and position sizing. Nothing in this analysis is financial advice. The market can change quickly, so always trade based on your own strategy, research, and risk tolerance. You are fully responsible for your own trades.

Nasdaq Eyes Resistance: Pullback Before Year-End Highs?The Nasdaq posted another strong 2% rally yesterday, even after New York’s opening session swept liquidity by hunting early long positions before reversing higher. This behavior suggests that smart money continues to accumulate positions on dips. Currently, price is pressing into a key resistance zone, which has historically triggered short-term pullbacks. For today, a reasonable scenario would be a final tap into this resistance, followed by a retracement toward the Previous Day’s High (PDH)—a level that may now act as fresh support for bullish continuation.
From a fundamental perspective, investors remain optimistic as the market increasingly prices in the likelihood of a Federal Reserve rate cut in December, which historically boosts tech-heavy indices like the Nasdaq. Additionally, overall risk sentiment has improved, supported by strong corporate earnings and stabilizing inflation trends. If momentum continues, the Nasdaq could be setting up for a push toward new highs into year-end.

EURUSD: Breakout Confirmation or Pullback Setup?EURUSD appears to have broken out of its recent consolidation range, showing early signs of bullish continuation. Today, a pullback toward the 1.056 zone (your 1.56 appears to be 1.056 in market terms) would be healthy before another upward attempt. European economic data has recently come out stable and in line with expectations, supporting EUR strength and reducing recessionary pressure in the short term.
On the technical side, EURUSD is now trading above short-term structure, forming HLs and a clean bullish market structure break. Holding above 1.056 would open the door to a continuation toward 1.060–1.064, especially if US data continues to weaken the dollar.
However, if 1.056 breaks down, price may easily revisit 1.054—the previous consolidation support and liquidity zone.
Upcoming catalysts include:
US data releases that may weaken USD if rate-cut expectations rise.
Eurozone inflation/PMI readings, which have stabilized and are giving the euro some breathing room.
Key Points (Short Summary)
EURUSD broke out of consolidation yesterday.
Likely pullback to 1.056 before continuation higher.
Stable Eurozone data supports EUR strength.
Above 1.056 → targets 1.060–1.064.
Break below 1.056 → revisit 1.054.
USD weakness depends on upcoming US data and rate-cut expectations.
If you want a 40-word summary or a title for TradingView, I can provide it.
OANDA:EURUSD
