Gold short-term biasLooking at the Supply levels, am bearish for now on XAU until price breaks the high of the upper supply
Candlestick Analysis

Gold Sells?Low probability Sells at Supply zone?. Am taking this.
Risk little and manage your trade.

Long trade 📘 AUDNZD – Trade Journal Entry (15-Min Chart)
Mon 24th Nov 25 — 7:30 am — London Session AM
Buyside Trade
🟦 TRADE SUMMARY
Pair: AUDNZD
Direction: Buyside Trade
Date: Mon 24 Nov 25
Time: 7:30 am
Session: London Session AM
Timeframe: 15m
🟩 TRADE PARAMETERS
Entry: 1.14959
Profit Level: 1.15227 (+0.23%)
Stop Level: 1.14894 (–0.06%)
Risk-to-Reward: 5.06 R
Entry Logic
✔ Deep discount PD array
✔ Bullish OB at 1.1489
✔ 15m FVG (discount side)
✔ EMAs flipping supportive
✔ London session timing
🟨 MARKET CONTEXT & STRUCTURE
1. Higher-Timeframe Context
AUDNZD printed a large structural decline, then formed a major discount accumulation zone at 1.1470–1.1500.
15min TF overview
The chart clearly shows a macro BOS before the drop, followed by a return to deep discount. The recent sell-off filled multiple HTF FVGs and tagged a major liquidity shelf (multi-session support).
2. Intraday Microstructure
London session engineered: A double-bottom sweep at 1.1480
Followed by a displacement above 1.1500. Price reacted strongly from the 1.1481–1.1489 OB/FVG region.
5min TF overview
EMAs:
50 EMA curling upward, 200 EMA flattening, early shift to bullish tone. We assume this confirms the intraday shift to bullish order flow
🟪 LIQUIDITY
Sell-Side Liquidity Taken
Asia + Pre-London equal lows swept (1.1481–1.1484). Deepest sweep comes at the “Low Wick” where we have wick the mid section (0.5) of the PD array. We assume this final inducement clears all sell-side liquidity below the accumulation range.
Buyside Liquidity Draws
Internal buyside inefficiencies: 1.1512–1.1520. The 15m FVG at 1.1530. Above that → multi-session supply at 1.1550–1.1578. TP sits inside the first premium inefficiency.
🟩 VOLUME & CONFIRMATION
Volume spikes confirm the spring beneath 1.1480.
Retracement into FVG shows volume contraction → no sellers.
Reclaiming 1.1500 happens on strong bullish volume → institutional footprint.
🟥 OUTLOOK / CONTINUATION
If price holds above 1.1500:
Next continuation targets:
1.1530
1.1550
1.1578 (major HTF supply)
Invalidation:
Break below 1.1487 invalidates the bullish idea.

Long trade
🟦 TRADE SUMMARY
Pair: ONDOUSDT.P
Trade Type: Buyside Trade
Date: Sun 23rd Nov 25
Time: 2:00 pm
Session: NY Session PM
Timeframe: 1H
🟩 TRADE PARAMETERS
Entry: 0.4788
Profit Level: 0.5291 (+10.50%)
Stop Level: 0.4726 (–1.29%)
Risk-to-Reward: 8.11 R
🟨 MARKET CONTEXT & STRUCTURE
ONDO printed a multi-session liquidation leg, clearing sell-side liquidity down into the 0.45–0.46 zone. A double bottom + liquidity grab confirmed the exhaustion of sellers. Lower timeframes printed a 2-hour BOS, followed by an H1 BOS just before the NY PM expansion.
EMAs are beginning to realign:
50 EMA curling upwards
200 EMA flattening
We assume this signals a transition from bearish order flow → accumulation → early markup.
🟫 WYCKOFF ALIGNMENT
Phase ONDO Price Behaviour
Phase A Selling climax followed by AR
Phase B Long consolidation + internal sweeps
Phase C Spring (double bottom + liquidity grab)
Phase D Rally + BOS (your entry confirmation)
Phase E Markup toward premium levels
🟩 VOLUME & CONFIRMATION
Volume spikes appear on impulsive bullish candles, especially at BOS points.
Retracements into OB/FVG zones show volume compression, signalling:
Absorption
Programmatic accumulation
No active distribution

Trade idea on xauusd Here is my outlook, checkout for reactions around these key levels and do your due diligence to apply proper risk management

FireHoseReel | ZEC: Multi-Timeframe Correction Overview🔥 Welcome FireHoseReel !
Let’s dive into the current ZEC structure.
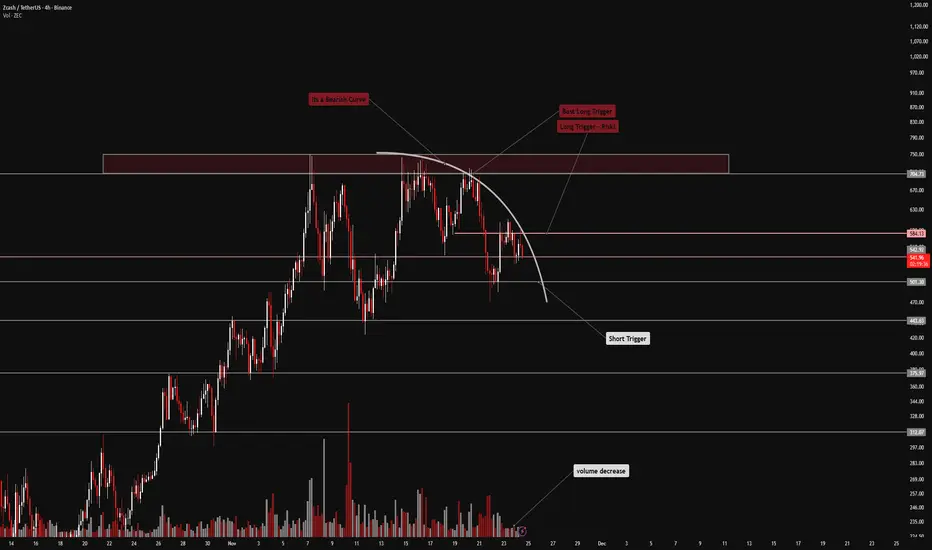
👀 ZEC – 4H Timeframe Analysis
Zcash has formed a strong rally recently and created a local ATH around $750. Since then, price has been consolidating below this level, moving through a multi-timeframe corrective range guided by a bearish curve-line.
Each time price touches this curve, it gets pushed downward—showing strong selling reaction.
We currently have three key triggers for potential ZEC trades, which can provide structured entry points.
📊 Volume Analysis
Volume must be monitored closely to understand the true behavior of ZEC.
During this corrective phase, volume has dropped significantly, indicating reduced participation.
This typically signals that a strong move is near, and once volume surges again, ZEC can give a clean entry opportunity.
🐋 A Different View On ZECBTC Looking at ZEC/BTC helps us better understand whale behavior and institutional positioning.
The ZECBTC chart has about 90% similarity with ZECUSDT.
The main differences appear in how the descending trendline and curve-line are drawn.
The triggers on ZECBTC match closely with the USDT pair, giving strong confirmation between both charts.
✍️ Trading Scenarios
Potential scenarios for ZEC are listed in the analysis and can be used depending on price reaction.
🔼 Long Scenario
A long setup becomes valid when:
Break of $584
• Strong increase in buy volume
• This activates a low-risk long trigger (~0.5% risk).
• Price can then move toward $705, where we expect reactions. If $705 breaks, we can add to • the position (position scaling) and follow ZEC toward a potential new ATH.
🛞 Risk Management & Disclaimer
Please remember to always use proper risk management and position sizing. Nothing in this analysis is financial advice. The market can change quickly, so always trade based on your own strategy, research, and risk tolerance. You are fully responsible for your own trades.
FireHoseReel | Crypto Cap Rising TOTAL Signals Risk On Mode🔥 Welcome FireHoseReel !
Let’s explore the latest TOTAL market setup.
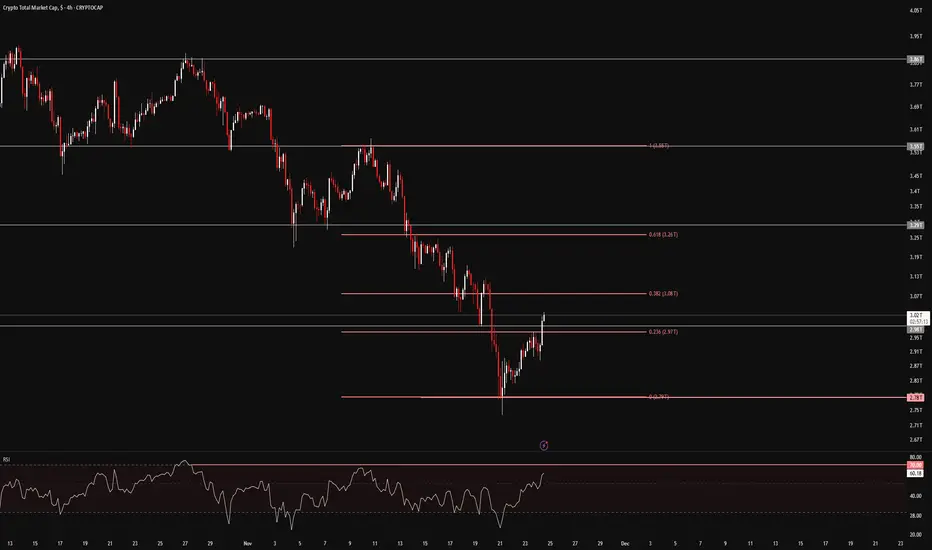
👀 TOTAL – 4H Timeframe Analysis
On the 4-hour chart, TOTAL shows the overall inflow of capital into the crypto market.
Price has successfully broken the 23% Fibonacci retracement level and is now moving toward the 38% zone.
If the 38% level breaks, traders who entered from lower supports can safely add to their position.
📊 RSI Momentum Check
The RSI has crossed above its previous high and has already moved above the 50 level, showing growing bullish momentum.
The next major RSI resistance sits around 70, which aligns perfectly with the 38% Fibonacci level, creating a strong confluence zone.
✔️ Correlation With Bitcoin
TOTAL shows a clear positive convergence with Bitcoin’s chart—both have built strong support levels and are pushing upward.
Institutional investors appear to have formed a solid accumulation base in this area, and the latest confirmations indicate this zone is becoming a reliable bottom.
With capital flowing into the crypto market and Bitcoin gaining momentum, the next moves across the market could be very powerful.
🛞 Risk Management & Disclaimer
Please remember to always use proper risk management and position sizing. Nothing in this analysis is financial advice. The market can change quickly, so always trade based on your own strategy, research, and risk tolerance. You are fully responsible for your own trades.
NASDAQ Analysis – Accumulating at Resistance With Bullish CorrelThe Nasdaq is currently accumulating right beneath a key resistance zone, showing strength despite last week’s volatility. A positive factor heading into today’s session is Bitcoin’s strong weekend recovery — a move that often correlates with green momentum in equity markets, especially tech.
If the Nasdaq manages to break this resistance with conviction, price could push toward the 25,000 trendline during the week, as we are still roughly 2.5% below that level.
The ideal scenario would be:
A strong breakout,
A clean retest of the broken resistance acting as new support, and
A controlled long-position continuation toward 25,000.
As long as accumulation holds and risk sentiment stays positive, the bias remains bullish — waiting for confirmation and a structured entry.

Long trade
📘 GBPUSD – Trade Journal Entry (5-Minute Chart)
Fri 21st Nov 25 — 11:20 am — London Session AM
Buyside Trade
🟦 TRADE SUMMARY
Pair: GBPUSD
Trade Type: Buyside (Intraday)
Date: Fri 21 Nov 25
Time: 11:20 am
Session: London Session AM
Timeframe: 5 min
🟩 TRADE PARAMETERS
Entry: 1.31139
TP1: 1.31327 (+0.31%)
TP2: 1.31449 (+0.50%)
Stop: 1.30763 (–0.56%)
RR: 5.49 R → TP1
RR: 9.03 R → TP2
🟨 MARKET CONTEXT & STRUCTURE
1. Higher-Timeframe Context
GBPUSD was in a macro retracement within a broader bearish leg.
Price had completed a sell-side sweep during the NY PM session on Nov 20, creating a fresh set of inefficiencies. London session on the 21st formed a double sweep profile → first Tokyo lows, then London lows. This created a clean discount PD array for a buyside shift.
🟧 ICT MODEL BREAKDOWN
Model Used: LQ Sweep → BOS → FVG → PD Array Entry
1. Inducement
Multiple equal lows + session liquidity pools taken:
Tokyo → London → early NY
These sweeps load the backside of the curve.
2. Displacement
Strong bullish displacement candle above 1.31070
Breaks market structure and confirms order flow switching long.
3. Entry Logic
Entry sits at:
FVG retracement
Mitigated bullish OB
Discount relative to the daily open
EMAs acting as support
🟫 WYCKOFF ALIGNMENT
Wyckoff Phase GBPUSD Behaviour
Phase A Stopping action near 1.304–1.306
Phase B Choppy range, liquidity build-up
Phase C Spring: double sweep of Tokyo + London lows
Phase D BOS + rally → where entry is located
Phase E Markup to premium (targets 1.313–1.314)

Long trade 🟦 TRADE SUMMARY
Pair: AVAXUSDT.P
Direction: Buyside
Date: Sun, 23rd Nov 2025
Time: 7:00 PM
Session: Tokyo PM
Timeframe: 1H
---
🟩 TRADE PARAMETERS
Entry Price: 13.221
Profit Target:13.735 (+3.88%)
Stop Loss: 13.146 (–0.57%)
Risk-to-Reward Ratio: 6.78 R
---
🟨 MARKET CONTEXT & STRUCTURE
1. Higher-Timeframe Context
AVAX was in a deep markdown leg after heavy distribution on Nov 20–21 (visible volume spike at the selling climax)—a micro-accumulation range formed between 13.05 and 13.25, with repeated liquidity sweeps. The 1H BOS above 13.32 confirms the shift from bearish → bullish order flow.
1Hr TF
2. Intraday Structure
A clean BOS occurred after the NY Session (Nov 23) when the price broke above the structure at 13.28. EMAs show: 50 EMA reclaim, 200 EMA flattening → early bullish alignment.
Price retests:
FVG (13.18–13.23)
Bullish OB at 13.21
Accumulation range low
🟪 LIQUIDITY STORY
Sell-Side Liquidity Clears
London + NY sessions swept liquidity below 13.15 and 13.05.
A deeper liquidity purge into 12.26–12.28 formed the structural low zone.
Buy-Side Liquidity Above
Internal liquidity targets:
13.42
13.56
HTF inefficiencies inside 13.70–13.85
Major buyside magnet: supply zone at 13.77–13.87
🟫 WYCKOFF ALIGNMENT
We assume we are heading towards Phase D (LPS → SOS).
🟩 VOLUME & CONFIRMATION
High volume candle marks the selling climax.
Accumulation shows low-volume downward tests → bullish absorption.
Displacement up from 13.18 shows volume expansion, confirming algorithmic buying.
🟥 OUTLOOK / CONTINUATION
Above 13.32, bullish continuation remains valid.
Key continuation targets:
13.85
14.05
14.30
Invalidation:
Break below 13.12 invalidates the bullish structure.

CHFJPY Risky Counter-Trend TradePrice retested a triple top neckline at (194.451-194.017) and was rejected strongly at the zone forming bearish engulfing candle

FireHoseReel | BNB Daily Analysis #5🔥 Welcome FireHoseReel !
Let’s dive into the analysis of BNB (Binance Coin).
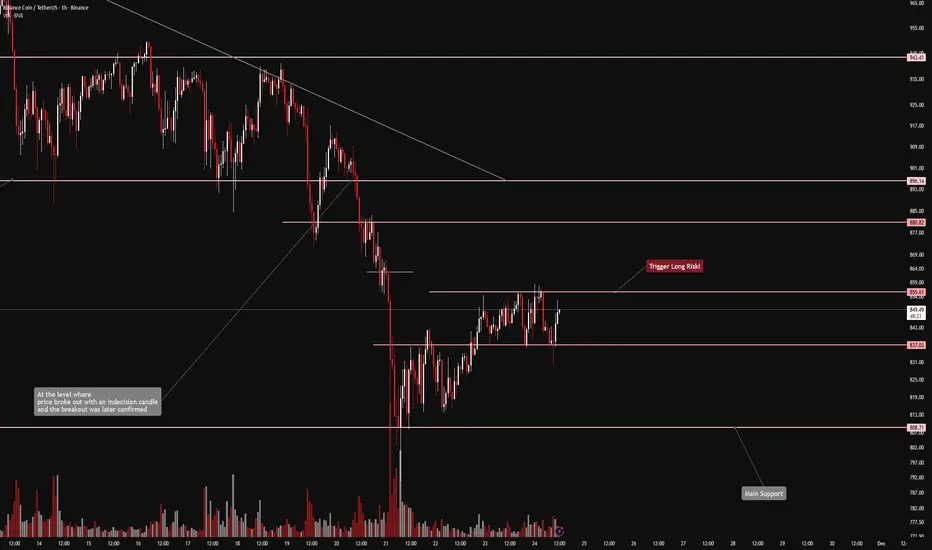
👀 BNB – 1H Timeframe Analysis
On the 1-hour chart, BNB is currently moving inside a clear trading range.
If the top of the range breaks, we get a risky long trigger.
If the bottom breaks, we get a clean short trigger.
We now have to wait and see which direction the market chooses so we can position ourselves accordingly.
Since USDT.D is still high, I personally lean slightly more toward a bullish reaction from BNB.
📊 Volume Indicator Insight
Pay close attention to the volume indicator.
It clearly shows that BNB is range-bound, because volume has been declining inside this box.
A breakout from the range will represent reduced absorption + a new directional move.
So the first strong volume spike will likely give us a valid entry signal.
✔️ A Different Perspective – BNB/BTC Pair Checking the BNB/BTC pair helps a lot.
Just like before, it’s still moving inside its own box, but currently leaning slightly downward.
This means BNBUSDT is behaving similarly to BTCUSDT, and the triggers become much clearer when analyzing both pairs together.
Trading Scenarios
Related entry scenarios are written in the continuation of the analysis and can be used depending on how price reacts.
🔼 Risky Long Scenario
A long position becomes valid if:
• $855.61 resistance breaks, and
• A noticeable increase in buy volume confirms a clean breakout from the trading range.
🛞 Risk Management & Disclaimer
Please remember to always use proper risk management and position sizing. Nothing in this analysis is financial advice. The market can change quickly, so always trade based on your own strategy, research, and risk tolerance. You are fully responsible for your own trades.
Long trade 📘 BTCUSDT.P – Trade Journal Entry
🟦 Trade summary
Pair: BTCUSDT.P
Trade Type: Buyside Trade
Date: Sat 22nd Nov 25
Time: 9:30 pm
Session: Tokyo Session PM
Timeframe: 15 min
🟩 Trade parameters
Entry: 86,169.4
Profit Level: 91,000.0 (+5.60%)
Stop Level: 82,523.8 (–4.02%)
Risk-to-Reward: 5.46 R
🟨 Market context and structure
The market was in a 3-session decline (Tokyo → London → NY), forming an extended liquidity run to the downside. Repeated sell-side sweeps occurred near 85.0–85.6k, creating inducement for a buyside reversal. Descending channel/compression structure developed leading into NY PM. THE NY PM session formed the first bullish displacement after the sweep, confirming the intraday shift.
🟪 Liquidity
Sell-side liquidity was taken below the Asian + London lows.
The final low sweep occurred just before NY PM delivery.
Multiple FVGs (Fair Value Gaps) printed on the bullish expansion up from 85.5k → 86.5k.
A clean FVG retest + orderblock interaction created your entry model.
Liquidity Path:
Model: Sell-side sweep → Displacement → FVG → OB retest → Buyside target (91k)
🟫 Whykoff Aligment
Phase BTC Price Action
Phase B Wide, aggressive markdown with sweeps
Phase C Final sell-side sweep into NY PM
Phase D Rally through structure + LPS retest
Phase E Expansion toward buyside inefficiencies
We assume BTC now reflects a Phase C → D transition into markup.
🟩 Volume and confirmation
NY PM shows volume expansion only on bullish candles. Retracements back into the FVG show volume contraction, confirming programmatic buy-side control.
🟥 Outlook/Continuation
Holding above 86.3–86.5k = continuation probable. Potential upside magnet sits around 92.2–93k premium where macro inefficiencies remain open. Invalidation: Return below 85.6k kills the intraday buyside premise.

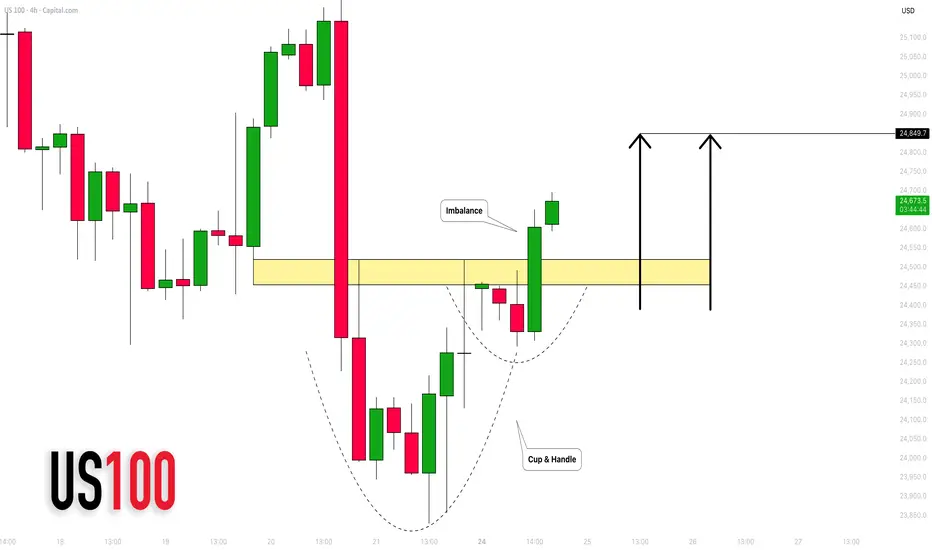
NASDAQ INDEX (US100): Strong Bullish Pattern
There is a high chance that US100 will rise
after a formation of a cup & handle pattern on a 4h time frame
with a breakout of its neckline with a bullish imbalance.
Expect a rise at least to 24850
❤️Please, support my work with like, thank you!❤️
I am part of Trade Nation's Influencer program and receive a monthly fee for using their TradingView charts in my analysis.
Long trade
15min
📘 TRXUSDT.P – Trade Journal Entry (15-Min Chart)
Sat 22nd Nov 25 — 3:00 pm — NY Session PM
Buyside Trade
🟦 TRADE SUMMARY (Tab 1 — Blue)
Pair: TRXUSDT.P
Direction: Buyside Trade
Date: Sat 22nd Nov 25
Time: 3:00 pm
Session: NY Session PM
Timeframe: 15m
🟩 TRADE PARAMETERS (Tab 2 — Green Transparent)
Entry: 0.27588
Profit Level: 0.27784 (+1.52%)
Stop Level: 0.27352 (–0.13%)
Risk-to-Reward: 11.56 R
30min
🟨 MARKET CONTEXT & STRUCTURE
1. Trend Context
TRX recovered from a heavy markdown cycle seen on the 30m structure.
The 15m chart shows a micro accumulation zone beneath the 200 EMA, then a displacement above the structure. NY PM session creates a clean shift in order flow, reclaiming: The NY AM high, the FVG left during the earlier breakdown and the intraday session midpoint
2. Key Structure Points
BOS at 0.2754 marks a bullish transition.
The 50 EMA flips upward and crosses the 200 EMA — momentum confirmation.
Series of higher lows formed after the BOS → clear buyside continuation model.
🟪 LIQUIDITY
Sell-Side Liquidity Removed
Liquidity swept below 0.2738, creating a final inducement.
NY PM grabs sell-side beneath the Asian and London session lows.
This clears the path for Algorithmic Repricing.
Buyside Liquidity Targets
First cluster at 0.2775–0.2780
HTF resistance levels at 0.2795–0.2802
TP lands inside the first premium inefficiency.
Liquidity Narrative Summary
Sweep → Displacement → FVG → OB Tap → Expansion (buyside model)
🟧 ICT MODEL BREAKDOWN
Model Used: Sell-Side Sweep → BOS → FVG → PD Array → Buyside Delivery
1. Inducement
London + Tokyo lows + NY early lows all swept before entry.
2. Displacement
Strong bullish displacement candle breaks above the 0.27540 BOS level.
3. Entry Type
Entry sits directly inside a:
Bullish FVG
Discount Retracement (OTE zone)
Order Block Retest
Aligned with session timing (NY PM)
4. Target Logic
TP hits first internal buyside inefficiency.
Secondary targets remain valid at 0.2795–0.2810.
🟫 WYCKOFF ALIGNMENT
Phase TRX Reaction
Phase A Selling climax & AR
Phase B Accumulation under 50/200 EMA
Phase C Spring: final liquidity sweep at 0.2738
Phase D SOS + LPS zone (Entry 0.27588)
Phase E Markup into buyside targets
🟩 VOLUME & CONFIRMATION
Volume spikes confirmed the BOS.
Retracement into FVG shows volume tapering → bullish absorption.
No heavy sell volume returned — confirming algorithmic buy program.
🟥 OUTLOOK / CONTINUATION
If TRX holds above 0.2750–0.2753, further markup remains likely.
Extended upside zones:
0.2800
0.2820–0.2830
Invalidation: Break below 0.2734 kills the buyside idea

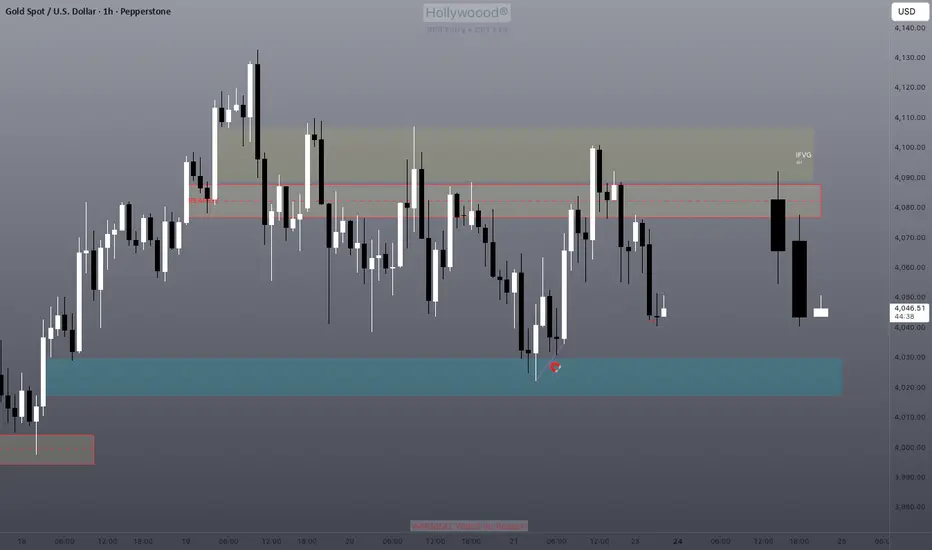
MGC LongsPrice is forming a rounded double-bottom structure right on the rising trendline (blue), suggesting buyers are quietly stepping back in after multiple rejections from the lower demand zone (4,050–4,060).
We’re currently pushing into a key mid-range resistance at 4,085–4,095. This level has acted as a heavy decision zone for several sessions, so I’m watching for one of two things:
Primary Bias (Bullish)
A controlled pullback into the 4,060–4,065 demand zone
Buyers hold structure above the trendline and EMAs
Break and hold above 4,090
Then continuation toward 4,110 → 4,130 liquidity pockets
The white projection illustrates the ideal retest-and-continue scenario.
Key Notes
EMAs are beginning to curl up and tighten — early sign of momentum shift
Liquidity sits above 4,105–4,115 from prior wicks
Clean invalidation below the trendline / demand at 4,050
Overall, this is a reversal-structure forming at higher-timeframe support, with a potential push into the next major supply zone if intraday demand continues to hold.

Nifty Analysis EOD – November 24, 2025 – Monday🟢 Nifty Analysis EOD – November 24, 2025 – Monday 🔴
Bears Seize Control: Close on Critical Fib Zone Confirms Short-Term Retracement.
🗞 Nifty Summary
The Nifty opened with a misleading 70-point Gap Up. This gap was quickly filled within minutes, finding brief support at the Previous Day’s Close (PDC). The subsequent rally was capped at the major resistance juncture of CDH + IBH + CDO and a key trendline, which successfully pushed the price back toward the day’s low.
After finding rescue near the 26075 zone, Nifty was stuck in a tight 25-30 point range for two hours. This consolidation was followed by a sharp breakdown around 2:00 PM, and a final free fall at 3:00 PM toward the 25940 zone.
The day’s low was marked at 25,911, and the index closed near the low at 25,943.35, resulting in a loss of -108.65 points (-0.42%). The overall day was clearly driven by sellers, closing on the important support band of 25940 ~ 25950.
The daily candle forms a Lower High – Lower Low (LH-LL) structure, confirming a short-term retracement.
🛡 5 Min Intraday Chart with Levels
🛡 Intraday Walk
The initial bullish gap was a clear trap, as selling pressure immediately took over and restricted upside momentum. The prolonged consolidation near 26075 was the calm before the storm. The decisive breakdown in the afternoon, marked by the long-term trendline penetration, signaled a shift in short-term control to the bears.
The close on the critical Fibonacci zone (25940 ~ 25950) means the immediate bias for tomorrow is highly contingent on the opening and subsequent action.
Intraday traders must now prepare for moves in both directions; a long play should look for a successful retracement of the fall, while short plays can aim for 25850 and 25725.
📉 Daily Time Frame Chart with Intraday Levels
🕯 Daily Candle Breakdown
Open: 26,122.80
High: 26,142.80
Low: 25,912.15
Close: 25,959.50
Change: −108.65 (−0.42%)
🏗️ Structure Breakdown
Type: Strong Bearish candle.
Range (High–Low): ≈ 231 points — demonstrating high intraday volatility.
Body: ≈ 163 points — reflecting strong, continuous downside pressure.
Upper Wick: ≈ 20 points — confirming failure to sustain the initial gap-up.
Lower Wick: ≈ 47 points — buyers attempted to defend the low, but the close remained bearish.
📚 Interpretation
The candle is a definitive bearish structure, characterized by its LH-LL formation compared to the previous day. This strongly suggests that the index has started a short-term retracement phase. The close right on the critical support level (25950) means the market is at a crossroads. If tomorrow’s session fails to trade and close above today’s low, the downside scenario toward deeper supports will become highly probable.
🕯 Candle Type
Bearish Candle (LH-LL Formation) — Confirms short-term trend reversal/retracement.
🛡 5 Min Intraday Chart
⚔️ Gladiator Strategy Update
ATR: 194.97
IB Range: 72.85 → Medium
Market Structure: Balanced
Trade Highlights:
10:12 Long Trade - Trailing SL Hit
12:32 Short Trade - SL Hit
14:20 Short Trade - Target Hit (R:R 1:1.5)
Trade Summary: The choppy, two-sided nature of the session around the consolidation zone led to mixed results. The strategy successfully capitalized on the afternoon breakdown with the profitable short trade, aligning with the day’s dominant bearish momentum.
🧱 Support & Resistance Levels
Resistance Zones:
26000 (Immediate Psychological)
26040 ~ 26075
26104
26135
26180
Support Zones:
25950 ~ 25940 (Critical Fib/Current Support)
25860 ~ 25840
25740 ~ 25715
🧠 Final Thoughts
“We are sitting directly on the short-term inflection point.”
The decisive break and close at 25940 ~ 25950 puts the market in a precarious position. The bias for Tuesday hinges entirely on the action at this level.
A continuation of selling pressure, pushing the Nifty below 25911 and holding, will target 25860 next. Only a strong, sustained move back above 26040 can negate the current bearish short-term structure.
✏️ Disclaimer
This is just my personal viewpoint. Always consult your financial advisor before taking any action.

Long trade 📘 EURJPY – Trade Journal Entry (15-Min Chart)
Mon 24th Nov 25 — 6:00 am — London Session AM
Buyside Trade
🟦 TRADE SUMMARY
Pair: EURJPY
Direction: Buyside
Date: Mon 24 Nov 25
Time: 6:00 am
Session: London Session AM
Timeframe: 15m
🟩 TRADE PARAMETERS
Entry: 180.878
Profit Level: 181.603 (+0.40%)
Stop Level: 180.802 (–0.04%)
Risk-to-Reward: 9.54 R
🟧 ICT MODEL BREAKDOWN
Model Used: SLL Sweep → OTE → BOS → FVG → Entry → Buyside Delivery
1. Inducement
Triple sweep of TF lows across Asia, Pre-LDN, and LDN warm-up.
2. Displacement
Strong BOS candle at 180.78 with large volume spike.
Two clean FVGs form in the 180.62–180.80 region.
5min TF
3. Entry Zone
Entry sits:
Inside bullish FVG
At the 62–70% fib retracement (OTE)
On top of London OB
Directly above protected low
Beneath 50 EMA + reclaim → bullish power shift
4. Target Logic
First target: fill inefficiency at 181.15
Second target: 181.60 TP
Clear premium array target.
🟫 WYCKOFF ALIGNMENT
Phase EURJPY Behaviour
A Shakeout of weak longs → move into range
B Accumulation under 181.00 key level
C Spring at 180.30 (deep liquidity grab)
D SOS & LPSR → Entry 180.878
E Markup towards buyside target
15min TF
We assume entry is positioned at the Phase C → D transition,
the strongest point of structural alignment.
🟩 VOLUME & CONFIRMATION
Heavy bearish volume during liquidity sweep (capitulation).
Volume drops during retrace → bullish absorption.
BOS candle shows volume expansion → institutional entry.
No distribution signs appear before continuation.
🟥 OUTLOOK / CONTINUATION
Continuation Zones
181.70
182.00 (major liquidity pool)
182.45 (HTF imbalance)
Invalidation
A break below 180.72 invalidates the buyside continuation.

EURUSD AnalysisEURUSD is currently consolidating between 1.55 and 1.50, sitting right between the 0.618 and 0.786 Fibonacci levels. I would like to see another bounce from this strong support zone, pushing price back toward the 0.618 level, and ideally breaking above it to target 1.60 later this week.
On the bearish side, if EURUSD breaks below support and loses the 0.786 fib level, price could move quickly to 1.47, completing the fractal. From there, we might see either a strong bullish rejection and a new upward structure—or continued downside, supported by the recent strength of the USD, especially as markets price out rate-cut expectations.

Bitcoin Report — Is the sell-off over?Short answer: Not proven yet. Price is at a critical support area (≈ 85k–90k) after heavy selling; a bounce is possible but downside risks remain wide if that support fails.
Key technical facts
Current support zone: ~85,000–90,000 — price has bounced here recently and printed notable wicks around 80k during the weekend, showing buying interest. If this holds we may see consolidation in the 80–90k band.
Downside liquidity gap: There’s little on-chain / order-book support between 83k and 75k, so a break of 83k could accelerate a drop toward ~75k quickly.
Brave New Coin
+1
Momentum & structure: Market shows lower highs / lower lows and strong bearish candles—classic continuation structure until proven otherwise. Short-term oversold readings increase probability of a bounce or range, not a clean reversal.
CoinDesk
Fundamental drivers (why traders should care)
ETF flows: U.S. spot Bitcoin ETFs have seen record outflows this month, a big headwind to price (reduces institutional bid). This means less structural support and more sensitivity to risk-off moves.
CoinDesk
+1
Macro (Fed / USD): Market pricing around Fed rate cuts is moving; if expectations for no December cut stick, the USD stays strong and risk assets (incl. BTC) remain pressured. Recent news shows cut probabilities have weakened.
Reuters
+1
Miners / supply dynamics: Recent on-chain signals show miners moving from heavy selling toward more accumulation, which could reduce sell pressure over time — but this is early and not yet decisive.
The Coin Republic
+1
Practical trading plan (two scenarios)
Bullish (probability: conditional):
Condition: Clear double-bottom / strong bullish reversal candle in 85–90k zone + improving ETF flow or weaker USD.
Entry: Scaled longs on confirmed bounce (e.g., reclaim of local resistance).
Targets: 95k → 100k+.
Stop: below the weekend wick low (protect vs fast gap down).
Bearish (higher-probability while structure is bearish):
Condition: Close below 83k or failed bounce (strong bearish candle).
Entry: Short on break and retest or on conviction close below 83k.
Target: ~75k (fast path, low liquidity).
Stop: back above retest level / broken support.
Risks & timing
Weekend liquidity and ETF flow volatility can cause violent moves; use smaller size and wider stops.
Macro surprises (Fed commentary, US data) can quickly flip USD/risk dynamics — always check the economic calendar.
Bottom line: A bounce around 85–90k is plausible and would likely produce a choppy consolidation. But until 83k holds and macro/ETF flows stabilise, the door to 75k remains open. Trade small, wait for confirmation (retests / clean reversal candles), and manage risk tightly.

3rd time lucky? (EUR/JPY)Setup
Bullish trend is overbought - short term bearish
Bearish Shooting star pattern on weekly chart (this is the 3rd one - the previous two didn't work out - 3rd time lucky?)
Bearish Evening star pattern on daily chart
Daily RSI down from very overbought reading
Price well above 20/50 day moving average zone
Commentary
There have been no meaningful corrections since the bullish trend began at 155. A large reversal from above 180 could be the start of one.
Strategy
Sell rebound towards supply zone starting at 182
Sell on break below last week’s low price (179.80)

FireHoseReel | WLFI: Ready to Explode, Don’t Get Left Behind🔥 Welcome FireHoseReel !
Let’s break down what’s happening with WLFI right now.
👀 WLFI – 4H Technical Breakdown
WLFI has successfully broken its 4H dynamic resistance and has already completed a clean pullback retest.
Price is now pushing into the 4H box top, and a confirmed breakout above this zone will activate our long trigger, giving us a valid entry setup.
📊 Volume Analysis – Key Factor for Breakout
Multi-timeframe volume is increasing as WLFI approaches this resistance.
This time, the breakout attempt is backed by stronger buy volume + a clean curve-line break, unlike previous attempts where price showed volume divergence and failed to break through.
For WLFI, volume is the critical element—without strong volume, this resistance has historically rejected price.
✔️ WLFI/BTC Pair Note
The WLFI/BTC pair isn’t very useful for analysis since it’s only listed on Upbit, and the chart lacks structure and clarity.
Because of that, we rely mainly on the WLFI/USDT pair, which currently shows solid momentum toward a breakout.
✍️ Long Scenario setup becomes valid with:
• Breakout above 0.1602
• Clear volume convergence + increasing buy pressure
• A structure that forms a higher high outside the 4H box
• You can also wait for a break-and-retest (pullback) of this resistance to enter.
This entry is slightly riskier but gives a cleaner confirmation if the pullback candle forms an indecision/rejection setup.
🛞 Risk Management & Disclaimer
Please remember to always use proper risk management and position sizing. Nothing in this analysis is financial advice. The market can change quickly, so always trade based on your own strategy, research, and risk tolerance. You are fully responsible for your own trades.

Imbalance below range seems to be the current targetBlue zone is the bullish imbalance that was left behind last week.
Price only targets lows or imbalances below support during sell-offs. Let's see what we get with this one.