XLM — Stellar Lumens: AI x RWA, Real Utility, Real Momentum⭐️ XLM — Stellar Lumens: AI x RWA, Real Utility, Real Momentum
Buy/Hold bias aiming for $0.75 🎯; reload zone ~ $0.25 🔁.
Thesis rests on tokenization (RWA) traction, US gov data on-chain, and 2025 scaling roadmap (5k TPS target, faster blocks) + AI tooling around Soroban. If thesis plays out, upside case ≈ +200% from reload—not financial advice.
________________________________________
🔥 Why now (meaningful catalysts)
• US Dept. of Commerce → GDP on Stellar
First time ever: the Commerce Department is putting official GDP data on-chain (hash) on Stellar, creating an immutable, public record—big signal for gov-grade data + DeFi oracles. (Stellar)
• RWA push: new partners & capital-market pipes
SDF’s 2025 goal: $3B RWA value & $110B volume; continuing integrations with Franklin Templeton, Paxos, Ondo, SG Forge. Recent Archax investment targets regulated tokenization rails. (CoinDesk, Stellar)
• Scaling roadmap → utility unlocks
Targeting ~5,000 TPS, 2.5s blocks, OpenZeppelin token standards, and 100× payout capacity (Merkle trees). These hit the exact pain points for enterprise/RWA and payments at scale. (Stellar)
________________________________________
🤖 The AI angle (pipeline + tools)
• Official roadmap AI
o Stella AI Assistant (enhanced) → a more capable agent interface for builders.
o Contract Copilot → AI-assisted smart-contract generation, linting & testing.
These live on SDF’s 2025 roadmap. (Stellar)
• Community AI on Soroban
o AI Agent Kit: lets AI agents interact with Stellar accounts & Soroban contracts.
o SoroBuilder: AI-driven in-browser Soroban contract builder/auditor.
o AI Transparency Token (AITT): compliance attestations on-chain. (Stellar Community Fund)
Net: AI lowers dev friction (faster dApp iteration) and expands use cases (agents, audits, compliance)—a pull for builders who need programmable money + verifiable data.
________________________________________
🧱 Building blocks already in place
• Smart contracts live (Soroban via Protocol 20) → programmable RWA/DeFi. (Oodles Blockchain)
• Freighter wallet upgrades + RPC/ETL improvements → smoother infra & analytics for apps. (Stellar)
• Stablecoin/RWA breadth (e.g., Franklin’s BENJI, Ondo USDY coming to Stellar) → liquidity primitives that institutions recognize. (Stellar)
________________________________________
📣 Recent social buzz (signal, not noise)
• SDF amplified the GDP-on-chain milestone across socials, triggering wider crypto media pickup.
See SDF’s X post and summary thread references. (X (formerly Twitter))
________________________________________
🧭 Levels & plan (author’s framework)
• Primary target: $0.75 🎯 if catalysts execute (RWA flow + scaling).
• Reload zone: $0.25 🔁 (where bulls re-accumulate in my playbook).
• Positioning: Buy/Hold bias for asymmetric upside tied to execution (RWA + AI-tooling + throughput).
• Risk: headline/regulatory risk on RWAs, roadmap slip, crypto beta. Size accordingly.
Note: A +200% outcome reflects upside math from reload zone to target; it’s not a guarantee. Do your own research.
________________________________________
🗓 What to watch next
• Roadmap drops through Q4-2025:
o 2.5s block times target,
o OpenZeppelin token standards for assets/RWAs,
o Freighter mobile & advanced auth,
o Payouts 100× capacity. (Stellar)
• RWA onboarding flow: progress with Archax, Paxos, Ondo, and Franklin—TVL/volume & issuer announcements. (CoinDesk, Stellar)
• Gov/enterprise data on-chain follow-ups after Commerce/GDP—possible spillover into on-chain data feeds for DeFi. (Stellar
Cardano

ADA Cardano Equilibrium Pullback and Possible Trade Opportunity🔵 ADA (Cardano) on the weekly timeframe is holding a strong bullish trend 📈. We can see price has retraced into the Fibonacci 50–61.8% zone 🔢, which is typically a pullback into equilibrium ⚖️—an area often considered an ideal continuation entry in line with the trend.
👀 My bias remains long, but let’s break it down further:
📊 On the 4H chart, price action suggests a potential base forming—possibly big money accumulation 💼💰. That said, we don’t yet have a decisive break above to confirm.
🔎 Zooming into the 30M chart, the recent downtrend has been compromised with a shift in structure to the upside 🔄📈. What I’m waiting for now is:
1️⃣ An expansion above the previous high
2️⃣ A retracement and retest
3️⃣ A potential buy opportunity in alignment with trend ✅
This setup also aligns with a possible Wyckoff accumulation 📚—we’ve got relative equal lows, and a liquidity spike below could create a springboard for more bullish activity 🌱🚀.
⚠️ This is purely educational and not financial advice 🔒

Cardano kept the uptrend structure ┆ HolderStatBINANCE:ADAUSDT on the 16h chart is holding its higher-highs and higher-lows structure, with strong channel support near 0.82. Bulls are eyeing resistance at 0.96, and a confirmed breakout above this level could fuel the next rally toward 1.05+.

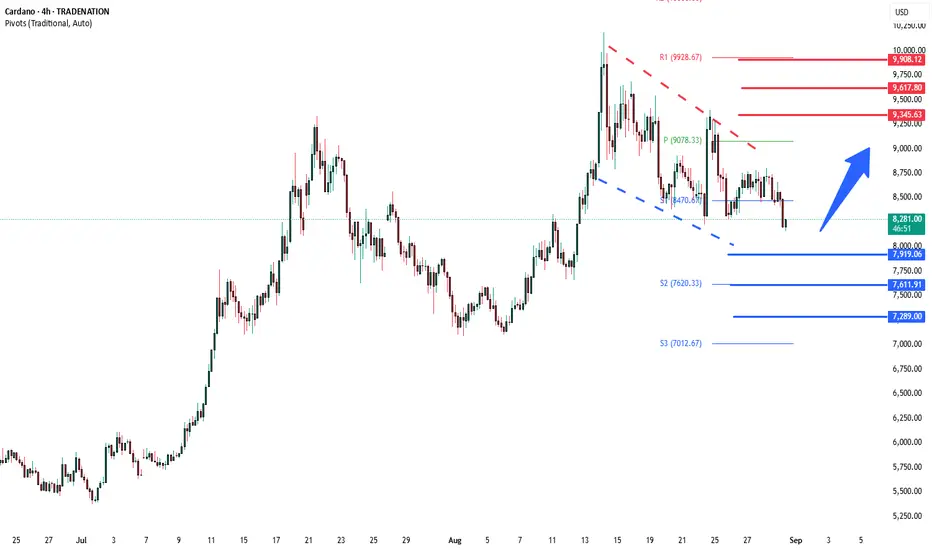
Cardano corrective pullback, support at 7920The ADAUSD remains in a bullish trend, with recent price action showing signs of a corrective pullback within the broader uptrend.
Support Zone: 7920 – a key level from previous consolidation. Price is currently testing or approaching this level.
A bullish rebound from 7920 would confirm ongoing upside momentum, with potential targets at:
9345 – initial resistance
9617 – psychological and structural level
9900 – extended resistance on the longer-term chart
Bearish Scenario:
A confirmed break and daily close below 7920 would weaken the bullish outlook and suggest deeper downside risk toward:
7611 – minor support
7290 – stronger support and potential demand zone
Outlook:
Bullish bias remains intact while the ADAUSD holds above 7920. A sustained break below this level could shift momentum to the downside in the short term.
This communication is for informational purposes only and should not be viewed as any form of recommendation as to a particular course of action or as investment advice. It is not intended as an offer or solicitation for the purchase or sale of any financial instrument or as an official confirmation of any transaction. Opinions, estimates and assumptions expressed herein are made as of the date of this communication and are subject to change without notice. This communication has been prepared based upon information, including market prices, data and other information, believed to be reliable; however, Trade Nation does not warrant its completeness or accuracy. All market prices and market data contained in or attached to this communication are indicative and subject to change without notice.
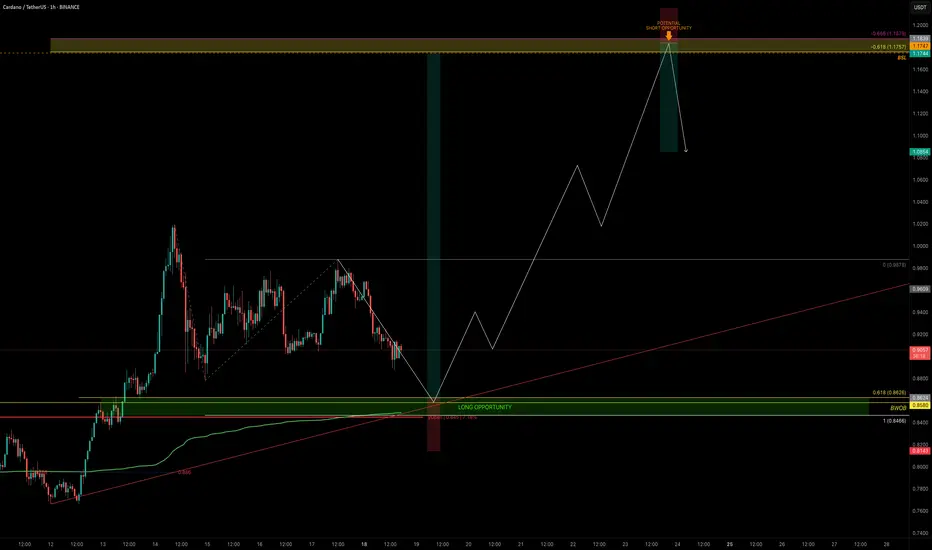
ADA — Is Cardano Ready to Break $1?ADA is coiling just beneath the $1 psychological barrier. The chart is setting up for a decisive move: the high-probability long entry aligns with the yearly open (yOpen), supported by multiple confluences.
🧩 Confluence Factors: 7
Yearly Open (yOpen): $0.845
1.0 Trend-Based Fib Extension: $0.8466 (aligned with yOpen)
Weekly Bullish Order Block: $0.8580
0.618 Fib Retracement: $0.8626
Anchored VWAP (green line): Supporting this zone
Sell-Side Liquidity (SSL): Positioned below recent lows
0.886 Fib Speed Fan: Adding further structural support
🟢 Long Trade Setup
Entry Zone: $0.863 – $0.847
Stop-Loss: Below yOpen (~$0.84)
Take-Profit Zone: $1.1747 (Buy-Side Liquidity sweep)
R:R: 1.6+ depending on SL placement
🔴 Short Opportunity
A secondary setup could arise on a sweep of the key high ($1.1757–$1.1879 BSL zone). This would only be valid with confirmation of rejection.
Entry Zone: After sweep/rejection above $1.1747
Stop-Loss: Above ~$1.20 (post-sweep rejection)
Target: Around $1.10
✍️ Confirmation is critical: the long requires strong defense of the confluence zone, while the short requires a failed breakout and rejection above key high (BSL).
Key Levels to Watch:
Support Zone: $0.863 – $0.847
Resistance / GP Zone: $1.1757 – $1.1879
🔍 Indicators used:
DriftLine — Pivot Open Zones → For identifying key yearly/monthly/weekly/daily opens that act as major S/R reference points
➡️ Available for free. You can find it on my profile under “Scripts” and apply it directly to your charts for extra confluence when planning your trades.
_________________________________
💬 If you found this helpful, drop a like and comment!
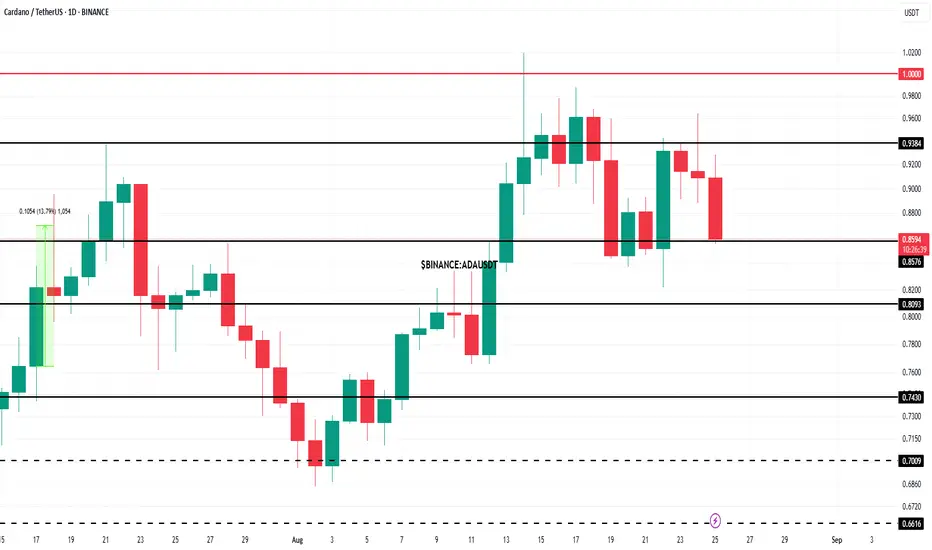
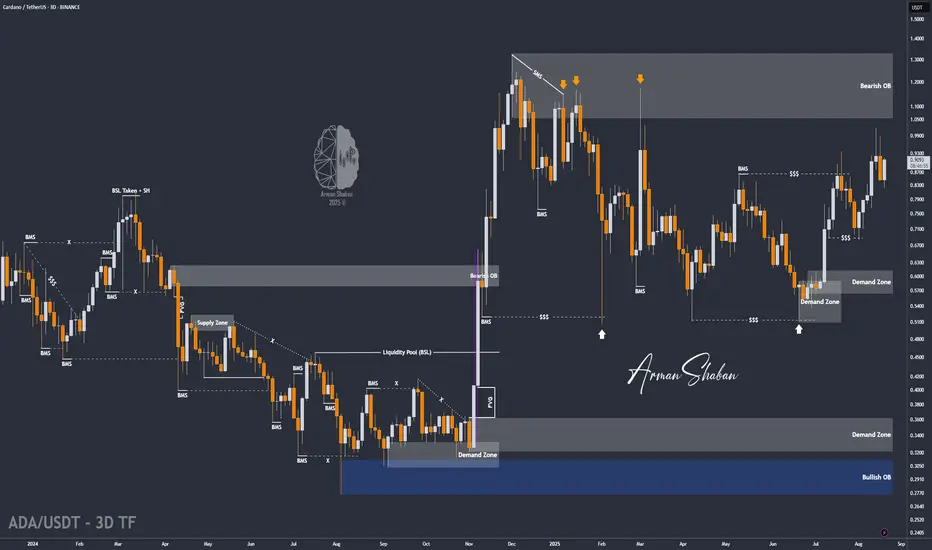
ADA/USDT | Cardano (ADA) Eyes Further Gains – Key Targets Ahead!By analyzing the Cardano (ADA) chart on the 3-day timeframe, we can see that after a corrective move down to $0.83, the price has gained strong buying momentum and has so far managed to rise to $0.87. If the price can hold above this key support level, we can expect further bullish continuation.
The potential upside targets are set at $0.93, $1.00, and $1.05.
Please support me with your likes and comments to motivate me to share more analysis with you and share your opinion about the possible trend of this chart with me !
Best Regards , Arman Shaban

Cardano ADAUSD uptrend continuation support at 8,220The ADAUSD remains in a bullish trend, with recent price action showing signs of a corrective pullback within the broader uptrend.
Support Zone: 8,220 – a key level from previous consolidation. Price is currently testing or approaching this level.
A bullish rebound from 8,220 would confirm ongoing upside momentum, with potential targets at:
9,340 – initial resistance
9,620 – psychological and structural level
9,900 – extended resistance on the longer-term chart
Bearish Scenario:
A confirmed break and daily close below 8,220 would weaken the bullish outlook and suggest deeper downside risk toward:
7,920 – minor support
7,610 – stronger support and potential demand zone
Outlook:
Bullish bias remains intact while the ADAUSD holds above 8,220. A sustained break below this level could shift momentum to the downside in the short term.
This communication is for informational purposes only and should not be viewed as any form of recommendation as to a particular course of action or as investment advice. It is not intended as an offer or solicitation for the purchase or sale of any financial instrument or as an official confirmation of any transaction. Opinions, estimates and assumptions expressed herein are made as of the date of this communication and are subject to change without notice. This communication has been prepared based upon information, including market prices, data and other information, believed to be reliable; however, Trade Nation does not warrant its completeness or accuracy. All market prices and market data contained in or attached to this communication are indicative and subject to change without notice.

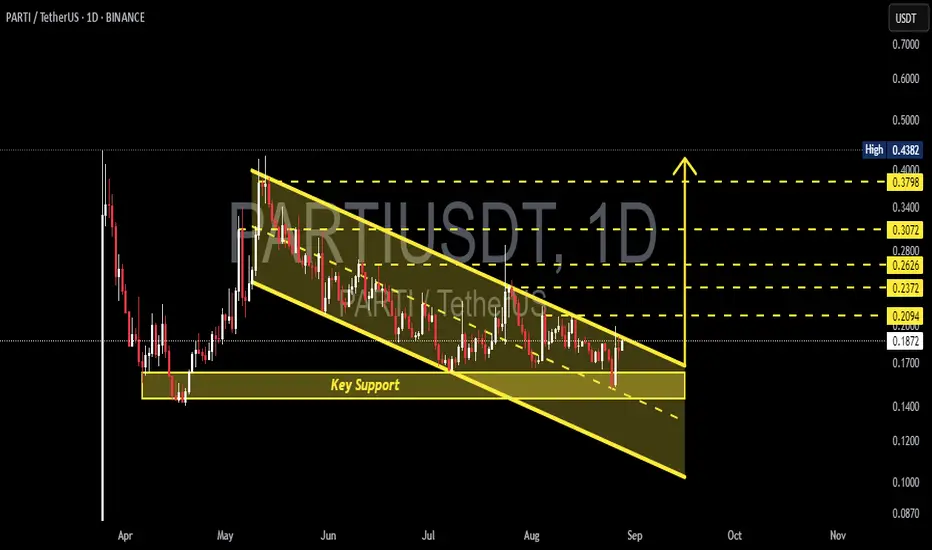
PARTI/USDT — Descending Channel & Key Support Zone!🔎 Market Structure & Pattern
Since May 2025, PARTI has been trading within a clear descending channel, forming consistent lower highs and lower lows.
Current price is around 0.187 USDT, sitting near the channel mid-line and close to the upper trendline resistance.
A key support zone lies between 0.14–0.16 USDT, which has historically acted as a strong demand area.
This setup often suggests a continuation of the bearish trend, but it can also turn into an accumulation pattern if a breakout occurs.
---
🟢 Bullish Scenario
Bullish potential will be unlocked if the price breaks out of the descending channel.
Breakout confirmation: Daily close above the upper trendline and above 0.2094 USDT.
Upside targets:
🎯 0.2094 → breakout trigger
🎯 0.2372 → intermediate resistance
🎯 0.2626 → short-term swing target
🎯 0.3072 → main breakout target
🎯 0.3798 – 0.4382 → major resistance zone (over 100% upside from current levels if confirmed)
Key factor: Breakout must be supported by increasing volume, otherwise it risks being a fake breakout.
---
🔴 Bearish Scenario
If the price fails to break out and gets rejected at the channel resistance:
Bearish confirmation: Rejection at the upper trendline or failure to hold above 0.187 / 0.16.
Downside targets:
🕳️ 0.16 → first support
🕳️ 0.14 → lower edge of key support zone
🕳️ A breakdown below 0.14 could lead to 0.10 – 0.12 USDT, the next potential demand zone.
A strong breakdown with volume would confirm continuation of the bearish trend.
---
📌 Key Technical Levels
Main Support: 0.14 – 0.16 (critical demand zone)
Key Resistance: 0.2094 (bullish trigger)
Upside Targets: 0.2372 | 0.2626 | 0.3072 | 0.3798
Bullish Invalidation: Daily close below 0.14
---
🧠 Conclusion & Bias
Currently, PARTI remains in a downtrend within the descending channel. However, price is approaching a decision zone at the key support (0.14–0.16).
If support holds + breakout occurs: A bullish reversal toward 0.237 / 0.262 / 0.307 is possible.
If support fails: Expect continuation of the bearish trend, targeting 0.12 or even lower.
👉 This is a critical decision point for PARTI — the next move will confirm whether we see a bullish reversal or a bearish continuation.
#PARTI #Crypto #TechnicalAnalysis #DescendingChannel #Breakout #BearishTrend #BullishReversal #PriceAction #SupportResistance #Altcoins #CryptoAnalysis
ADA : BUY OR SELL?Hello friends
Well, after the decline we had, the price was able to create a small channel in the specified support area, which indicates the accumulation of the price, and if the support is maintained and the channel is broken, the price can move to the specified targets.
Otherwise, and if the support is broken, the decline will continue with a valid formation...
*Trade safely with us*

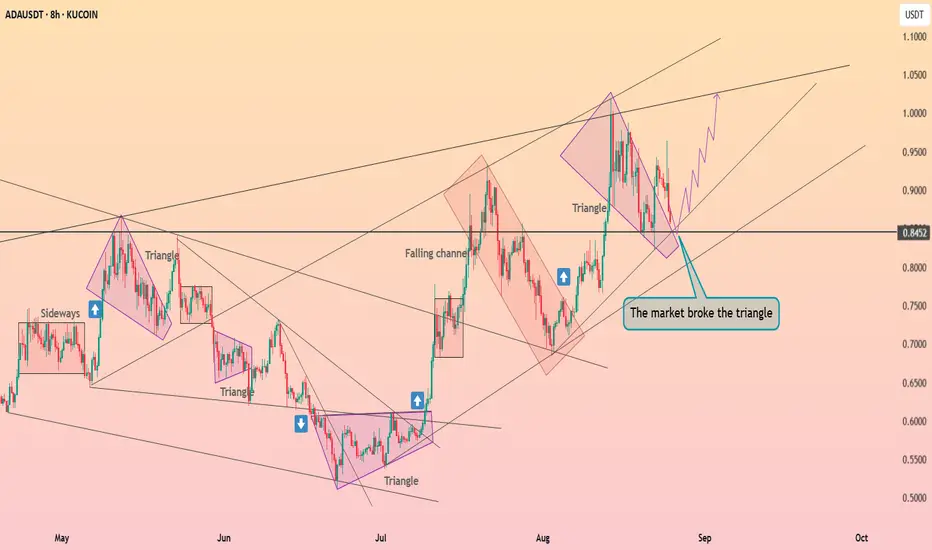
Cardano broke the triangle ┆ HolderStatBINANCE:ADAUSDT on the 8h timeframe broke cleanly out of a triangle pattern around $0.85. The market had earlier respected support from a falling channel and is now showing a bullish structure of higher lows. Continuation above $0.88 could trigger a rally toward $0.95 and $1.00, while maintaining $0.84 as the key invalidation level.
SHELLUSDT —Accumulation Phase or Breakdown?📌 Overall Chart Overview
Currently, SHELLUSDT is trading within a Descending Triangle pattern on the daily timeframe. This structure is characterized by lower highs pressing down through a descending trendline, while the bottom side is being defended by a strong demand zone at 0.13 – 0.15 (yellow box).
This setup signals that the market is in a tug-of-war phase: sellers are consistently applying pressure, yet buyers are still holding the line at support. The outcome of this compression will likely lead to a major move in the coming weeks.
---
🔼 Bullish Scenario (Breakout)
If the price manages to close above 0.15 and break through the descending trendline:
It would confirm a bullish breakout, signaling the potential start of a short-term trend reversal.
Upside targets to watch:
T1: 0.2047 (minor resistance)
T2: 0.2275 – 0.2400 (supply zone)
T3: 0.2600 (psychological resistance)
Extension: 0.3301 (major level, opening the path toward 0.5941 in the mid-term).
A valid breakout usually comes with a surge in volume, so volume confirmation will be key.
---
🔽 Bearish Scenario (Breakdown)
On the other hand, if price fails to hold the 0.13 – 0.15 zone and we see a daily close below 0.13:
The Descending Triangle would be confirmed as a bearish continuation pattern.
Downside targets:
T1: 0.1200
T2: 0.1077 (previous major low)
Extension zone: 0.1000 – 0.0960 (psychological levels).
This would highlight seller dominance and potentially extend the downtrend further.
---
📊 Additional Insights
Volume & Momentum: Volume is currently flat, reflecting indecision. A spike in volume will likely be the early signal of a major move.
Sentiment: A breakout would turn this demand zone into a golden accumulation area for buyers. A breakdown, however, would act as a trap for weak longs.
Risk Management: Waiting for a daily candle close beyond 0.13–0.15 is the safest approach to avoid fakeouts.
---
✨ Conclusion
SHELLUSDT is at the apex of its Descending Triangle, and the 0.13 – 0.15 range is the critical battle zone. A breakout above 0.15 opens the door for a trend reversal toward 0.20 – 0.26, while a breakdown below 0.13 could drag price down to 0.1077 or even lower.
Traders should remain patient and wait for clear confirmation before committing to an aggressive position. The current market is in a “wait and see” phase, and a powerful move is likely coming soon. 🚀📉
#SHELLUSDT #CryptoAnalysis #Altcoin #PriceAction #TechnicalAnalysis #DescendingTriangle #SupportResistance #BullishBreakout #BearishBreakdown #CryptoTrading #RiskManagement

Cardano Price To Bounce As IOHK Audit Report Nears ReleaseBINANCE:ADAUSDT price is currently $0.85 , holding steady above the $0.83 support level. The Ichimoku Cloud shows a bullish outlook, suggesting positive momentum for ADA. Investors are keeping a close eye on price movements, with potential for further gains if market conditions remain favorable for the altcoin.
A key catalyst for potential price growth is the upcoming audit report of Input Output Global’s ADA holdings. Charles Hoskinson, BINANCE:ADAUSDT founder, requested the audit to address transparency concerns after allegations of $600 million in misappropriated ADA . The report could play a crucial role in boosting investor confidence and market sentiment.
If the audit report meets investor expectations, BINANCE:ADAUSDT could see a price increase, potentially pushing it to $0.90. Successfully securing this level as support may pave the way for further gains, reaching $1.00. Such a move would solidify Cardano's position and help avoid a drop below the $0.83 support level.
ADA Long to 2$ADA Long to 2$
as this coin is in the channel I expected to move to the top of channel again and then it will reached to 3$.

ADA/USDT | Cardano Breaks All Targets – Next Stop: Above $1?By analyzing the Cardano (ADA) chart on the 3-day timeframe, we can see that the price has surged exactly as expected, beautifully hitting all three targets at $0.85, $0.93, and $1! This move delivered an impressive 48% return. Following Jerome Powell’s remarks about the possibility of interest rate cuts in the coming months, Cardano saw renewed demand and has already risen from $0.82 to $0.91 so far. I expect this bullish momentum to continue, with a potential break and hold above the $1 level soon.
Hope you made the most out of this analysis!
Please support me with your likes and comments to motivate me to share more analysis with you and share your opinion about the possible trend of this chart with me !
Best Regards , Arman Shaban
Cardano aims to reach $1 ┆ HolderStatBINANCE:ADAUSDT is forming a bullish structure with consistent higher highs and lows. Buyers remain in control, with potential continuation toward $1.00–$1.05. As long as the market holds $0.85 support, trend structure favors bullish outlook.

BTC is losing dominance, Alt season!With the passing of the Genius Act , ETH , ADA , and many other American altcoins gained strong momentum. BTC dominance is bearish, and with the Clarity Act in the process of being passed, I expect lower dominance for BTC in 2025 and 2026. As you can see in the weekly chart, BTC dominance lost its momentum within a key rising parallel channel and dropped into a lower channel. Alt season is coming!

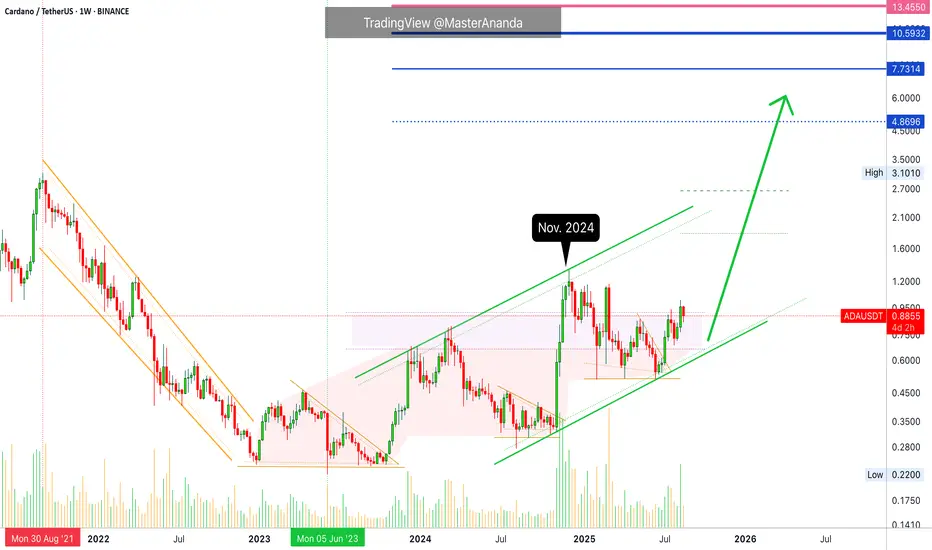
Cardano Bullish · Remember The Bigger Picture (Long-Term Growth)Remember the bigger picture, Cardano is growing.
Good afternoon my fellow Cryptocurrency trader, I hope you are having a wonderful day.
The rise started in June and so far we have only a very small wave. If you look back at November 2024 you can see how much growth was produced in just four candles, really strong.
The fact that this move started fast and had too much force, also meant an early demise and this led to a correction. The new wave started in June and four weeks green is only a small advance. After these four weeks green in early July we have two red weeks followed by additional growth.
Now we have a total of 9 candles since the June low. Compare this to the November 2024 wave, it had 5 candles total, the entire move. Here comes the alternation.
The previous wave was short in duration, fast and steep. The current wave will be long in duration and take its time to develop. Cardano has been rising not since June 2025 nor August 2024 but since June 2023, a very strong and prolonged bullish cycle. We are only missing a bull run phase. The market is in no hurry though, it can produce a bull run phase in two months just as it can do it in six months. We will know better as the bull market unravels.
Last week ADAUSDT produced the highest volume since last year on a single session. This is pretty good and interesting. This volume comes up after the move is already a month old. The volume is higher than normal but not super high. This tells us that whatever is happening now is only the start of something bigger.
Cardano will continue growing is the message coming from this chart. Cardano has so much more to give. How will it all develop? I don't know. But I can tell you that Crypto will continue to grow, the charts are saying long-term... We will see how it goes.
Namaste.
CardanoAda usdt daily analysis
Time frame 4hours
Risk rewards ratio >4.2 👈👌
Target 1.2 $
The great asset to hold and trade one of the 10 tops

Cardano ADAUSD Bullish Energy Build up?The ADAUSD remains in a bullish trend, with recent price action showing signs of a corrective pullback within the broader uptrend.
Support Zone: 8,690 – a key level from previous consolidation. Price is currently testing or approaching this level.
A bullish rebound from 8,690 would confirm ongoing upside momentum, with potential targets at:
10,200 – initial resistance
10,800 – psychological and structural level
11,560 – extended resistance on the longer-term chart
Bearish Scenario:
A confirmed break and daily close below 8,690 would weaken the bullish outlook and suggest deeper downside risk toward:
8,300 – minor support
7,910 – stronger support and potential demand zone
Outlook:
Bullish bias remains intact while the ADAUSD holds above 8,690. A sustained break below this level could shift momentum to the downside in the short term.
This communication is for informational purposes only and should not be viewed as any form of recommendation as to a particular course of action or as investment advice. It is not intended as an offer or solicitation for the purchase or sale of any financial instrument or as an official confirmation of any transaction. Opinions, estimates and assumptions expressed herein are made as of the date of this communication and are subject to change without notice. This communication has been prepared based upon information, including market prices, data and other information, believed to be reliable; however, Trade Nation does not warrant its completeness or accuracy. All market prices and market data contained in or attached to this communication are indicative and subject to change without notice.

ADA bullish reversal possibilityADA seem to be returning back to uptrend. At least it should grow to the top of that consolidation range around 1.1-1.2
Dips to 2024 close at 0.845 may be expected. Wicks can go below that level (down to 0..8), but for bullish bias to stay strong price shouldn't lose that level.

ADA/USDT : Heavy Pullback Expected Before Major Price Surge📊 Pattern Overview
Cardano is shaping a classic contracting triangle on the daily timeframe, with all legs unfolding as 3-wave zigzags, fully compliant with NeoWave rules.
• Wave A: $1.33 → $0.51 (zigzag decline)
• Wave B: $0.51 → $1.18 (zigzag rally, ~82% retrace of A)
• Wave C: $1.18 → $0.52 (zigzag decline, ~99% retrace of B)
• Wave D: $0.52 → $0.92 (zigzag rally, ~61% retrace of C, currently in progress)
• Wave E: Expected $0.92 → $0.51 (projected zigzag, targeting channel support)
This setup aligns with a contracting triangle, with converging trendlines projecting an apex around November 2025.
⸻
📉 Near-Term Expectation
• Wave E is anticipated to pull ADA back toward $0.51 (long-term channel support).
• This would complete the triangle and set the stage for a powerful bullish thrust.
⸻
🚀 Post-Triangle Outlook
• A bullish breakout from the triangle could target:
• $1.5 (TP1)
• $1.8 (TP2)
• This aligns with NeoWave projections of a 75–125% thrust of the channel width.
• Break of $0.92 (BOS) will be the confirmation trigger for the rally.
⸻
🎯 Trading Plan
• Entry: Wait for pullback to ~$0.51 (Wave E completion) and BOS confirmation.
• Targets: $1.5 – $1.8
• Stop Loss: Below $0.45
• Risk Management: 1–2% capital per trade, trail stops above $1.0 once thrust begins.
⸻
⚠️ Key Levels
• Support: $0.51 (channel bottom)
• Resistance: $1.0, then $1.5–$1.8
• Invalidation: Break below $0.45
⸻
✅ Summary: Patience is key. A final pullback toward $0.51 could be the last shakeout before a major bullish breakout.

ADA opportunity ahead. ADA is retracing while showing signs of divergence. Keep in mind that the market structure remains healthy; however, a bearish response is underway. As long as BTC and ETH show weakness, altcoins will dip. Be patient.

Four Coins for the Longer Run – My PlanWhen it comes to crypto, I’m definitely not the “buy & hold to the moon 🚀” type of trader. I prefer realistic targets, good entries, and a clear plan.
That being said, there are a few coins where I’m willing to have more patience, aiming for a 3x or more return.
For the first three (ADA, ALGO, XDC), the ETF story could play a big role in the coming year. FET is a different case, but one I still like. Let’s go one by one.
ADAUSD
- After the ATH above 3 in 2021, ADA collapsed more than 90%, bottoming in 2023 near 0.23.
- That bottom marked the start of a long accumulation phase, followed by an upside breakout in Nov 2023.
- Each correction since then has formed higher lows (0.3 → 0.5), showing strength.
- July’s rise looks constructive, and last week price also broke the falling trendline.
📌 Plan:
Accumulate around 0.9 and below, with DCA reserve if we see 0.65–0.67 zone.
Target: 2.3 in the first phase. Above that, I’ll reassess for a possible run toward ATH.
ALGO
- ALGO’s drop was even harsher, losing more than 90% from its peak.
- Found bottom near 0.1, and despite the spike late last year, it’s mostly still sideways accumulation.
For me, this is exactly the kind of base-building I like to see before a real run.
📌 Plan:
Buy near 0.2, keep reserves for a DCA if it drops again to 0.1.
Target: at least 0.7, then I’ll evaluate if market conditions favor holding further.
XDC
- XDC is more speculative, but also more explosive.
- The structure shows that a 3x to 5x move isn’t unrealistic once momentum picks up.
- With potential ETF headlines in play, it could be a nice upside surprise.
📌 Plan:
First buy zone around 0.07, with DCA reserves at 0.045.
Target: 0.15 in the first stage.
FET – Not About ETFs, But Strong Potential
- Different case here – no ETF talks, but I like the project.
- Already holding from around 0.4.
- If price dips to 0.55, I’ll add more.
📌 Target: 2.0 USD.
Final Thoughts
I’m not aiming for x100 fairy tales. My strategy is simple:
- Enter at accumulation levels
- Use DCA wisely
- Take profits at realistic targets
