long position is EURGBPAccording to the strategy that I use based on it, the overlap of support has been attractively formed in the weekly time. The roof of the channel is also authentically broken.
On the other hand, in the monthly time, the rsi oscillator trend line is also broken, which can be considered as a confirmation.
With all these conditions, it is logical to enter a long position.
Channeltrend

Long Term Channel Up - Near ProtocolLong term channel up --
Weekly Double Potentially forming
Swing to top of channel

AUDCAD it will rise to the middle of the channel
Welcome back! Let me know your thoughts in the comments!
**AUDCAD - Listen to video!
We recommend that you keep this pair on your watchlist and enter when the entry criteria of your strategy is met.
Please support this idea with a LIKE and COMMENT if you find it useful and Click "Follow" on our profile if you'd like these trade ideas delivered straight to your email in the future.
Thanks for your continued support!
Brian & Kenya Horton, BK Forex Academy

$CRWD H&S Bear Pennant Breakdown$CRWD is breaking down through channel support and top formation.
Patience.

GBPUSD - LONGConsider the formation of North Impulse from Major Resistance Level. Buy on a false breakout! The target is next Supply Zone.
GBPUSD - LONG
ENTRY PRICE - 1.14450
SL - 1.13700
TP - 1.18000
Always follow the 6 Golden Rules of Money Management:
1. Protect your gains and never enter into a position without setting a stop loss.
2. Always trade with a Risk-Reward Ratio of 1 to 1.5 or better.
3. Never over-leverage your account.
4. Accept your losses, move on to the next trade and trust the software.
5. Make realistic goals that can be achieved within reason.
6. Always trade with money you can afford to lose.
Please leave your comment and support me with like if you agree with my idea. If you have a different view, please also share with me your idea in the comments.
Have a nice day!

XAU/USD Rebounds Again!• On the H1 chart, you can see that XAU/USD found support just beneath the downside line of the channel. Only a false breakdown and an upside turn were registered. It tested the S1 (1,706) static resistance (support turned into resistance).
• It has formed a flag pattern in the near term, which is considered a bearish formation. Major uphill challenges are represented by 1,711 and the downtrend line.
• "Keep it Simple", Good Luck!

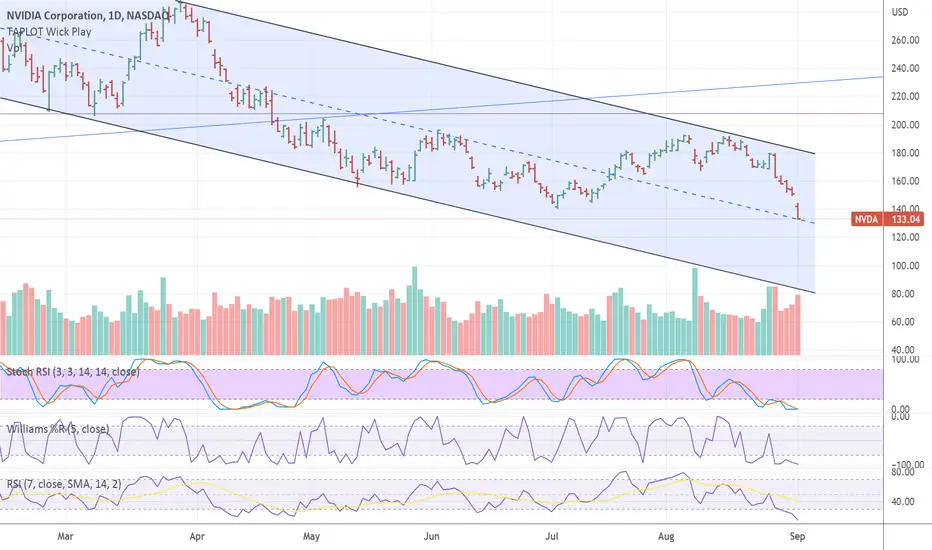
$NVDA downtrending channelWill $NVDA get support from dashed mid-line of down trending channel?
This dashed line was resistance before. $NVDA is a nice technical
chart to watch. Lots of professional engineers, who now trade, like to trade
$NVDA which makes it great for technical analysis.
EURCHF 4 Hr. Intraday Short Set Up!Welcome back! Let me know your thoughts in the comments!
**EURCHF - Listen to video!
We recommend that you keep this pair on your watchlist and enter when the entry criteria of your strategy is met.
Please support this idea with a LIKE and COMMENT if you find it useful and Click "Follow" on our profile if you'd like these trade ideas delivered straight to your email in the future.
Thanks for your continued support!
Brian & Kenya Horton, BK Forex Academy

$SHOP - giant accumulationSHOP has been accumulating for months, same like META. Sometimes companies take years to accumulate like this. Trade in a channel.

CADJPY Swing Upwards +100 PipsWelcome back! Let me know your thoughts in the comments!
**CADJPY - Listen to video!
We recommend that you keep this pair on your watchlist and enter when the entry criteria of your strategy is met.
Please support this idea with a LIKE and COMMENT if you find it useful and Click "Follow" on our profile if you'd like these trade ideas delivered straight to your email in the future.
Thanks for your continued support!
Brian & Kenya Horton, BK Forex Academy

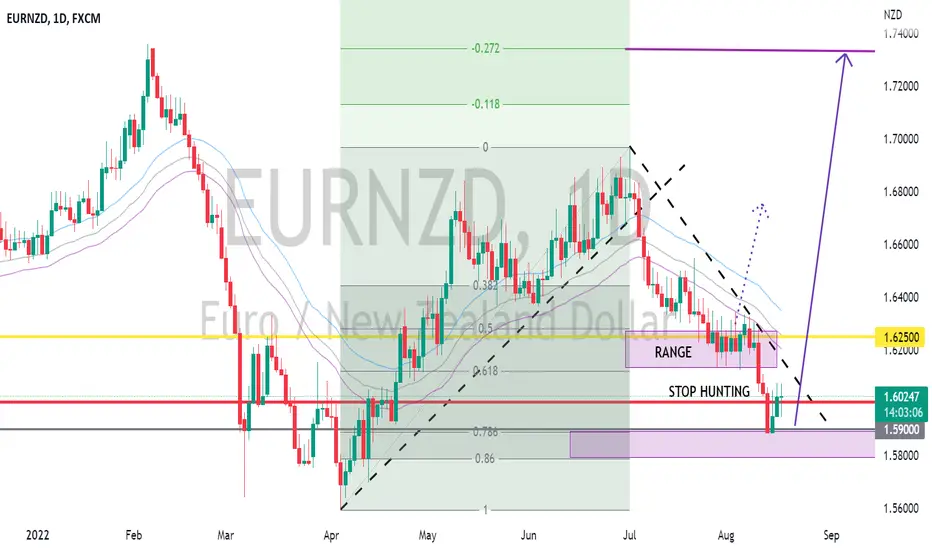
EURNZD LONG OVERVIEW AFTER WHAT LOOKS LIKE STOP HUNTINGPrice stayed for awhile tanging around 1.62000. Also 61.8 retracement level which would have induced retail traders to take long swing positions. The fast drop for 3 days looks like it was a STOP HUNTING Party. We are now Looking to trade it SWING LONG to 1.27 Fib Extension. Our Final TP. Taking smaller positions above the channel as we head to 1.27 Fib LEvel.
APLAPOLLO TUBES STOCK CAN TAKE BUYWeekly time frame it is in channel so we can take buy now and do a swing trade

HDFCLIFE is testing the trendline HDFCLIFE is testing the trendline u can go LONG (BUY) and do swing trade...and stoploss at ₹547 target at ₹617

GBPJPY Intraday SHORT Opportunity Welcome back! Let me know your thoughts in the comments!
**GBPJPY - Listen to video!
We recommend that you keep this pair on your watchlist and enter when the entry criteria of your strategy is met.
Please support this idea with a LIKE and COMMENT if you find it useful and Click "Follow" on our profile if you'd like these trade ideas delivered straight to your email in the future.
Thanks for your continued support!
Brian & Kenya Horton, BK Forex Academy

XAUUSD BreakoutHi Friends
Gold has broken the bearish channel. now we are looking for a buying opportunity. I have analysis as my best. if you like my analysis then follow, like, and comment Please

long position is more logical than shortConsidering the overlap of support and trend line, it is expected that MACD divergence will work and usdchf currency pair will get a good buying position in these areas towards the high targets.

NIFTYHello and welcome to this analysis on NIFTY
From the high's of 18600 made in October 2021, every pullback leg of Nifty has been approx 88%
18350 on 18 Jan 2022 was 88% of the decline from 18600 to 16410
18115 on 4 April 2022 was 88% of the decline from 18350 to 15670
The current rally is at 78% of the decline from 18115 to 15185.
So what lies ahead, lets try to decipher probable scenarios
1. 88% retracement is near 17765 that coincides with the falling trend line - History repeats itself, rally ends near it, "tata, bye-bye, see you Longs."
2. It will breach above the falling trendline and continue its rally towards 18400 at least - Bull party continues, almost everything from A to Z eventually moves up, everyone (except those looking for a pullback and/or short) are happy!
3. It has completed its pullback and will do a pullback/resume downtrend, earliest confirmation as of today would come once it starts sustaining below 17375. - Just when everyone was hopeful that stocks are coming closer to their purchase cost, those stocks which have made us FII - "Full Invested Indians", because we bought them at very high levels and exiting in decline would have cost a huge loss, so holding onto these till .... ! PS This is not for Investors, this is for traders who become forceful investors in stocks where exit did not happen.
Until then
Happy Investing & Safe Trading


DLB Short-> DLB has been ranging in this sideways channel
-> past two earnings have hammered the stock down to the bottom of the channel
-> short and simple (short from the top, take profits at the bottom)
-S/L @ ~$80
Just my opinion/not financial advice, cheers!

Potential Selling opportunity on NAS100The NAS100 is currently trading around 13340, which is the 3rd touch on the trendline that started on December 2021,
We can a trend resistance at that point, so i expect a bearish reversal from 13349
Market has been overbought and RSI, Stochastic and CCI
i will be waiting for a bearish confirmation to enter the market
This is my analysis
whats your take on this traders
!!! Trade with care

EURUSD Possible bullish channel...watch outhere is my channel for EURUSD for these days...hope to traders to use this at their trades.

btc following this channel btc following this channel and made a head and shoulders , now we can see 21500 and if it broken down line we will see 20000 and less down
