Palantir: Air is getting thin NASDAQ:PLTR recently reached our designated red short Target Zone, triggering an active short trade. We have been managing risk proactively, reducing the position by 50% after hitting the initial take-profit level. As a result, our stop-loss is now set at the entry price. As the weekly chart indicates, the stock is primarily in a major corrective phase, identified as wave II in beige. This correction is expected to continue, first pausing in the upper green Target Zone ($117.54–$95.10) before potentially extending down to the lower green Target Zone between $72.58 and $40.66. Alternatively, there is at least a 33% chance that the stock could first post a new high for wave alt.I in beige, above resistance at $207.23.
Chartanalysis

XAUUSD – 30m Chart Analysis**XAUUSD – 30m Chart Analysis & Idea**
Gold remains in a **short-term bullish structure**, trading above key EMAs and holding an **ascending trendline**.
**Key Levels**
* **Current price:** ~**4584**
* **Support zone:** **4555 – 4565** (EMA cluster & previous consolidation)
* **Resistance zone:** **4595 – 4605**
**Price Action Insight**
* Price is consolidating after a strong impulsive move up.
* Higher lows are forming, showing buyers are still active.
* As long as price holds **above the support zone and trendline**, upside pressure remains intact.
**Idea (Educational)**
* Bullish continuation favored **above 4560**.
* A sustained break and hold **above 4600** may open the way toward **4620–4640**.
* Failure to hold support could lead to a pullback toward **4525–4500** area.
*Technical analysis only, not financial advice.*

BTC/USD M30 CHART ANALYSIS I 01.141. Overall Trend
Dominant Uptrend: The price is in a clear bullish structure with higher lows. The ascending blue trendline acts as dynamic support for the price.
Strong Momentum (Impulse): The breakout from the $91,600 area straight to $96,000 indicates aggressive buying pressure (likely a short squeeze or FOMO).
2. Key Zones (Supply & Demand)
Resistance (Upper Purple Boxes): There are two purple zones overhead (around $95,500 - $96,500). The price is currently reacting to the lower band of this resistance. This is where selling pressure is concentrated.
Support (Lower Purple Box): Located around the $90,500 - $91,000 area. This was the previous accumulation zone before the breakout.
Open Daily Line (95,367): The price is hovering right at the daily opening level. Staying above this line is a positive signal for the bulls.
3. Volume Profile Analysis (Left Sidebar)
High Volume Nodes (HVN): The longest bars on the profile show where the most trading activity occurred.
The price is currently sitting in a high-volume cluster around $95,200. If the price fails to hold this level, it might "drop quickly" through the "low-volume nodes" (voids) until it hits the next supports at $93,600 or $92,000.
4. Current State & Scenarios
Consolidation: After the sharp rally, the price is moving sideways in a tight range between $94,800 and $96,000. This is a market "breather."
Bullish Scenario: If the price breaks and closes decisively above $96,400, the next target is $98,000+.
Correction Scenario: If the price loses the $94,800 mark, it will likely retest the blue trendline (around the $93,000 - $93,500 zone).
Summary Note: Keep a close eye on the current price action at $95,255. The blue trendline is the critical "line in the sand"—as long as the price stays above it, the uptrend remains intact. And as you mentioned: "Remember the goal"—stick to your risk management plan at these all-time high levels.

GBP/USD OVERVIEW IN ASIA SESSION I 01.14Market Structure & Volume Profile Analysis
The pair is currently transitioning from a distribution phase into a Mean Reversion (corrective) rally. Following a sharp decline, the price found significant "buy-side" liquidity at the 1.3421 Demand Zone, which is now our primary floor.
Value Area Context: We are currently battling the VAL (Value Area Low) zone around 1.3435 - 1.3440. This is a critical pivot point. Successfully flipping this level from resistance into support is the prerequisite for any further upside.
The Gravity of POC: The Point of Control (POC) at 1.3470 remains the ultimate magnet. This level represents the highest volume of transacted orders and will likely be the site of the next major "stand-off" between bulls and bears.
Liquidity Void: Notice the thin volume profile between the current price and the POC. This suggests that if the 1.3445 level is cleared, there is very little "friction" to stop a quick run toward 1.3470.
Technical Execution & Outlook
The Bullish Case (Preferred)
The recent breach of the descending trendline suggests a shift in momentum. If the H1/H4 candles can stabilize above the 1.3445 handle, the path is cleared for a move toward the 1.3470 (POC) and potentially a retest of the 1.3485 (VAH).
Entry Logic: Ideally, you want to see a "Spring" or a successful retest of the broken trendline/VAL zone before committing to a long position.
The Bearish Risk
Failure to hold above 1.3435 would invalidate the current breakout, labeling it a "Bull Trap." In this scenario, the market would likely rotate back down to sweep the lows at 1.3421 to seek deeper liquidity, possibly targeting the 1.3395 support level.
Bottom Line: The bulls have the ball, but they are currently facing a "wall" at the VAL zone. Watch the price action at 1.3445 closely—this is the trigger for the next 30-40 pip expansion.

XAUUSD QUICK ANALYSIS I 01/141. Market Context
The price is currently trading around 4,627.5. Overall, Gold is in a short-term bullish trend following a breakout from the mid-week consolidation zone.
Key Chart Components:
Volume Profile (Left Side): Shows volume distribution, with the heaviest concentration at the center (POC).
VAH (Value Area High): The upper boundary of the Value Area, where sellers typically show interest.
POC (Point of Control): The bold black line representing the price level with the highest traded volume (equilibrium).
VAL (Value Area Low): The lower boundary of the Value Area, where buyers usually step in.
2. Key Level Analysis
POC (Point of Control) & Open Daily Line
The price level around 4,591 – 4,595 acts as the "anchor" for market sentiment. As long as the price remains above this level, the bulls maintain control in the short term.
The confluence between the POC and the Open Daily Line confirms this as a major support zone in the event of a pullback.
Reaction at VAH (Value Area High)
Price has recently staged a strong breakout above the VAH zone (approx. 4,610 – 4,615).
Looking at the recent candles: Price has not only breached but also closed firmly above the VAH. This flips the previous VAH resistance into a Potential Support (S/R Flip).
3. Current Price Action
Momentum: After hitting the POC support and consolidating sideways, the price surged with long-bodied green candles, indicating dominant buying pressure.
Current Positioning: Price is at the local peak of this wave. However, as it approaches the 4,630 level (the previous profile peak), we may see some short-term profit-taking.
4. Trading Plan
Scenario 1: Trend Continuation (Preferred)
Condition: Wait for a minor retracement (retest) back to the 4,615 – 4,620 area (VAH zone).
Action: If reversal or rejection signals (Pinbar, Engulfing) appear here, look for Long opportunities.
Targets: 4,650 and beyond.
Scenario 2: Deeper Correction
Condition: If the price breaks back below the VAH, it may seek the POC (4,591).
Action: This remains a high-probability "Buy Zone" within the larger trend. Avoid Shorting unless the price closes below the POC on high volume, which would signal a break in the bullish structure.
Trader’s Pro-Tip: The price is currently in a short-term "overbought" state as it sits outside the Value Area. The golden rule is never chase the price (FOMO) at the highs. Exercise patience and wait for a retest of the value levels (VAH or POC) to secure an optimal Risk/Reward (R:R) ratio.

Walmart: New Impulse!After a period of indecision, Walmart's stock has recently gained new upward momentum. It's once again heading towards our red Short Target Zone ($127.46 - $134.37), where the green wave is expected to conclude. In the primary scenario, we anticipate a subsequent break of the support at $97.90 and a decline into our green long Target Zone between $80.90 and $69.60. Alternatively, the high of the green wave alt. might have already been set. A direct sell-off below the mentioned support would then lead the stock into our green Long Target Zone earlier (probability: 34%).

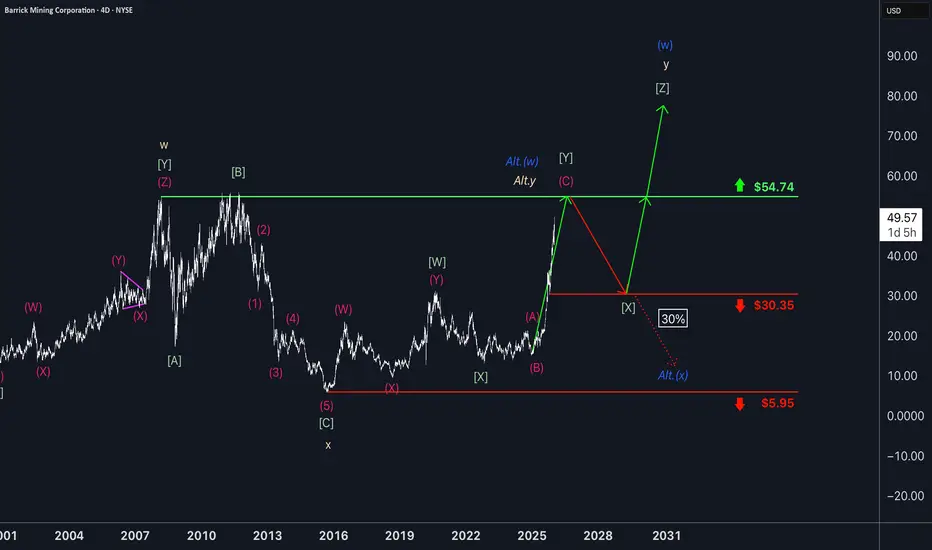
Barrick Gold slowly advancingWithin the ongoing three-wave pattern, the magenta wave (C) is expected to give the miner another boost, ultimately completing the green wave just below the resistance at $54.74. The following wave should then pull the stock back toward support at $30.35, from which wave is likely to start again. This move should once again lift Barrick higher, with the blue wave (w) projected to finish well above the $54.74 level. There is, however, a 30% chance that wave Alt.(w) could wrap up imminently. In that scenario, wave Alt.(x) would push price directly below $30.35, but would still bottom out before reaching the support at $5.95.
XAUUSD Bullish Structure – BUY Setup Toward 4530 & 4560Price has broken above the trendline and is holding above the support zone at 4,485–4,495, where former resistance has now turned into support. As long as price stays above this support area and respects the rising trendline, bullish momentum is likely to continue. The first target is 4530, and if strength sustains, price can extend toward the main target zone at 4,550–4,560. A clear break back below 4,485–4,495 support would invalidate the bullish setup.

ETHUSD – 4H Chart AnalysisETHUSD – 4H Chart Analysis
Ethereum is currently range-bound after a corrective move, trading between clearly defined support and resistance zones.
Key Levels
Current price: ~3112
Support zone: 3050 – 3070
Resistance zone: 3160 – 3180
Higher resistance (R2): 3280 – 3300
Chart Insight
Price is holding above the major support zone, showing buyers defending this area.
Recent candles show rejection near resistance, indicating supply pressure around 3160+.
EMAs are flattening, suggesting consolidation before the next move.
Breakout Setup (Educational)
Bullish scenario:
A strong close above 3180 may open the path toward 3250 – 3300.
Bearish scenario:
Failure to hold 3050 could expose downside toward 3000 – 2950.
Summary
Bias remains neutral inside the range.
Directional clarity expected on a confirmed breakout or breakdown.
Technical analysis only, not financial advice.

BlackRock: Up and Down AgainBlackRock has recently formed the low of the turquoise wave X and subsequently moved into a sideways phase, from which it temporarily broke out impulsively upward. However, selling pressure soon returned. Overall, the stock remains in a consolidation phase. In the short term, we expect increased upward momentum to develop the high of the overarching wave (2) in magenta. We anticipate that this peak will remain below the resistance at $1219. Thereafter, more sustained selling pressure is expected to gradually push the stock below the support at $760.01, marking the low of beige wave IV. Should the low of the magenta wave alt.(X) have formed in November, the current movement could be attributed to wave alt.(Z). In this scenario, an increase above the resistance at $1219 should be considered, which would simultaneously allow the overarching green wave alt. to reach a new high (probability: 35%).

Silver Pulls Back After Double Top TestSilver futures bounced off resistance at $82.67 on Tuesday. According to our primary scenario, the next key move will be for price to break through this level, which would open the way toward the red Target Zone between $92.25 and $111.28. In that area, we expect the prominent top of the green-labeled wave to form, followed by a larger corrective move. Based on this outlook, traders could consider entering short positions within the $92.25 to $111.28 range, using a stop set 1% above the upper boundary of the zone. Alternatively, it’s possible that the green wave alt. already peaked at $82.67 and price is now correcting directly below support at $69.26. If this scenario plays out—which we assign a 35% probability—a direct pullback into the alternative green long Target Zone between $53.26 and $47.16 would be expected.

Gold Faces Heavy Resistance Near $4,500Gold is struggling with a key resistance just below the $4,500 level early Friday, after managing to close above $4,450 on Wednesday.
Current price action suggests that the precious metals market is still facing strong short-term headwinds, particularly from commodity index rebalancing flows and U.S. dollar fluctuations.
Both gold and silver are under notable pressure as the Bloomberg Commodity Index rebalancing enters its peak phase. In the coming days, COMEX futures markets could see up to $6–7 billion in selling per metal, driven by mandatory weight adjustments within the index. While this is largely a technical process, its scale is significant enough to trigger sharp short-term volatility.
At the same time, the U.S. dollar is holding near a one-month high, as investors remain cautious ahead of the U.S. Non-Farm Payrolls report. Recent data point to a cooling U.S. labor market, with job openings falling to their lowest level in over a year. This keeps expectations alive that the Federal Reserve may cut interest rates later this year, offering some medium-term support for gold.
Looking further ahead, the longer-term outlook for gold remains constructive. Persistent central bank demand and ongoing geopolitical risks continue to underpin prices. HSBC projects that gold could approach $5,000 per ounce in the first half of 2026, driven by rising global debt levels and continued diversification of foreign exchange reserves.
From a technical standpoint, the front-month gold contract is trading within a tight range, highlighting a clear tug-of-war between buyers and sellers. A decisive break above $4,500 could unlock fresh upside potential, while on the downside, $4,400 remains a critical support level if selling pressure intensifies.
Given the elevated volatility, a cautious approach to short-term trading is advised, with close attention paid to upcoming macroeconomic data and monetary policy signals.
Good luck!

ZKP 1H Trade IdeaZKP has broke falling wedge.
Also support confluence is there. SL TPs are given with RR of 2.5
NFA DYOR

Rolls-Royce Holdings: Wave Count AdjustedAfter Rolls-Royce shares recently surged and broke through resistance at €14.10, we have revisited our wave count and made some adjustments. We now primarily believe that the low of wave (4) in magenta was likely set at the end of November, forming a turquoise A-B-C three-wave move. In any case, the ongoing wave (5) in magenta should still have some upside potential before completing the larger cyclical wave I in beige.

BTC Technical Breakdown – Smart Money Sell Opportunity📉 Market Structure
Price is moving inside a descending channel, which confirms a bearish overall trend.
Each rally is making lower highs, showing sellers are in control.
The recent push up is corrective, not impulsive → typical of a downtrend.
---
📐 Key Technical Zones
🔴 Resistance (Sell Zone)
Price is currently testing the upper trendline of the descending channel.
There is a horizontal resistance aligning with this trendline → strong confluence.
Multiple rejections from this area in the past = high-probability sell zone.
🟢 Support / Liquidity Zones
First downside target: previous range low (local support).
Main liquidity zone marked below → sell-side liquidity resting there.
Strong impulse move previously left imbalance, likely to be filled.
---
🔻 Pattern Insight
Price formed a rising wedge / corrective structure inside a bearish channel.
This is a classic bearish continuation pattern.
The arrow and SELL marking indicate rejection confirmation, not anticipation.
---
🧠 Smart Money Concept (SMC View)
Break in minor bullish structure → Change of Character (ChoCH).
Price tapped premium zone of the range.
Institutions likely distributing before pushing price lower.
---
✅ Trade Idea (Example – Not Financial Advice)
Bias: SELL
Entry: Rejection / bearish candle at resistance
Stop Loss: Above channel high
Targets:
TP1: Range low
TP2: Liquidity zone
TP3: Extended imbalance fill

Gold Breaks Out on Venezuela Crisis and Dovish Fed SignalsGold surged above $4,400 after a U.S. operation captured Venezuela’s president, sparking geopolitical tensions and safe-haven demand.
- OANDA:XAUUSD prices surged above the $4,400 region during Asian trading on Monday. This move was because of a US operation that resulted in the capture of Venezuelan President Nicolas Maduro. This unexpected strike created new geopolitical tensions and increased demand for safe-haven assets.
- The market is afraid of further instability in Latin America. U.S. officials hinted at using the leverage of oil for political change. As a result, traders rushed into gold, expecting increased uncertainty and long lasting risk premiums. On the other hand, the Federal Reserve’s dovish stance is supportive of gold. However, good U.S. jobs data could boost the dollar and put a temporary ceiling on gold prices.
Gold Technical Analysis
- The daily chart for spot gold indicates that the price is rebounding from the strong support at an important junction and is looking for higher levels. This important junction is formed by the strong support of the ascending triangle and the ascending broadening wedge pattern. A break above $4,550 will signal further upside to the $5,000 level. However, a break below $4,260 will signal a downside move to lower levels.
The 4-hour chart for spot gold shows the price consolidating during thin liquidity and found support at the $4,380 level. The price rebounds higher during a bullish pattern. As long as gold maintains the $4,260 level, the next move in the gold market will likely be higher.

XAUUSD M30 CHART ANALYSIS I 01/081. Price Structure and Technical Analysis
The chart shows that Gold is in a short-term corrective phase after hitting a strong resistance level:
Trend Overview: Following a sharp rally from below 4,350, gold prices peaked around 4,500 and have begun to consolidate or decrease slightly.
Trendlines: The price is trading near an ascending trendline starting from January 6. Currently, the price is moving sideways at the intersection of this ascending trendline and a short-term descending trendline from the 4,500 peak.
Volume Profile: The highest concentration of trading volume (POC) is located around 4,445 - 4,461. The current price (4,436) is sitting just below this zone, indicating that selling pressure has a slight edge in the short term.
2. Key Levels to Watch
Resistance Zones:
4,445 - 4,460: This is the POC area and the immediate barrier the price must overcome to regain bullish momentum.
4,500: A critical psychological level. Failing to break this level in previous sessions has led to profit-taking.
Support Zones:
4,427 - 4,434: The nearest support zone (the light blue demand zone on your chart). If this level breaks, the price could drop further.
4,370 - 4,380: A stronger support zone below if a deeper correction occurs.
3. Market Update for January 8, 2026
According to updated data, global gold prices have trended slightly lower today:
The price is trading around 4,442 - 4,446 USD/ounce, down approximately 0.48% to 0.87% compared to the previous session.
Drivers: Investors are taking profits after the extended rally, and the USD is showing signs of slight strengthening. The market is also cautious ahead of Friday's US Non-Farm Payrolls (NFP) data for further clues on monetary policy.
4. Forecast Scenarios
Scenario 1 (Bullish Accumulation): If the price stays firm above the 4,427 support and moves above 4,460, gold could return to challenge the 4,500 mark again.
Scenario 2 (Deeper Correction): If the 30m candle closes below 4,420, a short-term downtrend will be confirmed, with the next target likely being the 4,370 area.
Observation: In the short term, prioritize watching the price reaction at the current support zone (4,430 - 4,436). Avoid chasing "Buy" orders until the price clearly breaks above the 4,460 resistance with high volume.

BTC/USD ANALYSIS CHART M30 I 01/081. Trend Overview: Bearish
The price is currently in a clear downtrend, confirmed by:
Descending Trendline: Price is consistently making lower highs and is hugging the diagonal trendline descending from the peak.
Position relative to Volume Profile: Price is trading entirely below the VAL (Value Area Low) at approximately . When price stays below the previous session's value area, it indicates that sellers are in control.
2. Key Technical Zones
Resistance Zones:
VAL ($91,800 - $92,000): This is a crucial psychological and technical barrier. Unless BTC breaks back above this level, it will remain under heavy selling pressure.
POC (Point of Control - ): The price level with the highest traded volume. This acts as a magnet for price, but currently serves as strong overhead resistance.
Support Zones:
Demand Zone ($90,500 - $90,800): Price is currently testing this zone. You can see long lower wicks forming, suggesting some buying interest (demand) is stepping in to prevent a drop below the mark.
3. Potential Scenarios
Scenario 1: Technical Rebound (Bullish Rebound)
If the current Demand Zone holds, we could see a relief rally to retest the descending trendline and the VAL ().
Condition: Needs a strong bullish candle closing above .
Target: $91,800 - .
Scenario 2: Further Decline (Bearish Continuation)
This is the higher probability scenario given the trendline pressure. If price breaks the Demand Zone (closes below ), BTC is likely to drop to lower levels:
Target 1: (Psychological level).
Target 2: (Previous support structure on the far left of the chart).
4. Trading Strategy
Avoid Longing the Dip blindly: Although price is at support, the primary trend is down. Only consider Long positions if there is a clear reversal pattern at the Demand Zone.
Prioritize Short setups: Look for sell opportunities on rallies toward the $91,800 - area if price shows rejection (long upper wicks) to trade in alignment with the main trend.
Observation: The current candle is sitting right at the edge of the Demand Zone. If there is not a strong bounce within the next 1-2 candles, a dump toward is highly probable.

GBP/USD ANALYSIS IN ASIA SESSION I 01/081. Market Structure & Trend
Primary Trend: The price is currently in a clear downward trend. The descending trendline is acting as dynamic resistance, capping any recovery attempts.
Highs/Lows: The market is forming Lower Highs and Lower Lows. Currently, the price has broken below a short-term consolidation phase, signaling further weakness.
2. Key Volume Profile Zones
The Volume Profile on your chart highlights three critical areas:
VAH Zone (Value Area High - ~1.3560): This is the top of the value area. The price tested this level and was rejected sharply, confirming it as a "heavy" resistance zone.
POC Zone (Point of Control - ~1.3505): This is the price level with the highest trading volume. The price spent a significant amount of time churning here before breaking down. It will now act as a major overhead resistance.
VAL Zone (Value Area Low - ~1.3465): The price has just breached this level to the downside. In Volume Profile theory, when price exits the Value Area, it often indicates a "breakout" search for a new equilibrium at lower levels.
3. Current Situation & Future Scenarios
The most recent candle is sitting near 1.3460, just below the VAL line.
Scenario 1: Continued Bearish Momentum (High Probability) If the price fails to reclaim the 1.3470 level (the VAL zone) on a closing basis, the selling pressure is likely to persist. The next targets could be the support levels around 1.3420 – 1.3400.
Scenario 2: Technical Pullback (Retest) The price might experience a minor bounce to retest the VAL zone (1.3465 - 1.3470) or the descending trendline. If bearish reversal candles (like a pin bar or engulfing pattern) appear at this retest, it would offer a high-probability entry for short sellers.
4. Important Observations
Volume Nodes: The horizontal bars on the left show that the area below 1.3460 has relatively "thin" volume (Low Volume Nodes). This suggests that if selling continues, the price could drop quickly as there are fewer historical orders to provide support.
Economic Events: Note the US/UK flag icons at the bottom of the chart. Upcoming news events could trigger high volatility, potentially overriding technical levels.
Summary: Given the current trend, focusing on Sell opportunities when the price retraces to resistance (VAL or Trendline) is generally safer than attempting to "catch a falling knife" (buying at the bottom).

BITCOIN: Slips LowerBitcoin has experienced another bout of selling in recent hours but remains above the $92,000 level. Our primary outlook still calls for a significant move lower as part of green wave C—specifically, into the green Target Zone between $62,250 and $51,212, where we expect the low of the larger orange wave a to form. After that, we anticipate an extended (though corrective) b-wave rally, which could potentially push back toward the $100,000 mark. Only after this move do we foresee the final leg down in the ongoing wave-(ii) correction.

eBay: Progress!Recently, eBay has shifted upward and has achieved consistent gains since. We now consider waves C in green and b in orange as completed and expect an imminent arrival at our red Short Target Zone between $92.40 and $98.54. There, the orange three-part move is projected to complete blue wave (ii), after which we anticipate significant sell-offs in the following wave (iii) below the support at $75.29.

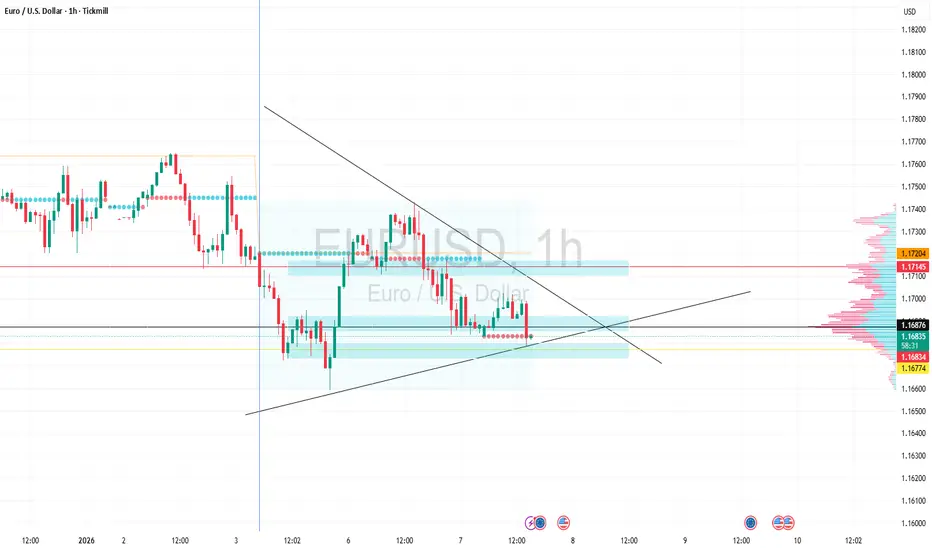
EUR/USD CHART QUICK ANALYSIS IN LONDON SESSION I 01/071. Market Structure & Trend
Main Trend: The market is currently in a consolidation (sideways) phase following a previous sharp decline. Price is compressing inside a Symmetrical Triangle pattern, defined by the two converging trendlines.
Current Price Action: The price is trading around 1.16838, sitting right on the lower support trendline and near the POC (Point of Control) of the Volume Profile.
2. Key Technical Levels
Resistance: * The zone between 1.17145 – 1.17204 (the upper blue box). This is the recent local high and aligns with the descending trendline.
Support: * The zone between 1.16774 – 1.16876. This is the immediate "hard" support. If a 1h candle closes decisively below 1.16700, the bearish trend is likely to resume.
3. Volume Profile Analysis
The Volume Profile on the right shows a massive concentration of trades at the current level (1.16800 – 1.16900). This indicates a "tug-of-war" between buyers and sellers. Once the price breaks out of this high-volume node, a volatile move is expected.
Trading Scenarios
Scenario 1 (Bearish Bias): If the price breaks below the triangle’s support and closes under 1.16770, the next target could be 1.16500 or lower.
Scenario 2 (Bullish Rebound): If a strong rejection (long wick) occurs at this support, the price may bounce toward the upper trendline near 1.17100. However, there is significant overhead resistance.
Pro Tip: Since the triangle is squeezing tightly, it is often safer to wait for a confirmed breakout and a retest before entering a position.
XAUUSD H1 CHART IN LONDON SESSION I 07/01
1. Overall Trend
Dominant Bullish Trend: Since the beginning of 2026 (as shown on the chart), Gold has established a strong upward momentum, climbing from the bottom area around 4,320 to a peak near 4,500.
Current Phase: The price is currently in a bearish retracement (correction) after hitting the psychological resistance level of 4,500.
2. Volume Profile Analysis
The chart displays key levels from the Fixed Range Volume Profile:
VAH (Value Area High) - 4,491: This is the upper boundary of the value area. The price attempted to break above this level but was strongly rejected (indicated by long upper wicks), signaling significant selling pressure.
POC (Point of Control) - 4,465: Represented by the bold black line. This is the price level with the highest traded volume. Currently, the price is trading just below this zone (4,463). The POC acts as a "magnet" or a critical short-term pivot point.
VAL (Value Area Low) - 4,429: The lower boundary of the value area. If the price continues to drop and loses the POC support, this will be the next target.
3. Candlestick & Price Action
Reversal Pattern: At the recent peak (~4,500), small-bodied candles with long upper wicks appeared, followed by a strong bearish engulfing candle. This confirms that Sellers have temporarily taken control.
Immediate Support: The price is currently hovering at a minor support level around 4,460. However, the downward pressure remains evident.
4. Forecast Scenarios
Based on the current market structure, there are two likely scenarios:
Scenario 1 (Recovery): If the price holds the 4,460 - 4,465 zone (POC) and a bullish confirmation candle appears, Gold could retest the VAH (4,491) area.
Scenario 2 (Continued Correction): If the 1-hour candle closes decisively below 4,460, the short-term downtrend will continue toward the VAL (4,429) or further down to the old accumulation zone near 4,356.
💡 Trading Observations:
Watch the POC (4,465): This is the "battleground" level that decides which side wins in the short term.
Economic Calendar: Note the US flags at the bottom of the chart. These indicate upcoming news events that could trigger high volatility.
