Trend Holds Strong — Smart Money Still in ControlThe XAUUSD market continues to move precisely in line with the projected trend-following plan. After a controlled technical correction, price remains firmly above the key support zone and the MA structure, confirming that the broader bullish trend is still intact. Current price behavior shows consolidation just below resistance, with stable buying pressure and no aggressive selling a classic pre-continuation environment.
This phase reflects accumulation and supply absorption rather than weakness. Short-term pullbacks are functioning as liquidity shakeouts, allowing stronger hands to position in the direction of the main trend. As long as price respects the structural support, the preferred scenario remains a continuation to the upside.
From an intraday perspective, the market maintains a bullish bias, offering tactical opportunities on both sides while favoring trend-aligned entries.
Intraday Trading: Increase
📌 Timing Sell Zone (Short-Term Correction Trade)
XAUUSD SELL ZONE: 4369 – 4372
🎯 TP: 4366 – 4361
❎ SL: 4376
This setup targets a brief technical pullback within the broader uptrend. As a counter-trend trade, strict risk control is essential.
📌 Timing Buy Zone (Trend-Following Priority)
XAUUSD BUY ZONE: 4274 – 4277
🎯 TP: 4280 – 4285
❎ SL: 4270
This is the preferred setup, aligned with the dominant bullish structure. Pullbacks into this zone are considered healthy retracements and offer higher-probability entries in the direction of the trend.
Conclusion:
Market movement continues to validate the original analysis and roadmap. Discipline, patience, and trading with the prevailing trend remain the key advantages in the current environment. Always apply proper capital management to protect account safety and maintain consistency.
Chartanalysis

Bitcoin Isn’t Bouncing It’s Reloading for the Next DropBITCOIN (BTCUSD) – H1 MARKET ANALYSIS
1. Current Market Structure
Bitcoin is maintaining a clear short-term bearish structure on the H1 timeframe. Price continues to form lower highs and lower lows, confirming that sellers remain in control. The recent bounce is corrective and lacks follow-through, signaling weakness rather than trend reversal.
Key structural points:
- Breakdown below previous consolidation blocks
- Failure to reclaim prior value areas
- Bearish momentum remains dominant
2. Moving Averages & Trend Confirmation
- EMA 34 (blue) is acting as dynamic resistance
- EMA 89 (red) defines the broader bearish trend
Price remains below both EMAs, and every attempt to move higher is rejected a classic trend-following sell environment.
This alignment confirms that:
- Rallies are selling opportunities
- Trend continuation is favored over mean reversion
3. Consolidation & Liquidity Behavior
Bitcoin is currently compressing sideways just below resistance, forming a short consolidation range. This behavior indicates:
- Liquidity is being built
- Buyers are failing to regain control
- Market is preparing for the next impulsive move
In bearish conditions, this type of consolidation typically resolves to the downside.
4. Scenarios Ahead
Primary Scenario – Bearish Continuation (High Probability):
- Price continues to range briefly below EMA resistance
- Liquidity builds within the gray consolidation zone
- Breakdown triggers the next leg lower
Downside objectives:
- First support: ~85,800
- Expansion zone: 85,000 – 84,500 (liquidity draw)
Invalidation Scenario:
- Only valid if price breaks and holds above EMA 89
- Structure must shift to higher highs on H1
Until then, upside moves remain corrective.
5. Trading Bias & Conclusion
Bias: Sell rallies
Market State: Bearish trend + corrective consolidation
Strategy: Follow structure, wait for breakdown confirmation
Bitcoin is not reversing it is pausing before continuation.
As long as price stays below key moving averages and resistance zones, the path of least resistance remains downward.

Latest Gold Price Update TodayHello everyone, let’s take a look at the current trend of OANDA:XAUUSD .
As previously anticipated, XAUUSD continues to hold a steady recovery and remains firmly above the 4,300 USD level. At the time of writing, the precious metal is trading around 4,330–4,335 USD, maintaining a bullish structure within the main ascending price channel.
The U.S. dollar has softened slightly as the market continues to price in the possibility of monetary easing in the coming period. Cooling U.S. Treasury yields have further supported gold, allowing prices to stay elevated.
The 4,350–4,360 zone stands as the nearest resistance (weak high), which price needs to break in order to extend the upside momentum. On the downside, 4,300–4,310 is a key short-term support area, aligning with the lower trendline of the channel. If buying pressure is strong enough to clear 4,360, the next upside targets lie around 4,390–4,400. The preferred approach remains trading in line with the prevailing trend.
What’s your view on XAUUSD at this stage? Feel free to share your thoughts.

EURUSD Market UpdateHello, it’s a pleasure to discuss FX:EURUSD with you.
The EUR/USD pair remains stable today after two days of mild declines, trading around 1.1740 at the time of writing.
From a technical perspective, the bullish momentum is strengthening as price continues to hold above the ascending trendline. The immediate resistance is seen at 1.176, followed by the key level at 1.1800.
I remain optimistic about EURUSD—what’s your view?

Tilray: 80% gains!TLRY shares have made significant strides, boasting a gain of over 80%. Currently, the price continues to develop within orange wave iii, aiming to surpass the resistance at $23.20 in the next phase. A drop below the support at $3.51, however, would trigger our alternative scenario. In this case, it implies that the large beige wave alt.W is not yet complete (Probability: 33%).

3M: Target Zone in Sight!3M shares remain stuck in a consolidation, looping multiple times. The high of the magenta impulse wave (1) is still pending and should form in our red Short Target Zone between $184.42 and $202.51. Once this range is reached, the corrective wave (2) should kick in, pulling price below the support at $115.56. However, if the high of wave alt.(1) has already been established, wave alt.(2) could mark its low within the green alternative Target Zone between $110.13 and $93.07 (probability: 35%).

GBP/USD Outlook I 12/181. Trend Structure & Price Patterns
Current Trend: The pair is in a short-term bearish structure after forming a peak around the 1.3440 area.
Triangle Pattern: Price is compressing toward the apex of a triangle pattern, formed by a descending trendline (connecting lower highs) and an ascending trendline (connecting higher lows).
Status: The market is in a stage of extreme accumulation, preparing for a breakout to determine the next directional move.
Intersection: The intersection of these two trendlines is sitting almost exactly at the current price level around 1.3366.
2. Volume Profile Analysis
The chart clearly displays three key Value Areas:
POC (Point of Control - 1.3367): This is the level with the highest traded volume and where the price is currently "anchored." Continuous fluctuation around the POC indicates a balance between buyers and sellers at this moment.
VAH (Value Area High - 1.3401): The upper red line acts as a hard resistance. Previously, price attempted to test this zone but was strongly rejected, leaving behind a long upper wick.
VAL (Value Area Low - 1.3322): The lower yellow line is the crucial support floor. This is where buyers stepped in aggressively during the most recent dip on December 17.
3. Specific Price Levels
Immediate Resistance: Just above the current price lies the descending trendline and the VAH zone (1.3401). Only a clean break above this area would return the trend to bullish with a target of 1.3440.
Immediate Support: The recent low of the candle cluster is around 1.3360. If an hourly candle closes below this level, price will likely seek the VAL zone (1.3322).
Other Technical Signs: The blue/red dots (likely Parabolic SAR or a trend filter) are currently sitting just above the price, adding slight downward pressure on GBP/USD.
4. General Outlook
GBP/USD is currently in a "coiled spring" state. The upcoming price movement depends entirely on which side gains enough momentum to push the price out of the triangle pattern and the POC zone. Since the price is at the convergence point of major trendlines, high volatility usually follows such a sideways period.

EURUSD Analysis : Bullish Bias Setup + Demand Zone + ReversalEURUSD – 30 Minute Chart Analysis
Market Structure Overview
EURUSD initially moved in a strong bullish trend, creating higher highs and higher lows. This impulsive rally shows aggressive buying pressure and momentum expansion. However, after reaching the recent high, price failed to sustain upside continuation and started showing loss of bullish strength.
This shift marked the beginning of a distribution phase, where smart money began offloading positions rather than pushing price higher.
Breakdown from Consolidation
After the top formation, price entered a tight consolidation / triangle structure, signaling indecision and compression. This pattern acted as a continuation structure to the downside. Once price broke below the triangle, it triggered a strong bearish continuation, confirming that sellers had taken control.
The breakdown was clean, impulsive, and backed by strong candle bodies — a clear sign of bearish displacement.
Liquidity Sweep & OPL Reaction
Following the breakdown, price aggressively moved lower, sweeping liquidity below recent lows. The OPL level acted as a minor pause point but failed to hold, confirming that buyers were weak and stops were being consumed.
This move was necessary to clean out weak longs before price reached a more meaningful demand area.
Reversal Zone (Demand Area)
The highlighted Reversal Zone at the bottom is a key demand / accumulation area, where price previously showed strong bullish reactions. As price entered this zone, selling pressure slowed, and small bullish candles began to appear, signaling potential absorption of sell orders.
This behavior suggests that smart money may be accumulating long positions at discounted prices.
Potential Recovery Scenario
If price continues to hold above the reversal zone and forms:
Higher lows
Bullish engulfing candles
Strong rejection wicks
Then a corrective bullish move becomes likely. The projected path shows a step-by-step recovery rather than an aggressive reversal, which is typical after a sharp sell-off.
Bearish Invalidation
If price closes decisively below the reversal zone with strong momentum, this bullish recovery idea becomes invalid. In that case, the market may continue lower toward deeper liquidity zones.
Trader’s Mindset
This is a reaction-based setup, not a prediction. The best trades will come only after confirmation inside the reversal zone. Patience here separates disciplined traders from emotional ones.
Key reminders:
Zones are areas, not exact prices
Confirmation > early entry
Protect capital first
Final Thoughts
EURUSD is currently trading at a high-decision demand zone after a strong bearish move. The next candles will be crucial in defining whether this is just a pause or the beginning of a meaningful recovery. Let price confirm before committing to a trade.

BTC/USD 4-hour Analysis I 12/181. Price Structure & Trend Analysis
Main Trend: The chart shows a strong downward movement from the $93,200 area down to a low near $85,200. Currently, the price is in a consolidation phase following this sharp drop.
Current Price: BTC is trading around $86,812 (according to the real-time data on the chart).
Candlestick Patterns: We see short-bodied candles with long wicks on both sides, indicating market indecision at this short-term bottom.
2. Volume Profile Analysis
Your chart displays key zones using the Fixed Range Volume Profile:
VAH zone (Value Area High): Around $87,800 - $88,000. This acts as immediate resistance. A breakout above this zone would signal a clearer recovery.
POC zone (Point of Control): Around $86,214. This is the level with the highest traded volume in the current range. The fact that price is holding above the POC is a slightly bullish sign, suggesting buyers are attempting to defend this level.
VAL zone (Value Area Low): Around $85,600. This is the crucial support floor. If a 4-hour candle closes below this zone, BTC could seek lower support levels (towards the $84,000 area).
3. Key Levels to Watch
Resistance:
$88,766: The yellow horizontal line; a strong former supply zone.
$90,209: The black horizontal line (a major psychological level).
$93,206: The previous peak where the sell-off originated.
Support:
$86,200: The current POC area.
$85,200: The most recent swing low. A break below this would turn market sentiment extremely bearish.
4. Outlook & Strategy
The market is currently in a "wait-and-see" mode. After a heavy drop, prices usually need time to move sideways to absorb selling pressure.
Bullish Scenario: If the price closes a 4h candle above $88,000 (breaking VAH), BTC could rally toward the $90,200 region.
Bearish Scenario: If price loses the $86,000 mark, selling pressure may return to test deeper support at $84,000 - $84,300.
Note: This analysis is based on technical data; the crypto market is highly volatile. You should combine this with macro news for more accurate decision-making.

Gold Is Holding Firm Into Year-End — A Santa Rally Is Setting UpGold on H4 continues to trade in a strong bullish structure, consolidating just below the key resistance zone around the previous high. Price is holding comfortably above the rising EMA base, with higher lows intact, confirming that buyers remain in control despite short-term pullbacks. This sideways-to-higher behavior beneath resistance signals absorption rather than distribution, as selling pressure fails to force acceptance below the support zone. Structurally, this is a classic bullish consolidation, where the market pauses to build liquidity before the next directional move.
From a macro perspective, the setup is supported by typical year-end dynamics. As liquidity thins into the Christmas period, markets often shift into range compression followed by sharp directional expansions. At the same time, expectations around U.S. monetary policy remain tilted toward easing in 2025, keeping real yields capped and limiting sustained USD strength. Combined with ongoing geopolitical and macro uncertainty, this environment continues to favor Gold as a defensive asset.
As long as price holds above the support zone and maintains acceptance below resistance, the bullish bias remains intact. A clean breakout and hold above resistance would likely open the path toward a new ATH, while failure to break simply extends consolidation rather than signaling a top. For now, this is a patience phase OANDA:XAUUSD is not stalling, it is positioning.

EURUSD Is Correcting Inside an Uptrend — Not Rolling OverHELLO GUYS
TICKMILL:EURUSD on H4 remains structurally bullish, with price continuing to respect a well-defined ascending channel. The recent pullback from the upper boundary is a normal corrective move rather than a breakdown, as price has rotated back toward the mid-to-lower channel area where dynamic support from the rising EMAs is converging. Higher highs and higher lows are still intact on the broader structure, indicating that buyers remain in control despite short-term volatility.
From a price-action perspective, the current decline looks corrective and overlapping, not impulsive. As long as price holds above the channel base and the 1.1700–1.1720 support region, the bullish structure remains valid. This zone acts as a decision area: holding it favors another rotation higher toward the channel top, while a clean break below would signal a deeper correction rather than immediate trend reversal.
From a macro standpoint, this technical behavior aligns with ongoing EUR–USD dynamics. While the U.S. dollar has seen intermittent strength from short-term data releases, the broader rate differential outlook between the Fed and ECB is no longer widening aggressively. Markets are increasingly pricing a stabilization phase in monetary policy expectations, which limits sustained USD upside and allows EURUSD to remain bid within its trend. This macro backdrop supports corrective pullbacks being bought rather than extended sell-offs.
In summary, FOREXCOM:EURUSD is in a healthy pullback within a bullish channel. As long as structural support holds, the path of least resistance remains higher toward the upper channel and prior highs. This is a wait for Support reaction environment patience is required until price confirms continuation or invalidation with clear intent.

Ethereum Is Absorbing Supply — The Break Comes After PatienceEthereum on H1 is holding inside a well-defined sideways range following the sharp impulsive sell-off, with price now rotating between a defended support zone and a capped resistance band around the 3,000–3,020 area. This type of tight consolidation after an aggressive move lower signals absorption rather than continuation, as sellers fail to push price into acceptance below support while buyers are not yet strong enough to reclaim resistance. The structure suggests balance and compression, not trend resolution, with liquidity building on both sides of the range.
From a macro perspective, this behavior aligns with the broader crypto environment. Risk sentiment has stabilized, and while liquidity conditions are not expanding aggressively, there is no fresh macro shock to justify another impulsive leg down. Expectations around U.S. monetary policy remain relatively steady, limiting USD strength and allowing crypto assets like ETH to consolidate instead of breaking down. However, the lack of strong liquidity inflows also explains why upside remains capped and corrective for now.
As long as ETH continues to hold the support zone, downside is likely limited to range rotation rather than trend continuation. A clean acceptance above the resistance zone would signal alignment between technical structure and macro conditions, opening the path toward a stronger recovery move. Until that breakout occurs, this is a patience phase the edge appears only when price leaves the range with clear intent.

Gold Is Trapped Between Control ZonesGold on H1 remains locked inside a clearly defined range, with price oscillating between a well-defended support zone around 4,260 and a heavy resistance band near 4,350–4,360. The broader structure is still constructive, as higher lows continue to form above the rising EMA base, confirming that buyers have not lost control. Repeated failures to accept above resistance show that sellers are active at the highs, compressing price rather than reversing the trend a classic balance phase where liquidity is building on both sides. From a macro perspective, this consolidation aligns with a cautious market stance ahead of key U.S. data and ongoing uncertainty around Fed policy, where neither USD strength nor risk-off flows are decisive enough to force a breakout. As long as real yields remain capped and expectations around rate cuts stay supportive, downside moves in Gold are more likely corrective than trend-breaking. A clean acceptance above the resistance zone would signal macro and technical alignment for expansion toward new highs, while rejection simply prolongs consolidation and reinforces patience. In this environment, chasing moves inside the range offers low edge the opportunity emerges only when price exits the box with clear intent.

BTC Is Quietly Accumulating Below 86KBTC/USD H1 — Market Update
Bitcoin is currently trading around 85,600, consolidating after a sharp impulsive sell-off from the 90,070 high. The aggressive drop flushed short-term liquidity and forced price into a range-bound re-accumulation phase, which is clearly visible inside the highlighted box.
Key Levels From the Chart
Major Resistance: 90,070
→ Previous supply zone and key breakout level. A reclaim above this level would confirm trend continuation.
EMA 34 (H1): 87,541
EMA 89 (H1): 88,947
→ Both EMAs are acting as strong dynamic resistance, explaining why upside is capped for now.
Accumulation Range: 85,200 – 86,400
→ Price is oscillating inside this box, showing balance between buyers and sellers.
Current Price: ~85,639
Market Structure & Expectation
BTC is not breaking down further despite heavy selling a sign of absorption.
The zigzag price action inside the box suggests liquidity building, not weakness.
As long as 85,200 holds, downside risk remains limited.
Once liquidity is fully built, a range expansion is likely.
Scenarios
Base case: Continued sideways movement between 85,200 – 86,400
Bullish scenario: Break above range → reclaim 87,500, then acceleration toward 90,070
Invalidation: Clean break below 85,200 would open deeper downside

Bitcoin Just Did This at Support… Is the Bounce RealBTC/USD – H4 MARKET ANALYSIS
1. Current Market Structure
Bitcoin has completed a sharp bearish impulse and is now reacting from a clearly defined support zone. The strong sell-off flushed liquidity below the previous range, followed by an immediate bounce a typical sign of demand absorption rather than trend continuation to the downside.
At the moment, price is transitioning into a recovery phase, but the structure remains corrective, not impulsive yet.
2. Key Zones & Market Positioning
Support Zone: ~85,300 – 85,900 → Strong demand area where buyers stepped in aggressively
Target 1: ~87,900 → First reaction level / prior structure resistance
Target 2: ~89,900 → Range high / key liquidity pool
Target 3: ~94,000 – 95,000 → Major resistance & supply zone (higher timeframe)
3. Price Action & Liquidity Behavior
- The rejection from the support zone shows long lower wicks and follow-through buying
- This suggests sell-side liquidity has been absorbed
- Current pullbacks are shallow, indicating buyers are defending higher lows
This behavior aligns with a relief rally → consolidation → continuation structure.
4. Market Scenarios
Primary Scenario (High Probability):
- Price holds above the support zone
- Builds a higher low structure
- Gradual push toward Target 1, followed by Target 2
- If momentum accelerates, expansion toward Target 3
Alternative Scenario:
- Failure to hold above the support zone
- Strong bearish close below demand
- Would invalidate the bullish recovery and open deeper downside
5. Trading Perspective
Bias: Buy the pullback, not chase the breakout
Best opportunities lie near demand, not at resistance
Market is currently recovering, not reversing trend fully yet
Summary
Bitcoin is not collapsing.
It is stabilizing, absorbing liquidity, and preparing for a potential multi-leg recovery.
As long as the support zone holds, the roadmap remains clear:
Demand → Recovery → Targets expansion.

ETH Finishes Wave 5 — Is an ABC Reversal Starting?ETH/USD – H4 MARKET ANALYSIS
1. Market Structure
- Ethereum has completed a full 5-wave bearish Elliott structure (1–2–3–4–5).
The strongest selling pressure appeared during Wave (3), followed by a final capitulation move at Wave (5).
- After reaching the Wave (5) low, price failed to make a new low and instead began forming a small accumulation base, signaling seller exhaustion.
This confirms that the bearish impulse has ended, and the market is transitioning into a corrective recovery phase.
2. Elliott Wave Context
Wave (5) completion → end of the bearish cycle
Price reaction from the low aligns with Wave A
Current structure suggests a corrective ABC move, not a trend reversal
Expected path:
Wave A: Initial technical rebound
Wave B: Shallow pullback to absorb supply
Wave C: Continuation higher toward resistance
3. Key Technical Zones
Demand Zone: Wave (5) low (critical invalidation level)
Resistance 1: Previous Wave (4) structure
Resistance 2: Higher structural + MA confluence (Wave C target)
As long as price holds above the Wave (5) low, the corrective scenario remains valid.
4. Scenario Outlook
✅ Primary Scenario (High Probability)
Price holds above Wave (5) low
ABC correction continues to unfold
Wave C pushes price higher into resistance
This is a technical rebound, not a macro trend reversal
⚠️ Alternative Scenario
Strong breakdown below Wave (5) low
→ Elliott structure invalidated
→ Bearish trend resumes
5. Trading Bias
Short-term: Buy the dips within the ABC structure
Avoid chasing impulsive moves
Focus on pullbacks during Wave B
Strict risk management is required — this is a corrective phase
Summary
Ethereum has completed a bearish Elliott cycle and is now entering a corrective ABC recovery.
As long as the Wave (5) low holds, short-term upside remains favored.

Bitcoin Is Pausing — Not BreakingBitcoin on H1 is transitioning into a controlled consolidation following the sharp impulsive move, with price now rotating inside a well-defined range below resistance. The recent pullback failed to trigger continuation lower and instead formed a higher low within the structure, signaling that sellers are losing momentum while buyers continue to defend demand.
This price behavior points to absorption rather than distribution. Liquidity is building inside the range as the market digests the prior impulse, with neither side showing enough strength yet to force expansion. As long as BTC holds above the lower boundary of the structure, the bias remains constructive, favoring a gradual rotation back toward the upper range and the Target 2–Target 3 area.
From a macro perspective, this consolidation aligns with a broader wait-and-see environment across risk assets, as markets remain sensitive to U.S. macro data and expectations around monetary policy. With no decisive shift in liquidity conditions or risk sentiment, Bitcoin is mirroring that uncertainty through range-bound price action rather than trend continuation.
A clean acceptance above resistance would signal alignment between technical structure and macro conditions, opening the door for continuation. Until then, this remains a patience phase chasing moves inside the range offers low edge, and direction will only reveal itself once price exits the structure with clear intent.

Gold Is Quiet — And That’s Exactly When Breakouts Are BuiltGold is not breaking out yet — it is building pressure.
After the impulsive move, price is now compressing inside a clear accumulation zone, showing repeated defenses from buyers while sellers fail to push price meaningfully lower. This sideways structure signals absorption rather than weakness. As long as Gold holds above the 4,260–4,270 key zone, the broader bullish structure remains intact and the market is preparing for expansion. A clean break and hold above this range would open the path toward breaking the old ATH. Until that happens, this is a patience phase not a chase phase.

BTC Is Quiet… That’s When Explosions Begin.BITCOIN (BTC/USD) – 1H MARKET ANALYSIS
1. Current Market Structure
Bitcoin has completed a sharp bearish impulse, followed by a clear range based consolidation inside a defined demand zone. Price is no longer making lower lows aggressively, indicating selling pressure has been absorbed. The market is transitioning from distribution into accumulation on the 1H timeframe.
Key observation:
- Strong impulsive drop → liquidity grab
- Sideways compression → energy building phase
This is not random ranging it is structured consolidation after a sell-off.
2. Key Zones & Liquidity Mapping
Demand / Accumulation Zone: ~85,200 – 86,300
→ Area where buyers are actively defending and absorbing sell orders.
Mid Resistance: ~87,700 – 88,000
→ First reaction zone once price breaks the range.
Major Resistance / Target: ~89,800 – 90,000
→ Prior supply + liquidity resting above equal highs.
As long as price remains above the demand zone, downside risk is limited.
3. Market Psychology
This is the phase where:
- Retail traders lose patience due to slow movement.
- Weak hands exit positions inside the range.
- Smart money accumulates quietly at discounted prices.
The repeated up–down movement inside the green box is liquidity engineering, not indecision.
4. Primary Scenarios
Main Scenario (Preferred):
Continued consolidation inside the demand zone.
Formation of higher lows within the range.
Break above range high → momentum expansion.
Target progression:
TP1: ~87,800
TP2: ~89,000
TP3: ~89,800–90,000
Invalidation Scenario:
Clean 1H close below ~85,200.
Would open downside continuation currently low probability based on structure.
5. Summary & Trading Insight
Bitcoin is behaving exactly as expected after a strong sell-off:
✔ Liquidity taken
✔ Accumulation confirmed
✔ Breakout preparation in progress
This is a patience market. Those who wait for structure confirmation will be positioned ahead of momentum traders.
The market rewards discipline, not urgency. Stay aligned with structure not emotions.

Ethereum May Have Finished the Sell-Off — Now Comes the TestOn the H4 timeframe, Ethereum’s price action aligns well with a completed 5-wave Elliott impulse to the downside. Wave (1) initiated the breakdown from the prior distribution range, followed by a weak corrective Wave (2) that failed to regain structure. Wave (3) unfolded as the strongest and most extended leg lower, confirming dominant bearish momentum a textbook characteristic of a third wave. This was followed by a shallow, overlapping Wave (4), before ETH printed a final Wave (5) sell-off into the 2,880–2,950 region, where downside momentum visibly slowed, suggesting selling exhaustion.
With Wave (5) likely completed, ETH now appears to be transitioning into a corrective ABC structure to the upside. The initial rebound from the lows can be interpreted as Wave A, followed by a potential pullback to form Wave B, before a broader Wave C advance toward the upper resistance zone around 3,400–3,450. This type of move would represent a technical recovery, not a confirmed trend reversal, consistent with post impulse Elliott behavior.
From a macro perspective, this Elliott setup fits the current environment. Broader crypto markets are stabilizing as risk sentiment improves modestly and no new liquidity shock is present. Expectations around U.S. monetary policy remain relatively steady, with yields no longer accelerating higher a condition that reduces pressure on risk assets like ETH. However, the absence of aggressive liquidity expansion also implies that any upside is more likely corrective and structured, rather than impulsive and trend-defining.
In summary, as long as the Wave (5) low holds, the Elliott framework supports a recovery via an ABC correction. A decisive break below that low would invalidate the count and reopen bearish continuation risk. Until confirmation is clear, patience remains critical the edge lies in letting both structure and macro conditions align before committing.

CHART ANALYSIS H4 I 12/181. Overall Trend Analysis
Dominant Bullish Trend: The price is in a strong upward structure starting from the 4,170 area. It is consistently making higher highs and higher lows.
Momentum: The trendline drawn from the 13th is steeply inclined, indicating that buying pressure (bullish momentum) is firmly in control in the short term.
2. Volume Profile Analysis
The chart utilizes the Volume Profile tool to identify key Value Areas (where the most trading activity occurred):
POC (Point of Control) - 4,327.137: This is the price level with the highest traded volume. The price is currently hovering around this level, acting as the market's "fair value" or equilibrium point.
VAH (Value Area High) - 4,345.301: This acts as the immediate resistance. A breakout above this zone would signal a continuation of the rally.
VAL (Value Area Low) - 4,308.414: This is the critical support zone. If the price dips here, a strong buying response is expected.
3. Price Action Scenarios (Based on the Chart)
1. Trend Continuation Scenario (Breakout)
This scenario follows the strong prevailing upward momentum shown on the chart.
Condition: Price completely breaks through the VAH (4,345.301) zone with a long-bodied 4h candle, closing decisively above it.
Action: Open a Buy order when the price returns to retest the 4,345 level.
Take Profit (TP): Next psychological levels such as 4,360 - 4,375.
Stop Loss (SL): Place below the POC (4,327) zone.
2. Correction and Bounce Scenario (Buy on Dip)
This is considered the safest scenario when the price is at a high range and needs to "gather steam."
Condition: Price fails to break 4,345 and turns downward. At this point, the steep Trendline and the VAL (4,308.414) zone will act as primary support.
Action: Wait for the price to drop to the 4,308 - 4,310 area. Watch for a rejection signal (Pinbar) or a bullish reversal candle pattern to enter a Buy order.
Take Profit (TP): Return to the POC (4,327) and the previous peak (4,345).
Stop Loss (SL): Place below the 4,300 level (a round-number psychological support).
3. Reversal/Breakdown Scenario (Broken Trendline)
This scenario occurs when buying pressure is exhausted.
Condition: Price closes below the VAL (4,308) zone and breaks the ascending Trendline. This confirms that the bullish structure has been breached.
Action: Consider a short-term Sell order. However, exercise caution as the long-term trend remains bullish.
Take Profit (TP): Price is likely to seek the liquidity gap (the large empty space on the chart) at the 4,260 - 4,270 level.
Stop Loss (SL): Place above the POC (4,327).
4. Key Levels Summary
Resistance (VAH): 4,345.301 – The ceiling. Breaking this opens the door to new all-time highs.
Pivot (POC): 4,327.137 – The "Battlefield." Current price action is revolving around this level.
Support (VAL): 4,308.414 – The floor. This is the primary defense line for the bulls.
5. Final Conclusion & Advice
Primary Strategy: Given the strong uptrend, "Buying the Dips" near 4,327 or 4,308 is statistically safer than trying to time a top (shorting).
Risk Warning: Gold is trading at extreme historical highs (4,300+ range). Volatility will be very high. Pay close attention to US economic news (marked by the US flag icons at the bottom), as these events often trigger sharp "liquidity sweeps" (stop-loss hunting).
All trading signals, analyses, and shared content are provided for educational and informational purposes only and do not constitute financial or investment advice. The market involves risk, and past performance does not guarantee future results.
Each trader is responsible for their own decisions and risk management. Please ensure you understand the risks involved and trade only with capital you can afford to lose.

XAUUSD – Buyers Remain in ControlHello everyone, it’s great to see you again.
Today, the gold market continues to test the new support area around USD 4,300 per ounce and is attracting mild bullish momentum as the U.S. labor market remains relatively stable but shows early signs of slowing. Bearish sentiment toward the U.S. dollar, driven by the Federal Reserve’s accommodative monetary policy, combined with ongoing risk-off sentiment, is providing positive support for the precious metal.
At the time of writing, gold is up around USD 20 from the session low. In the short term, OANDA:XAUUSD maintains a mild bullish trend, with key support levels located at USD 4,270 and USD 4,300.
I remain optimistic in this analysis, with the first upside target at the USD 4,350 resistance level, followed by a potential push toward the record zone around USD 4,375.
And you - what’s your view on gold at this stage?

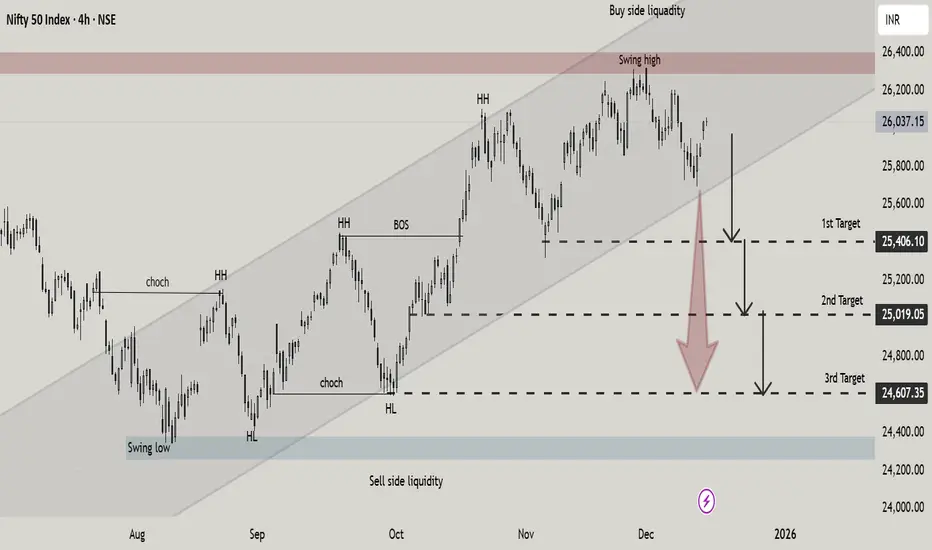
NIFTY 50 Rejection & Downside Targets in Focus NIFTY 50 on the 4H timeframe has reached a key buy side liquidity zone near the upper boundary of an ascending channel. After forming a swing high price shows signs of distribution and potential reversal. A downside move is anticipated toward sell-side liquidity with projected targets at 25,406, 25,019, and 24,607. Bias remains bearish below the recent highs.