PayPal: Further Downside ExpectedPayPal initially extended its decline as anticipated, before a modest upward rebound began to emerge. Overall, bearish momentum should primarily persist, likely pushing price below the $50.18 support level and completing the broader correction of the beige wave II. However, there is also a 39% probability that beige wave alt.II has already concluded. In that scenario, the stock would currently be developing a magenta upward impulse and would be in the process of forming (or would have already formed) the low of wave alt. . Wave alt. would then bring further gains, potentially breaking through resistance at $94.97.
Chartanalysis

EUR/USD Ready for Lift-Off from Ascending SupportThe EUR/USD pair is testing a strong ascending trendline near 1.1565, signaling a potential bullish rebound. A breakout above 1.1585 could trigger upward momentum toward 1.1620, aligning with the bullish setup shown by the rocket illustration.
1. Ascending Trendline Support
The chart shows a clear upward-sloping trendline, connecting higher lows from November 9 to November 12.
The price is currently testing this support zone (~1.1565), suggesting buyers may defend this level.
---
2. Bullish Reversal Potential
The drawn rocket symbol and arrows indicate a bullish scenario — a possible rebound from the trendline toward higher targets.
If momentum holds above 1.1560–1.1570, a short-term bullish reversal is likely.
---
3. Key Resistance Levels
Immediate resistance: 1.1585 — breaking and closing above this may confirm a bullish push.
Next resistance target: 1.1620 — this is the projected short-term goal indicated by the chart’s upper blue band.
---
4. Ichimoku Cloud Context
The Ichimoku cloud (Kumo) is slightly above price action, meaning some resistance remains ahead.

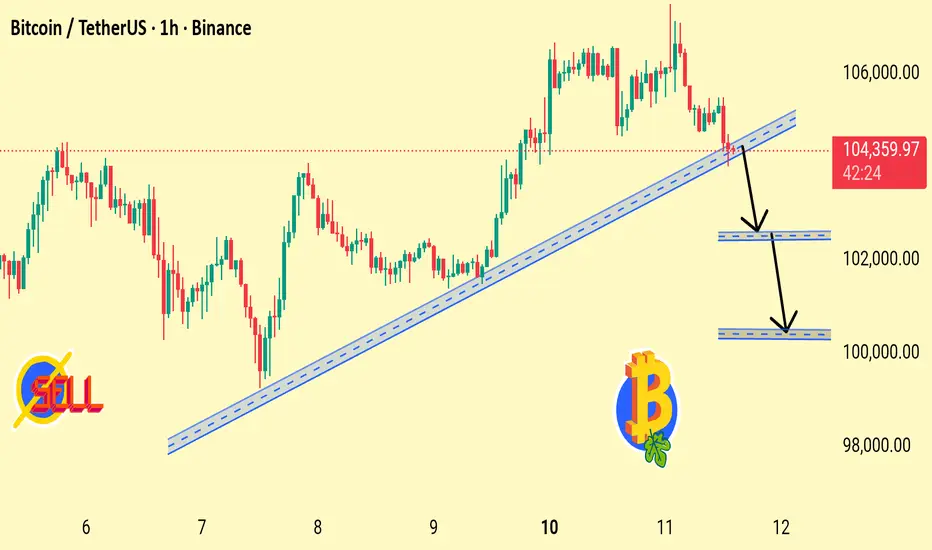
Bitcoin Losing Trendline Support Possible Drop Toward Key DemandBTC has broken below the rising trendline, signaling weakening bullish momentum. Price may retest $102,500 and potentially dip toward the $100,000 support zone if sellers continue to dominate.
1. Trendline Break Detected
BTC has fallen below the rising trendline that supported the uptrend from Nov 7–11. This signals weakening bullish structure.
2. Momentum Turning Bearish
The rejection near 105,000 and sharp drop indicate sellers are stepping in aggressively.
3. First Support Zone: $102,500
Chart shows the first demand zone here. If BTC stabilizes above this level, a bounce is possible — but weakness still remains.
4. Second Support Zone: $100,000
A deeper drop could test the psychological round number. Strong liquidity is expected at this level.
5. Trend Structure Changing
Breaking the trendline + lower highs = possible shift from bullish to short-term bearish trend.
EURGBP FRGNT Daily Forecast & Full Pre LDN Open BreakdownQ4 | 46📅 Q4 | W46 | D13 | Y25 |
📊 EURGBP FRGNT Daily Forecast & Full Pre LDN Open Breakdown
🔍 Analysis Approach:
I’m applying Smart Money Concepts, focusing on:
Identifying Points of Interest on the Higher Time Frames (HTFs) 🕰️
Using those POIs to define a clear trading range 📐
Refining those zones on Lower Time Frames (LTFs) 🔎
Waiting for a Break of Structure (BoS) for confirmation ✅
This method allows me to stay precise, disciplined, and aligned with the market narrative, rather than chasing price.
💡 My Motto:
"Capital management, discipline, and consistency in your trading edge."
A positive risk-to-reward ratio, paired with a high win rate, is the backbone of any solid trading plan 📈🔐
⚠️ Losses?
They’re part of the mathematical game of trading 🎲
They don’t define you — they’re necessary, they happen, and we move forward 📊➡️
🙏 I appreciate you taking the time to review my Daily Forecast.
Stay sharp, stay consistent, and protect your capital
— FRNGT 🚀
FX:EURGBP

SCRT/USDT – Testing support. Will the scenario repeat?Secret - is a privacy-focused blockchain built on Cosmos. Its smart contracts, called Secret Contracts, enable DApps to utilize private data on Secret, similar to how smart contracts function on other blockchains. However, Secret Contracts transmit encrypted data through encrypted channels without exposing it. This is made possible by encrypting the contract state during execution.
All the charts are cropped, so I found a more complete historical chart of the coin and overlaid it to the left.
This coin has dropped by approximately -98% since its distribution. To put it in perspective, if you had invested $1,000 , you would now have only $20 …
We observe a formation resembling an internal channel (120%) and an external channel (280%) . The price is once again being squeezed near support at the lowest price zones available on Binance (where the main liquidity is).
My previous trading idea played out successfully in three zones .
Profit from the time of publication to the squeeze: +270%.
The price is moving within a descending channel , but at the same time, the sideways range I previously anticipated is also forming. Here, it’s crucial to adapt to the situation.
Right now, the entire market is experiencing a pullback toward support levels .
I've marked potential final liquidity grab zones on the chart—consider these in your trading strategy.
Also, I want to highlight how negative the news sentiment is at the moment. No one believes in a rally. But that's exactly how it always looks in similar price reversal zones !)))

S&P500: Slightly higherS&P 500 futures edged slightly higher in yesterday’s session. The index appears to remain within the upward trajectory of magenta wave (5), which is expected to continue pushing higher. Once this wave reaches its peak, the larger blue wave (III) should also complete. Afterward, we anticipate a corrective phase in the form of magenta wave (A), which could put renewed pressure on the index. However, if prices reverse course and fall below the support level at 6,371, our alternative scenario will come into play. In that case, alternative wave alt.(4) would likely extend further downward, targeting a low within the corresponding alternative zone between 6,055 and 5,822 points (probability: 30%).

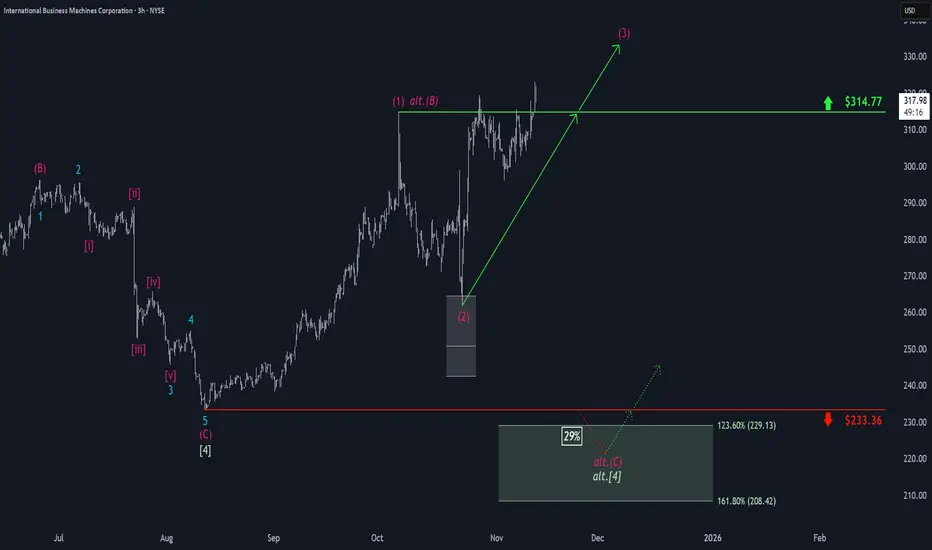
IBM: Breaking Out Above Key ResistanceIBM shares have been contending with stubborn resistance at $314.77 for the past two weeks. After an initial breakout attempt was firmly rejected, the stock has made three more efforts to decisively clear this level—and today, it once again surged purposefully above that mark. In the near term, we expect the high of magenta wave (3) to be established. If the alternative scenario plays out, however, a pullback into our green alternative Target Zone between $229.13 and $208.42 will be likely (probability: 29%).
AUDUSD FRGNT Daily Forecast - Q4 | W46 | D12 | Y25 |📅 Q4 | W46 | D12 | Y25 |
📊 AUDUSD FRGNT Daily Forecast
🔍 Analysis Approach:
I’m applying Smart Money Concepts, focusing on:
Identifying Points of Interest on the Higher Time Frames (HTFs) 🕰️
Using those POIs to define a clear trading range 📐
Refining those zones on Lower Time Frames (LTFs) 🔎
Waiting for a Break of Structure (BoS) for confirmation ✅
This method allows me to stay precise, disciplined, and aligned with the market narrative, rather than chasing price.
💡 My Motto:
"Capital management, discipline, and consistency in your trading edge."
A positive risk-to-reward ratio, paired with a high win rate, is the backbone of any solid trading plan 📈🔐
⚠️ Losses?
They’re part of the mathematical game of trading 🎲
They don’t define you — they’re necessary, they happen, and we move forward 📊➡️
🙏 I appreciate you taking the time to review my Daily Forecast.
Stay sharp, stay consistent, and protect your capital
— FRNGT 🚀
OANDA:AUDUSD

EURGBP FRGNT Daily Forecast & Breakdown -Q4 | W46 | D12 | Y25 |📅 Q4 | W46 | D12 | Y25 |
📊 EURGBP FRGNT Daily Forecast & Breakdown
🔍 Analysis Approach:
I’m applying Smart Money Concepts, focusing on:
Identifying Points of Interest on the Higher Time Frames (HTFs) 🕰️
Using those POIs to define a clear trading range 📐
Refining those zones on Lower Time Frames (LTFs) 🔎
Waiting for a Break of Structure (BoS) for confirmation ✅
This method allows me to stay precise, disciplined, and aligned with the market narrative, rather than chasing price.
💡 My Motto:
"Capital management, discipline, and consistency in your trading edge."
A positive risk-to-reward ratio, paired with a high win rate, is the backbone of any solid trading plan 📈🔐
⚠️ Losses?
They’re part of the mathematical game of trading 🎲
They don’t define you — they’re necessary, they happen, and we move forward 📊➡️
🙏 I appreciate you taking the time to review my Daily Forecast.
Stay sharp, stay consistent, and protect your capital
— FRNGT 🚀

AVAX Rally Keeps Bullish Outlook Intact Avalanche (AVAX) has recently posted significant gains, leaving our outlook unchanged. We continue to believe price is currently in a five-wave magenta upward move, which should soon push it above the resistance level at $36.19. Our alternative scenario also remains valid, in which AVAX could target new absolute lows below support at $8.64 (probability: 33%).

Coca-Cola: Fresh Upside MomentumAfter some recent setbacks, Coca-Cola shares have regained upward momentum. Blue wave (y) is expected to first break through resistance at $74.38, potentially pushing price into our beige Target Zone, which ranges from $76.58 to $81.51. In this area, we anticipate the completion of the same-colored impulse wave III. Once this wave is complete, a significant correction is likely to follow. For this reason, we view this range as an opportunity to establish short positions. If beige wave alt.III has already concluded, price could drop directly below $60.62 (probability: 32%).

XRP: Target Zone in sightRipple’s XRP has seen a modest rebound recently, but this hasn’t altered our outlook. We continue to expect further declines as part of a blue five-wave move down into the turquoise Target Zone ($1.03–$0.38), which is suitable for long-side entries. Within this zone, we anticipate that the low of the larger wave B in turquoise will be established. From there, we expect wave C to rally above resistance at $4.09 and complete the larger wave (Y) in magenta. We still assign a 30% probability to the scenario in which the low of wave alt.B in turquoise has already been reached.

Coinbase: Progress and DistractionCoinbase initially made progress in line with our primary scenario, moving just below the support level at $291.50 before a notable rebound to the upside. Our primary expectation is that price will soon reverse and head down toward our magenta Target Zone between $255.42 and $173.05, where we anticipate the low of magenta wave will be established. In wave , we then expect the rally to continue past resistance at $444.65, which makes the magenta zone an attractive entry point for long positions. We still see the possibility of gains above the $444.65 resistance occurring earlier than expected. In this 30% likely scenario, we would anticipate an early wave alt. top, meaning the magenta wave alt. would already be complete. In that case, our magenta Target Zone would no longer be relevant.

GOLD at Immediate support ? What's next ??#GOLD... Market made a fresh supporting area/region
That will be from 4078 to 4085
Keep close and sustain above means further rise expected..
Good luck
Trade wisely

Ethereum: Slipped belowEthereum recently slipped back below support at $3,357 and is currently struggling to reclaim this level. In line with our primary scenario, we expect further downside below this threshold to complete magenta wave within the lower magenta Target Zone ($2,749 – $2,149). From there, a significant corrective rally is likely, targeting the high of magenta wave (B) in the upper magenta Target Zone ($5,805 – $7,326).

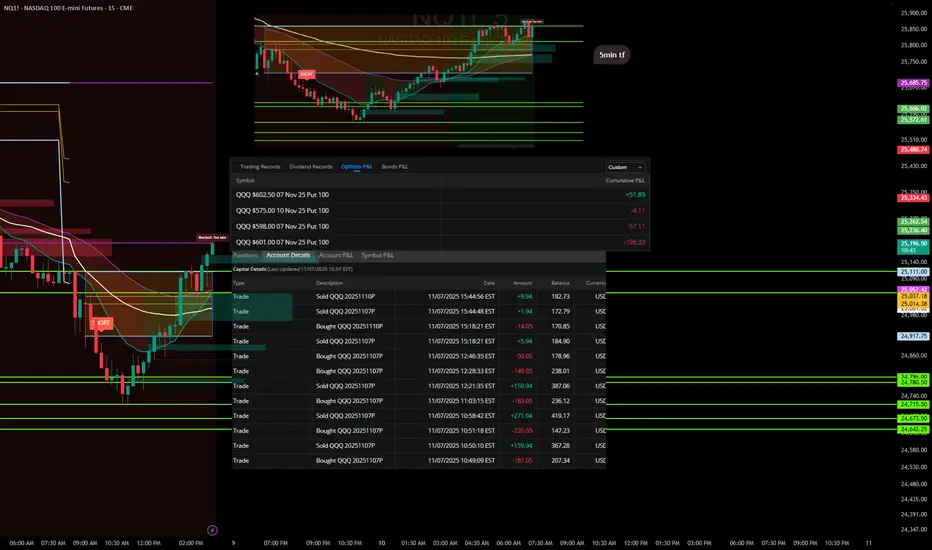
Trades with B – Daily Recap (Nov 7, 2025) "Lesson Learned"Ticker: QQQ / NQ1!
Strategy: ORB Pro + Fib Confluence + EMA Trend Filters
Result: Small red day – self-inflicted
🧭 Market Context
Today’s price action gave a clear short opportunity during the mid-morning fade, but momentum stalled mid-session. The first entries lined up beautifully with the ORB breakdown and EMA confluence, offering solid profits early on.
Where it fell apart was after the first wins — I overstayed, chasing secondary flushes that never came. The market started to base, and I kept expecting continuation instead of taking what the chart gave me.
📉 Trade Summary
Multiple put entries between $601–$602 levels
Early trades locked quick gains (+$271.94, +$159.94)
Gave back a chunk re-entering late into chop
Final P/L across contracts: -$205.66 total
Cumulative Options P/L breakdown:
QQQ $602.50 07 Nov 25 Put – +$51.89
QQQ $575 10 Nov 25 Put – -$4.11
QQQ $598 07 Nov 25 Put – -$57.11
QQQ $601 07 Nov 25 Put – -$196.33
💡 Lessons & Takeaways
The first clean move is often the best move. Don’t overcomplicate a confirmed win.
Late-day trades = low probability. Volume dries up, conviction fades.
Protect the capital, not the ego. There’s no “making up” missed points — only protecting what’s already earned.
🧘♂️ Reflection
“The setup worked, but I didn’t. I tried to extract more from a move that was already complete. Next time, once my target hits, I’m walking away.”
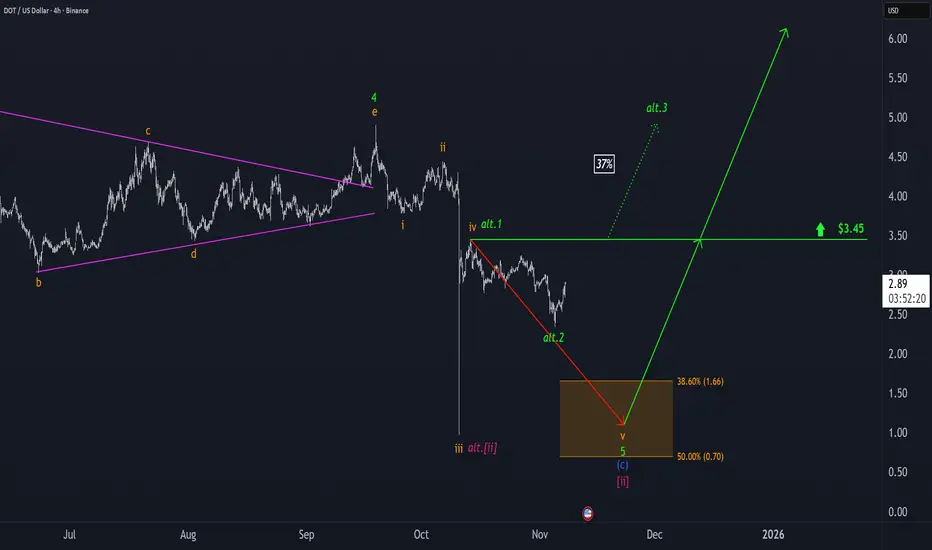
Polkadot: Ready to Bounce Straight Back Up?For now, we continue to expect that DOT will be sold off into our orange Target Zone between $1.66 and $0.70—which could offer attractive long entry opportunities – and complete magenta wave . However, we estimate there’s a 37% chance that the significant low is already in place and that the altcoin could break out directly above resistance at $3.45; in this scenario, our Target Zone would no longer be relevant.
S&P500: Rebound S&P 500 futures managed to stage a modest rebound in yesterday’s session and are now showing renewed upward momentum. In our primary scenario, we expect magenta wave (5) to continue climbing and to ultimately mark a final high that completes the larger blue wave (III). Afterward, we anticipate a corrective phase via magenta wave (A), which should pull the index toward support at 6,371 points. However, if prices drop directly below the 6,371 points support, our alternative scenario will come into play. In that case, the alternative wave alt.(4) would likely extend further downward, finding its low within the magenta alternative Target Zone between 6,055 and 5,822 points.

Palo Alto Networks: Pullback Follows New All-Time HighPalo Alto initially climbed to a new all-time high, but the upward momentum soon faded, leading to a notable pullback. However, we expect the stock to recover soon and, as part of the magenta wave (3), break through resistance at $232.29. The following waves (4) and (5) are also projected to develop above this level, further fueling the ongoing upward trend. That said, we still see a 37% chance that PANW will instead complete (or has recently completed) turquoise wave alt.B below the $232.29 mark. In that scenario, wave alt.C could trigger sell-offs to a new low for magenta wave alt.(2) , though support at $139.18 should remain intact.

Nvidia: Acceleration Toward New Highs Nvidia gained strong upward momentum shortly after our last update, surging past the $196.45 mark, which had previously served as resistance. As a result, our prior short-term alternative scenario was triggered, and we have now adjusted the chart accordingly (with minor modifications). We now view the green wave as complete and believe that the joint top of green wave and beige wave III, as well as the low of wave IV, have already been established. The Target Zone we had initially set for the wave- low has therefore been removed. In our updated short-term alternative scenario, we still see a 30% probability of a new low for beige wave alt.IV below the $176.21 support level. In this case, however, price would likely rebound above the lower $145.50 level.

BTC 4H Trade Idea Here is an trade idea for Bitcoin on 4H time frame.
BTC has renounced from important daily reversal zone. Looks good here for upside.
Entry & Exit Points are given with RR of 2.13. Amazing!!!!!
DYOR NFA..

eBay: Confirming Wave [ii] Top Right on ScheduleeBay rallied once again to test resistance at $101.15, but quickly reversed with sharp sell-offs, confirming the top of magenta wave in a timely manner. Since then, the stock has moved as anticipated below the $86.36 level and now appears poised for further declines as part of wave . The subsequent wave- corrective move higher should remain capped below $86.36, allowing wave to complete turquoise wave 1 at a lower level—though still above $55.96.

HTZ:From Breakdown to Breakout,Bullish Reversal Gaining TractionHertz Global Holdings, Inc. (NASDAQ: HTZ)
Technical Outlook: Potential Reversal Following Structural Breakout
Date : 5 November 2025
Summary
Hertz Global Holdings (HTZ) has exhibited signs of a potential medium-term trend reversal following a prolonged downtrend since mid-2023. Multiple bullish technical signals — including a breakout from key continuation patterns, RSI divergence, and sustained support retests — point toward a possible shift in market sentiment.
Price Action and Technical Developments
1. Downtrend continuation : Since July 2023, HTZ has been in a persistent downtrend, reinforced by a breakdown below major horizontal support.
2. Symmetrical triangle breakdown (Feb 2024) : The stock failed to hold within a consolidation structure, confirming bearish momentum at that stage.
3. Bullish divergence (Sept 2024) : Despite registering new price lows, the RSI formed higher highs, suggesting weakening downside momentum and potential for reversal.
4. Falling wedge breakout (Nov 2024) : Price action reversed from a classic bullish pattern, followed by a strong rally through the end of November.
5. Symmetrical triangle breakout (Apr 2025) : HTZ broke out of consolidation on elevated volume, coinciding with a break above the long-term descending trendline — a key technical inflection point.
6. Current setup (Nov 2025) : The share price is consolidating within a falling channel. On 4 November 2025, it rebounded from a confluence of supports — including the uptrend line from September 2024 and prior resistance turned support — reinforcing near-term bullish bias.
Trading Idea
Entry Zone: 4.71 - 5.50
Target: 10.50 and 15.00
Support: 4.71
Conclusion
After a long downtrend, HTZ is showing a clear shift in momentum. With multiple bullish patterns confirmed and strong support holding, the stock may be entering a new uptrend phase toward USD 10.50 and USD 15.00.
