BUYING SOME UNI HERE🔥 Fortune AI Radar — CRYPTOCAP:UNI
Fresh activity detected on CRYPTOCAP:UNI today.
Data suggests increasing market interest & buyers stepping in.
Technicals currently lean bullish, with momentum trending upward.
Whales showing hints of accumulation and hype rising among trader
Chart Patterns

#ETC/USDT The price is moving within an ascending channel#ETC
The price is moving within a descending channel on the hourly timeframe. It has reached the lower boundary and is heading towards a breakout, with a retest of the upper boundary expected.
The Relative Strength Index (RSI) is showing a downward trend, approaching the lower boundary, and an upward bounce is anticipated.
There is a key support zone in green at 8.41, and the price has bounced from this level several times. Another bounce is expected.
The indicator is showing a trend towards consolidation above the 100-period moving average, which we are approaching, supporting the upward move.
Entry Price: 8.70
First Target: 8.95
Second Target: 9.20
Third Target: 9.50
Stop Loss: Below the green support zone.
Remember this simple thing: Money management.
For any questions, please leave a comment.
Thank you.

BTC analysis🎯 Upside targets:
75,071 (0.5 Fib)
78,612 (0.618 Fib)
⚠️ Major resistance zone between 75K – 79K, possible rejection area.
✅ This is a pullback buy inside a downtrend → take profits step by step.

DOGEUSDT at Critical Zone — Reversal Setup or Continuation LowerThe Dogecoin / Tether (DOGEUSDT) pair on the 5-Day timeframe is currently in a macro downtrend phase after failing to maintain a higher-high structure in the upper distribution zone.
Price continues to form:
Lower Highs
Lower Lows
Sustained selling pressure since rejection at the 0.28 area
At the moment, price has returned to a historical demand zone (yellow block) which previously acted as a major accumulation base before the 2024–2025 bullish impulse.
Key zone: 0.099 – 0.084
---
Structure & Pattern Formation
1. Macro Downtrend Structure
Clearly visible:
Distribution at 0.28
Structure breakdown at 0.19
Failed reclaim at 0.153
Continuation lower into demand
This confirms sellers still dominate the higher-timeframe structure.
---
2. Descending Continuation / Bearish Market Structure
Sequence observed:
LH → LL → LH → LL
Every pullback rejected at resistance
As long as there is no Break of Structure (BOS) above 0.153, the trend remains bearish.
---
3. Demand Zone Reaction Area
Yellow block (0.099 – 0.084) represents:
Previous accumulation base
Origin of major bullish impulse
Likely institutional interest zone
An early reaction is visible via a long lower wick (buying response), but no confirmed reversal yet.
---
Key Levels
Resistance
0.116 → Minor supply / recent rejection
0.153 → Structure resistance
0.199 → Mid distribution
0.284 → Macro supply
Support / Demand
0.099 → Upper demand
0.084 → Extreme demand
0.071 → Macro low invalidation
---
Bullish Scenario
Bullish continuation is valid if demand holds.
Confirmation steps:
1. Price holds above 0.099
2. Forms a base / sideways accumulation
3. Break & close above 0.116
4. BOS above 0.153
Upside targets:
0.153 (major resistance)
0.199 (mid-range)
0.284 (macro supply)
Expected structure:
Double Bottom / W pattern
Accumulation range
Formation of Higher Low
If volume enters at demand, mid-term reversal potential increases.
---
Bearish Scenario
Bearish continuation occurs if demand fails.
Main triggers:
Daily / 5D close below 0.084
Lack of significant buyer reaction
Consequences:
Macro structure breakdown
Liquidity sweep of prior accumulation
Downside targets:
0.071 (macro low)
0.060 – 0.055 (next historical support)
If this plays out → it signals distribution is not finished and the market enters a deeper markdown phase.
---
Conclusion
Macro trend: Bearish
Current position: Inside major demand
Decisive zone: 0.099 – 0.084
Most likely current phase:
Re-accumulation or
Continuation distribution before final leg down
Reaction inside this zone will determine whether DOGE prepares for a mid-term reversal or continues printing new lows.
#DOGE #DOGEUSDT #Dogecoin #CryptoAnalysis #TechnicalAnalysis #Altcoin #CryptoTrading #SupportResistance #SupplyDemand #MarketStructure #TradingViewIdeas #CryptoMarket #BullishScenario #BearishScenario #Accumulation #Distribution

bear market startAccording to my analysis, Bitcoin will drop to the $70,000 range, and this drop is certain.

USDCHF - ShortI am anticipating a weak Dollar against the Swiss Franc for a continuation to the downside.


Sell USDCADUSDCAD presenting a selling opportunity early in the week. A head and shoulders pattern can be seen on the 1hr chart

XAUUSD LOOKING REALLY BEARISH AFTER AN ALL TIME HIGHGols look like it's changing changing from bullish to bearish. It is at a resistance level that I think it'll push it down again and possibly give us a lower low!!

DE30EURDE30's lows are failing to break above and close above these highs; they are now forming a pattern that might end up retesting the loss and possibly pushing down further.

EUR/USD Has a Bull Trap_Watch 1.1918 ShoulderHello guys,
I see a bull trap in the EUR/USD currency pair and explained my trading plan for the upcoming week in this video. I hope you like it, and do not hesitate to share your thoughts with me. I am waiting for your comments, so let me know what you think about this bull trap.

EURJPY:Head and Shoulders Breakdown, Bearish ContinuationEURJPY has formed a Head and Shoulders reversal pattern on the H4 timeframe, with a confirmed neckline break around the 181.0-181.2 area, signaling a shift in short-term structure toward the downside.
Following the breakdown, price moved below key moving averages, and the current bounce appears to be a technical retest of the neckline region.
This zone also aligns with the 0.705-0.79 Fibonacci retracement area, increasing the probability of continued bearish momentum. The main scenario favors further downside toward 178.4, with extended targets near the 176.7-176.5 support zone, which represents a stronger higher-timeframe level. As long as price remains below 182.1-182.3, sellers maintain control.
The alternative scenario would activate if price reclaims and holds above 182.3, invalidating the pattern and reopening the path toward 183.5-185.0.
This is not investment advice. Trading decisions should be based on confirmed structure and price reaction.

Weekly Bias — 16 FebruaryMarkets rarely break cleanly higher from that setup without shaking out late longs first
Trend is still structurally bullish
From a swing trader perspective, risk/reward is cleaner short than long at these highs
Upside continuation from $600 to $650 is +8%
Downside rotation to $545 is -9%
Downside probability is higher near resistance than upside breakout probability
Breadth hasn’t collapsed — so this is not broad panic, it’s selective leadership, or a narrowing tape & that increases odds of fast air pocket pullback before continuation
The tape is leaning toward distribution before continuation
Not full trend reversal, but a liquidity flush to reset positioning
Given resistance, probability favors expansion down first
Now volatility is re-awakening = unstable equilibrium
If momentum expands & price pushes slightly above recent highs, then closes back inside range with larger daily volume, it's bull trap with volatility ignition
You want to be positioned when that happens — not after
If you buy calls here without breakout, you’re paying for expansion that may go the wrong way
This is not a dip-buy environment
This is sell the rips inside a developing corrective structure
Given weekly rejection, distribution signals, short-term edge still favors downside volatility expansion
Short squeezes are possible
That’s short-term bounce energy inside a broader weakening momentum structure
Trend continuation higher unlikely without reset
Fair value likely sits closer to $560–$575
This was prior consolidation + breakout base formed
Markets revert to value before continuation
Markup → distribution → early markdown, not crash, but a 6–10% pullback probability rising
Most traders will look at momentum indicators & think, “oversold, bounce incoming"
That’s lazy analysis & context matters
Oversold inside a range ≠ bullish
In a strong uptrend oversold = buy dip
In a topping/distribution phase oversold = early downside momentum building
We are no longer in a clean upper-band walk
We’re in lower high at $636, rolling daily structure & momentum divergences everywhere
Oversold here is momentum confirmation, not reversal signal
This is still controlled selling, but controlled selling becomes expansion once support breaks
$600 is the pivot
Break $600 with expanding daily range → downside accelerates
Hold $600 & reclaim $615 → you get chop/bounce trap
Ideal entry
Daily close under $600
Range > prior 5 day average
RSI < 45
That’s when momentum synchronizes
Then target $580 → $565
If price reclaims $620
RSI reclaims 55–60
Then this becomes failed breakdown
Until then, oversold is not bullish — it’s pressure building
Momentum is shifting downward under resistance & we're one structural break away from real expansion
Below $592 (S3), the structure opens to $580 fast
Then $565 pocket
Then $550 shelf
Once S3 fails on a daily close, Gamma likely shifts negative
That’s when speed increases
Weekly timeframe bull traps lead to multi-week downside
If weekly momentum shifts, first real magnet isn’t $580 — it’s the mid-$560s/$540s area
If price pops back toward $620–$625
Fails to reclaim $630
Prints another upper wick weekly
That confirms institutional selling into strength
Weekly momentum is rolling over (RSI lower high vs price marginal high)
MACD histogram fading while price stalls near highs
Volume expanded into the recent peak — not what you want for continuation
This appears like a late-cycle wave 5 exhaustion → transition into multi-week corrective structure
Not a crash setup, but definitely corrective risk
On the daily chart
Lower high $636 → failure to expand
Breakdown from $629 → $607 impulse
Bear flag forming between $600–$616
Price riding below short MAs
Daily momentum rolling over
MACD negative cross building
$616–$618 = supply
$621 pivot = major rejection level
$600 = psychological + short-term support
$592 = S3/structure breakdown
$580 = real demand
We are compressing below VWAP/short MAs & that’s bearish positioning, not bullish compression
This looks like a bear flag inside early weekly correction
Clear descending channel
Lower highs stacking ~$617 → $615 → $612 → $608
Momentum making weak bounces
MACD failing to expand on green pushes
RSI cannot hold >50
No hidden bullish divergence worth trading
If $601 fails again, flush to $598 → $595
When tech stalls while defensives hold — correction probability increases
SPY still holding highs, but momentum fading
DIA stronger (defensive rotation)
IWM stalling under prior highs
XLK not expanding
XLF rolling
XLY stalling
This is narrowing leadership
Given structure, dealers likely short Gamma under $600
25Δ puts are are sitting near $590
25Δ calls near $630
OI clustered around $600 & $620
IV > 20d HV → long premium needs directional conviction
Put IV > call IV → skew favoring downside hedge
If $600 breaks → acceleration
Given recent realized vol compression
Rough weekly 1σ likely around ±15–20 points
So upside 1σ $620–$625 & downside 1σ $585–$590
Market is sitting mid-range
That means better risk/reward is shorting failed rallies than buying dips
1. Bull Trap
$616–$621 reclaim without momentum expansion
Especially if volume fades
2. Bear Trap
Hard flush to $590–$592 that immediately reclaims $600
Until one of those triggers — bias is lower highs
The market is leaning
Distribution under $620
Preparing for test of $592
Possible weekly move toward $580 if $600 decisively breaks
Not crash — controlled correction
1. Break $600 → long Puts
Target $592 & $580 in extension
Invalidation on reclaim of $607
This gives clean expansion move
2. Failed bounce into $616–$620 → long puts
Entry on rejection candle + momentum rollover
Target $600 retest & $592 in extension
3. Daily close > $621 with strong breadth → long calls
Target $629 & $636 in extension
This would invalidate bear flag
Until then, calls are countertrend scalps only
Your edge right now is fading weak upside, playing breakdowns & avoiding emotional dip calls

USDCAD — Clean Breakdown Setup Toward 1.35000USDCAD presents a very interesting opportunity this week. It looks like one of those setups where, after a clear break of support, we can enter on the pullback.
In my view, this is not a situation that requires multiple confirmations — the breakdown itself could be sufficient reason to enter a short position.
The potential target for this move could be around 1.35000.
Personally, I’ll be closely monitoring this pair at the start of the week.
#Pouyanfa🔥

$TRIA (1H) price analysis.BYBIT:TRIAUSDT is currently trading in a key decision zone, with price approaching major demand areas that will determine the next directional move. Based on current market structure and liquidity positioning, two clear scenarios are in play.
Scenario 1 – Bullish Continuation:
If price makes a healthy retracement into the Buying Breaker Block at $0.02052–$0.01853 and shows bullish confirmation, buyers are likely to step in. Holding this zone keeps the structure bullish and opens the path for upside continuation toward higher resistance levels, with momentum targeting the $0.025–$0.028 range.
Scenario 2 – Deeper Pullback / Trend Risk:
If price fails to hold the breaker block and takes a sharp retrace into the Last Buying Zone at $0.01449–$0.01347, this area becomes the final support for bulls. A strong reaction here can still lead to a bullish reversal; however, a clean breakdown and acceptance below the last buying zone would officially confirm a bearish trend, signaling a shift in market control to sellers.
Summary:
Holding above demand zones favors bullish continuation, while a loss of the last buying zone confirms bearish market structure. Traders should wait for confirmation at key levels to manage risk effectively.

EURUSD — Watching the Midline for a Breakout SignalThe euro deserves a spot on this week’s watchlist. For nearly a week now, on the 15-minute timeframe, price has been stuck inside a range and has not been able to properly break and hold above the range midline.
We remain buyers on EURUSD, as the higher timeframe trend is still bullish, and we are looking for long signals.
If price can close above the range midline — preferably with a strong 1-hour candle — it could act as a solid trigger for a long position and potentially lead to a breakout from the top of the range.
However, if the range breaks to the downside, we will need to reassess the structure and carefully evaluate the selling momentum before making any decisions.
#Pouyanfa 🔥

Chart Analysis – Bullish Reversal Toward Resistance
The 1-hour chart of Gold vs US Dollar (XAU/USD) shows a strong bullish recovery after a sharp sell-off. Price has reclaimed a key demand zone and is now pushing toward a major resistance level.
🟢 1. Demand Zone Holding (Bullish Structure Intact)
Price sharply dropped into the 4,880–4,920 support area
Strong rejection from the lows (highlighted reaction zone)
Higher low formed after the bounce
Momentum shifted bullish with consecutive higher highs and higher lows
This confirms buyers stepped in aggressively at discount levels.
🔴 2. Stop Loss Zone
The marked 4,930–4,950 region acts as invalidation.
A break below this zone would:
Disrupt bullish structure
Indicate potential continuation downside
Suggest failed breakout attempt
As long as price remains above this level, bullish bias remains valid.
🟩 3. Current Resistance Zone
Price is now testing 5,020–5,060 supply area
This zone previously acted as consolidation and breakdown area
Reclaiming and holding above it turns it into support
A clean breakout and close above 5,060 increases probability of continuation.
🎯 4. Upside Target
If breakout confirms:
Next major resistance: 5,120–5,150
Strong momentum could extend toward the psychological 5,200 region
📊 Technical Structure Summary
Level Type Price Zone Meaning
Major Support 4,880–4,920 Strong demand reaction
Invalidation 4,930–4,950 Stop loss area
Breakout Level 5,020–5,060 Key resistance flip
Target Zone 5,120–5,150+ Upside objective
📌 Bias: Bullish Above 4,950
Holding above support → continuation likely
Break and close above 5,060 → acceleration expected
Failure below 4,930 → bearish pressure returns
If you'd like, I can also provide:
A short trading plan version
Risk-to-reward breakdown
Intraday scalp vs swing perspective
Or convert this into a caption for social media 🚀

Polkadot (DOT): Looking For Another 15% Bullish MovementSeeing good potential for another 15% movement where we are about to form a proper BOS on the 30M timeframe, but there is that bearish CME gap that we also keep an eye on!
More in-depth info is in the video—enjoy!
Swallow Academy

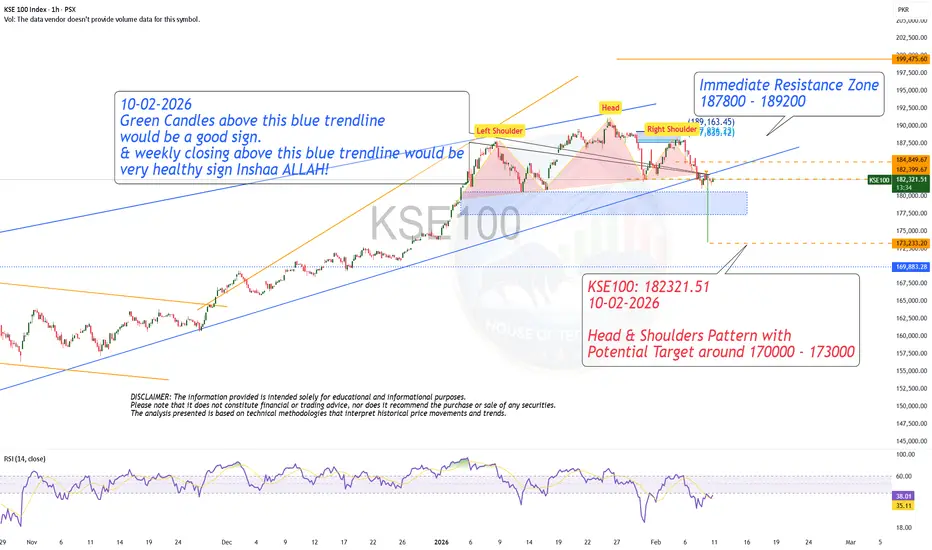
H & S Pattern - Cautious Approach!KSE100: 182321.51
10-02-2026
Head & Shoulders Pattern with
Potential Target around 170000 - 173000
USOIL: Bulls Will Push
The analysis of the USOIL chart clearly shows us that the pair is finally about to go up due to the rising pressure from the buyers.
Disclosure: I am part of Trade Nation's Influencer program and receive a monthly fee for using their TradingView charts in my analysis.
❤️ Please, support our work with like & comment! ❤️

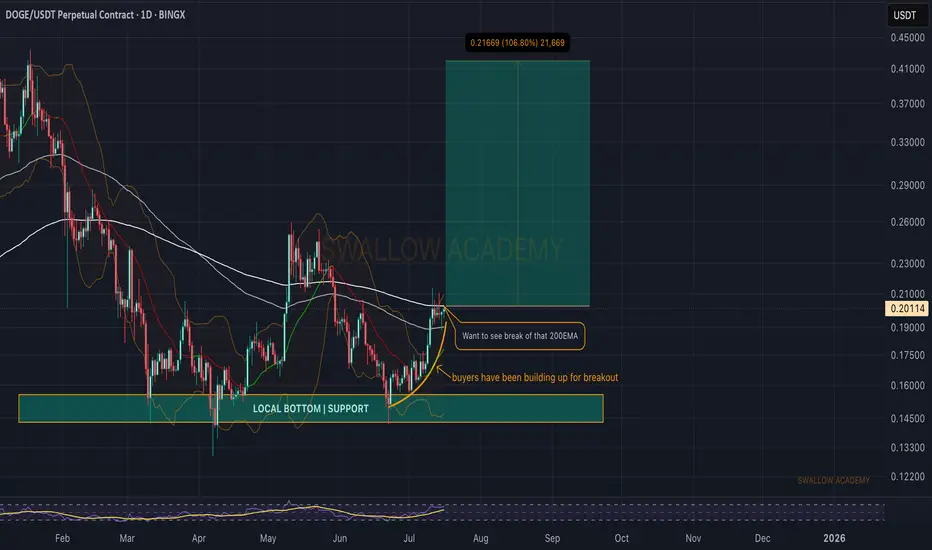
Dogecoin (DOGE): About To Breakout and Start Strong Bullish MoveDogecoin has been on our radars for quite some time, and we had a nice bounce since last time (from the local bottom).
Now we are approaching the breakout point (200 EMA) area, where upon seeing the break we should start a strong upward movement.
Swallow Academy
Shiba Inu (SHIB): Looking For Breakout | Do Not Miss It...Do not miss the breakout that we might see about to happen. We are looking for a breakout on SHIB coin where once we get that breakout from the zone of accumulation (sideways channel), we are going to look for further movement to upper target zones from there!
Swallow Academy

SPY On The Rise! BUY!
My dear subscribers,
SPY looks like it will make a good move, and here are the details:
The market is trading on 681.65 pivot level.
Bias - Bullish
My Stop Loss - 678.64
Technical Indicators: Both Super Trend & Pivot HL indicate a highly probable Bullish continuation.
Target - 687.62
About Used Indicators:
The average true range (ATR) plays an important role in 'Supertrend' as the indicator uses ATR to calculate its value. The ATR indicator signals the degree of price volatility.
Disclosure: I am part of Trade Nation's Influencer program and receive a monthly fee for using their TradingView charts in my analysis.
———————————
WISH YOU ALL LUCK
