TeraWulf Inc. (WULF)TeraWulf Inc. I am looking for an entry today. triangle has being breached, which looks like W4. upside potential 20.00+
Chart Patterns
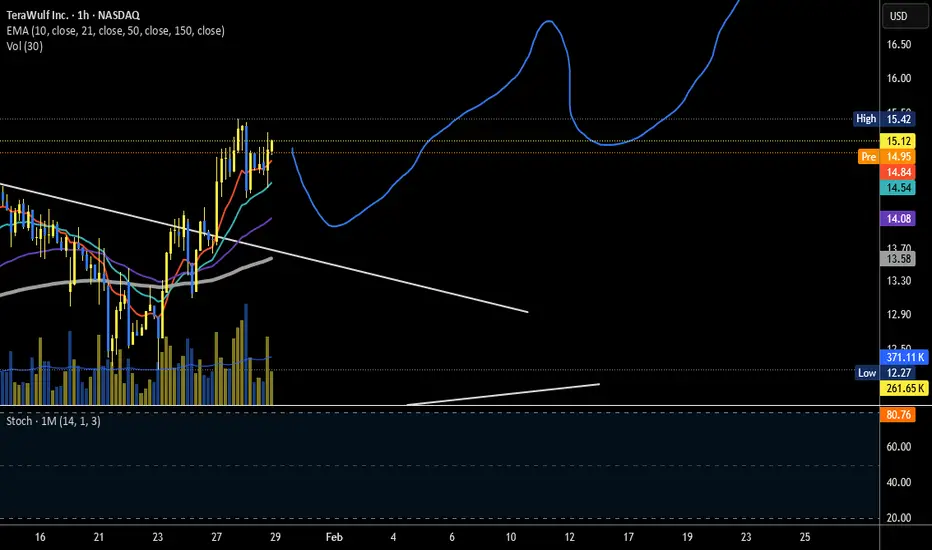
Bullish and continuationDepending on were this lands after earnings call, I believe this is still bullish. It will need to consolidate a few times before going higher.

GOLD: Short Trading Opportunity
GOLD
- Classic bearish formation
- Our team expects fall
SUGGESTED TRADE:
Swing Trade
Sell GOLD
Entry Level - 5519.7
Sl - 5571.4
Tp - 5439.8
Our Risk - 1%
Start protection of your profits from lower levels
Disclosure: I am part of Trade Nation's Influencer program and receive a monthly fee for using their TradingView charts in my analysis.
❤️ Please, support our work with like & comment! ❤️

USTEC | Symmetrical Triangle pattern | Wait for BreakoutMacro theme:
- Headlines this Jan are dominated by geopolitical friction, specifically the US-Eurozone trade tensions over Greenland, painting a picture of imminent fragility. However, a rigorous look at the latest data reveals a stark disconnect between news-flow and economic reality.
- While the market frets over potential tariff wars, the fundamental macro backdrop has quietly settled into a "Goldilocks" zone. Despite the alarming rhetoric, the data points to a resumption of steady global GDP growth and continued disinflation in 2026.
- We are witnessing a classic divergence between perceived risk and actual economic health.
. Growth is Robust: Far from a recession, Oxford Economics has actually raised its 2026 US GDP forecast to 2.8%, the top end of the forecaster range, driven by AI-related investment and productivity gains.
. The "Worst-Case" isn't Fatal: Even if the US-Eurozone trade dispute escalates to a full "trade war" (currently a 20% probability), modelling suggests a hit to US GDP of only 0.5%. The economy would remain resilient, with growth at ~2.3%.
- Credit Conditions are Green: The proprietary credit conditions index has turned positive for the first time since late 2021, signaling ample liquidity.
- For asset allocators, retrenching into cash due to headline fear is likely over cautious. The strategy now requires precision, not retreat.
Technical approach:
- USTEC is consolidating within a broader range. The index bounced off EMA78 on retest and closed above EMA21. The index is still in a sideways phase captured by a Symmetrical Triangle pattern, awaiting an apparent breakout to determine the next trend.
- If USTEC breaches above the Symmetrical Triangle and the resistance at 26100, the index may surge to test the 100% Fibonacci Extension at 26620.
- On the contrary, remaining below 26100 may prompt a retreat toward the support at 25150.
Analysis by: Dat Tong, Senior Financial Markets Strategist at Exness

GBPCAD Will Explode! BUY!
My dear friends,
Please, find my technical outlook for GBPCAD below:
The price is coiling around a solid key level - 1.8660
Bias - Bullish
Technical Indicators: Pivot Points High anticipates a potential price reversal.
Super trend shows a clear buy, giving a perfect indicators' convergence.
Goal - 1.8717
Safe Stop Loss - 1.8632
About Used Indicators:
The pivot point itself is simply the average of the high, low and closing prices from the previous trading day.
Disclosure: I am part of Trade Nation's Influencer program and receive a monthly fee for using their TradingView charts in my analysis.
———————————
WISH YOU ALL LUCK

GOLD (XAU/USD) SHORT SIGNAL
Entry: Around current levels ~5,520 - 5,549 (near the fake breakout / resistance rejection zone after testing the red area high)
Bearish confirmation: Fake breakout above previous resistance (failed to hold highs), rejection candles + potential reversal from overextended rally; some fundamental pressures like possible profit-taking or shifting macro sentiment adding weight
Target: 5,434 – 5,420 (marked target zone / lower support area) or deeper toward 5,400 if momentum builds
Stop Loss: Above 5,550–5,560 (above the recent fakeout high / red zone to invalidate the short) Cautious bearish setup on this potential trap after the explosive run—watching for downside follow-through! #Gold #XAUUSD #GoldPrice #ShortGold #Fakeout #Trading #PreciousMetals #Commodities Not financial advice — This is just my personal view based on the chart and some fundamental context. Gold remains in a strong long-term bull trend overall, but short-term reversals can be sharp. Trading involves high risk—do your own research, use strict risk management, and only trade what you can afford to lose!

ASTER Update🚨📊 ASTER Update
A new red resistance zone has formed 🔴.
Until price breaks out above this zone,
selling pressure remains in control.
This level is key to watch 👀,
waiting for confirmation before any bias shift.

BTC/USDT 4H — Liquidity Sweep at Support Followed by Bullish RetMarket Structure
Overall structure:
Price was in a descending / consolidation phase, then formed an ascending channel (bullish corrective structure).
You marked a BOS (Break of Structure) earlier → confirms prior bearish pressure.
The move down into the support zone was followed by a fake breakout (liquidity sweep), which is typically bullish.
👉 This suggests smart money accumulation below support before moving price up.
2. Support Zone & Fake Breakout
Support zone: ~87,400 – 87,000
Price dipped below prior lows, triggering stop-losses (fake breakout), then reclaimed the zone.
This is a classic liquidity grab, often followed by a strong impulse move.
✅ This strengthens the bullish bias as long as price holds above the support zone.
3. Current Pullback
After reaching the target point (~90,500 – 90,600), price rejected and pulled back.
The pullback is healthy and aligns with:
Previous structure
Channel support
Demand zone
🔍 This looks like a retest, not a trend reversal (yet).
4. Trade Idea Shown on Chart
📈 Long Setup Logic
Entry zone: ~87,400
Stop loss: ~86,050
Target: ~90,500 – 90,600
📊 Risk–Reward:
Roughly 1:2.5 to 1:3, which is very solid.
5. Bullish Scenario (Preferred)
Price holds above 87,000
Forms a bullish 4H confirmation (engulfing / strong close)
Continuation toward:
89,500 (minor resistance)
90,500+ (major liquidity & resistance)
6. Bearish Invalidation
🚨 The setup fails if:
4H candle closes below 86,000
Support zone is lost decisively
If that happens, next downside targets could be:
84,800
83,500 (higher timeframe demand)
7. Summary
✅ Fake breakout + reclaimed support = bullish signal
✅ Structure favors continuation upward
⚠️ Still a retest phase, confirmation matters
🎯 Target zone aligns with liquidity & resistance

Bullish Double Bottom - AUDJPYHello traders,
on Tuesday, 27 Jan, the AUDJPY reached the support line.
The price has formed a Double Bottom pattern,
and currently, the neckline is broken!
Based on this bullish structure, I expect a bullish move.
🎯 TARGET: 108.150

IRENDear Traders
many friends requested this stock
here my deep analysis and clean one. for IREN
its bullish on weekkly monthly
lets see if this can play out
comment and like

SPX500 H4 | Bullish ContinuationMomentum: Bullish
Price is currently above the ichimoku cloud.
Buy entry: 6,976.08
- Pullback support
- 23.6% Fib retracement
Stop Loss: 2,946.65
- Swing low support
Take Profit: 7,017.09
- Swing high resistance
High Risk Investment Warning
Stratos Markets Limited (fxcm.com/uk), Stratos Europe Ltd (fxcm.com/eu):
CFDs are complex instruments and come with a high risk of losing money rapidly due to leverage. 69% of retail investor accounts lose money when trading CFDs with this provider. You should consider whether you understand how CFDs work and whether you can afford to take the high risk of losing your money.
Stratos Global LLC (fxcm.com/en): Losses can exceed deposits.
Please be advised that the information presented on TradingView is provided to FXCM (‘Company’, ‘we’) by a third-party provider (‘TFA Global Pte Ltd’). Please be reminded that you are solely responsible for the trading decisions on your account. Any information and/or content is intended entirely for research, educational and informational purposes only and does not constitute investment or consultation advice or investment strategy. The information is not tailored to the investment needs of any specific person and therefore does not involve a consideration of any of the investment objectives, financial situation or needs of any viewer that may receive it. Past performance is not a reliable indicator of future results. Actual results may differ materially from those anticipated in forward-looking or past performance statements. We assume no liability as to the accuracy or completeness of any of the information and/or content provided herein and the Company cannot be held responsible for any omission, mistake nor for any loss or damage including without limitation to any loss of profit which may arise from reliance on any information supplied by TFA Global Pte Ltd.
Stratos Trading Pty. Limited (fxcm.com/au):
Trading FX/CFDs carries significant risks. FXCM AU (AFSL 309763), please read the Financial Services Guide, Product Disclosure Statement, Target Market Determination and Terms of Business at fxcm.com/au

Opportunity :: Nifty SHORT (appx 3%)Nifty making lower lows. Chart is self exoplanetary. EMAs are in favour.
With a STOP 25320, can ride down side wave.
🤞

LCILCI Weekly – Summary
Trend is still bullish.
Price is at strong support (270–260).
Pattern: bullish falling wedge / consolidation.
Volume confirms accumulation.
Buy Zone: 270–280
Stop: Weekly close below 255
Targets: 320 → 360 → 400+ → 450

GOLD current supporting area, holds or not? 543 -74#GOLD.. market just reached near to today 2nd supporting area that is around 5473 74
so keep close n sustain above means another bull run on the table.
NOTE: we will go for cut n reverse below 5473 on confirmation.
good luck
trade wisely

GBPUSD: breakout setup toward 1.3940🛠 Technical Analysis: On the H1 chart, GBPUSD remains in a strong bullish structure after the “global bullish signal,” with price continuing to print higher highs and higher lows. The pair is now consolidating just below the key resistance band around 1.3843–1.3850, suggesting a potential squeeze before the next directional move. An ascending support trendline is holding the pullbacks, keeping the short-term momentum constructive. Price is trading above the SMA 50, while SMA 100 and SMA 200 stay well below, confirming trend strength. A clean breakout and hold above the resistance zone would likely trigger continuation toward the next upside objective near 1.3939. If the breakout fails, a retest of the trendline and the nearest support zone around 1.3680 becomes the first level to watch for buyers to defend.
———————————————
❗️ Trade Parameters (BUY)
———————————————
➡️ Entry Point: Buy on a confirmed breakout and hold above 1.38431–1.38500
🎯 Take Profit: 1.39391
🔴 Stop Loss: 1.37788
⚠️ Disclaimer: This is a potential trade idea based on current analysis; market conditions and price direction are subject to change based on news factors and volatility.

SPX500 4H: Post-Diagonal Correction WaveS&P500(SPX500) 4H Outlook:
① Bias: Bearish
② Main Count:
Large Flat A-B-C underway from October 30 high.
(a) wave of B-wave Zigzag (a)-(b)-(c) completed as Ending Diagonal.
Now entering (b)-wave pullback.
Targets: Fib 50% ~6,763 | Fib 78.6% ~6,618.
Then (c)-wave rise to 7,100–7,150 (Resistance Zone), ending B wave.
Followed by Flat C decline to 6,200–6,000 zone as primary scenario.
③ Alternative (Stronger Bearish):
Invalidation on daily close below 6,510.73.B wave likely already complete
(Zigzag/Double Zigzag from Nov 21 low),
leading to immediate sharp drop toward 6,200–6,000.
#SPX #SP500 #ElliottWave

DAX corrective pullback support at 24400The DAX remains in a bullish trend, with recent price action showing signs of a corrective pullback within the broader uptrend.
Support Zone: 24400 – a key level from previous consolidation. Price is currently testing or approaching this level.
A bullish rebound from 24400 would confirm ongoing upside momentum, with potential targets at:
25033 – initial resistance
25180 – psychological and structural level
25340 – extended resistance on the longer-term chart
Bearish Scenario:
A confirmed break and daily close below 24400 would weaken the bullish outlook and suggest deeper downside risk toward:
24200 – minor support
23990 – stronger support and potential demand zone
Outlook:
Bullish bias remains intact while the DAX holds above 24400. A sustained break below this level could shift momentum to the downside in the short term.
This communication is for informational purposes only and should not be viewed as any form of recommendation as to a particular course of action or as investment advice. It is not intended as an offer or solicitation for the purchase or sale of any financial instrument or as an official confirmation of any transaction. Opinions, estimates and assumptions expressed herein are made as of the date of this communication and are subject to change without notice. This communication has been prepared based upon information, including market prices, data and other information, believed to be reliable; however, Trade Nation does not warrant its completeness or accuracy. All market prices and market data contained in or attached to this communication are indicative and subject to change without notice.

The Day Ahead data-heavy session aheadMarkets head into a data-heavy session with the focus on US activity and trade, Eurozone confidence, and a Riksbank rate decision, all landing alongside a blockbuster earnings slate.
Macro & Data
In the US, initial jobless claims will be the key real-time read on labour market momentum, while factory orders, wholesale sales, and the November trade balance help shape Q4 growth tracking.
Europe sees a confidence check via Eurozone January economic sentiment and December M3, with Italy’s industrial sales and wages adding colour on domestic demand.
Japan’s consumer confidence offers a read on household sentiment, while Canada’s trade data and Sweden’s Q4 GDP indicator round out the global picture.
Central Banks
Riksbank decision is the headline risk in Europe, with markets watching tone and guidance as closely as the rate call itself.
ECB’s Cipollone speaking may add nuance on the policy outlook, especially around financial conditions and transmission.
Earnings
A mega-cap and cyclicals-heavy lineup: Apple will dominate sentiment, while Visa and Mastercard give a pulse on global spending.
Semis are in focus with Samsung Electronics, SK hynix, KLA, and Keyence.
Industrials and defensives feature strongly (Caterpillar, Honeywell, ABB, Lockheed Martin, Parker-Hannifin), alongside healthcare (Roche, Thermo Fisher, Stryker, Sanofi).
Financials include Blackstone, ING, Lloyds, with consumer/media names like Comcast and Altria also reporting.
Rates & Supply
US 7-year Treasury auction will test demand amid ongoing volatility in the belly of the curve.
Bottom line: Expect earnings-driven equity moves, with rates and FX sensitive to US jobs data and the Riksbank. Volatility could pick up into the US close as Apple reports.
This communication is for informational purposes only and should not be viewed as any form of recommendation as to a particular course of action or as investment advice. It is not intended as an offer or solicitation for the purchase or sale of any financial instrument or as an official confirmation of any transaction. Opinions, estimates and assumptions expressed herein are made as of the date of this communication and are subject to change without notice. This communication has been prepared based upon information, including market prices, data and other information, believed to be reliable; however, Trade Nation does not warrant its completeness or accuracy. All market prices and market data contained in or attached to this communication are indicative and subject to change without notice.

BA – Daily Technical AnalysisBoeing is testing a major long-term descending trendline, acting as a strong supply zone.
Price is reacting right at this resistance, making this a critical decision area.
Technical Structure
• Overall structure: Wide range with descending ceiling
• Price at dynamic resistance
• Moving average is flattening → momentum slowing
• Initial rejection visible
Key Levels
• Major Resistance:
242 – 246
• Breakout Targets:
260 → 280
• Near Support:
228 – 230
• Key Support:
215
• Lower Support:
200
Bullish Scenario (Breakout)
If:
• Daily close above 246
• Successful retest of the trendline
➡️ Confirms a long-term breakout.
Upside Targets:
260 → 280 → 300
Bearish Scenario (Rejection)
If:
• Price fails to hold above resistance
• Loses the moving average
➡️ A corrective move is likely.
Downside Targets:
230 → 215 → 200
Final Takeaway
BA is at a make-or-break level.
This is either the start of a multi-month breakout,
or another rejection into range.

SELLER INTO MARKET FOR WHILEI can See sellers interest
After the interest rate decision, the seller is inclined to allow additional time so as to reassess the pricing structure, with the intention of lowering the price marginally and introducing further improvements.
Please note that this is not financial advice

CHZ/USDT at a Critical Zone — Breakout or Another Rejection?CHZ/USDT on the Weekly (1W) timeframe remains in a long-term downtrend since its 2021 peak. Price is currently testing the upper boundary of a descending channel, an area that historically acts as a key decision zone—either leading to a strong rejection or a valid breakout. While short-term momentum shows signs of recovery, sellers still control the broader market structure.
---
Pattern & Technical Structure
Descending Channel (Bearish Continuation Pattern)
Price has been moving consistently within a downward-sloping channel defined by:
Upper resistance (red trendline) → dynamic resistance
Lower support (yellow trendline) → major dynamic support
As long as price remains inside the channel, the primary trend stays bearish
Current price action at the upper channel makes this a high-risk, high-impact decision area
---
Key Levels
Major Resistance:
0.07500 → minor resistance / initial reaction zone
0.14000 – 0.16600 → mid-term supply zone
0.27500 → major resistance & trend reversal confirmation
Major Support:
0.05400 → short-term support
0.03500 → important weekly support
0.01000 → extreme demand zone / lower channel boundary
---
Bullish Scenario
Price breaks above and closes weekly above the descending channel
Breakout supported by increasing volume
Upside targets:
0.07500
0.14000 – 0.16600
0.27500 as the main target
A valid breakout could mark the end of the bearish structure and the start of a medium-term trend reversal
Bullish Confirmation:
Weekly close above the red resistance trendline
Successful retest of the upper channel as support
---
Bearish Scenario
Price fails to break the upper channel and forms a clear rejection (long wicks or bearish weekly candle)
Selling pressure resumes
Downside targets:
0.03500
0.01000 (lower channel)
As long as price stays inside the channel, upside moves are considered relief rallies
Bearish Confirmation:
Strong rejection at dynamic resistance
Breakdown below the 0.05400 support level
---
Conclusion
CHZ/USDT is trading at a critical long-term decision zone on the Weekly timeframe.
This area will likely determine whether price:
Breaks out → Trend reversal
Gets rejected → Continuation of the downtrend
Traders are advised to wait for weekly confirmation, as this zone is highly prone to fake breakouts.
#CHZ #CHZUSDT #Altcoin #CryptoAnalysis #TechnicalAnalysis #WeeklyChart #DescendingChannel #TrendReversal #CryptoTrading

#6,000.80 benchmark ahead / excellent ProfitsAs discussed throughout my yesterday's session commentary: 'My position: I have been waiting for Gold to invalidate #5,200.80 benchmark all session long as I was well aware if Gold establishes #5,200.80 benchmark as an Support, Medium-term stays Bullish and new #6,000.80 psychological benchmark Target can be pursued with my set of key re-Buy orders (both Short and Medium-term). As soon as #5,200.80 is tested first time, I spotted that Gold delivered firm Support zone within #5,178.80 - #5,184.80 last night, I Bought Gold there aggressively with set of Buying orders waiting for final #5,200.80 break-out which was delivered on Asian session market opening where I closed my set of Buying orders on #5,223.80 and closed all of my orders. Needless to mention besides all Fundamentally (critically) Bullish / Gold-friendly pointers, most important one is DX taking strong hits with every Hourly candle which is adding enormous Buying pressure on Gold. I will continue Buying Gold from my key entry points maintaining my next Medium-term Target seen Trading at #6,000.80 benchmark.'
I have engaged new set of Buying orders on #5,272.80 as Gold established QM Support there and as I spotted that Gold always delivers distinguished Support level (in form of Buying accumulation) and only then deliver major move to the upside. I have closed my orders on #5,352.80 benchmark with excellent Profit. As Gold extended the rise, I have waiting (now already traditional) market closing which in most cases opens with a Gap and engage two time #100 lot's Buying orders on #5,416.80 / and as Gold opened with a Gap, I closed my both orders on #5,452.80 extension with spectacular Profit.
My position: Once more Gold is being utilized as a safe-haven as crypto market and DX in particular are suffering significant losses. However as before, I am making use of the DX as my key indicators to suggest the underlying trend for Gold, which remains critically Bullish, as the DX made a solid Technical Low's throughout yesterday's session and dipped strongly, assisted also by fluid Fundamentals which are not DX-friendly. As I determined the trend, every dip on Gold for me is distinguished re-Buy opportunity and I will stick to this strategy for full Profit maximization. My ideas are posted a bit late from usual time I post however I am Trading into late night almost every evening. I will continue Buying Gold from my key entry points and just finished #5,506.80 - #5,524.80 few moments ago. #6,000.80 mark represents my next Medium-term Target and keep #5,432.80, #5,452.80, #5,462.80 as key re-Buy points.

PYTHUSDT Forming Falling WedgePYTHUSDT is forming a clear falling wedge pattern, a classic bullish reversal signal that often indicates an upcoming breakout. The price has been consolidating within a narrowing range, suggesting that selling pressure is weakening while buyers are beginning to regain control. With consistent volume confirming accumulation at lower levels, the setup hints at a potential bullish breakout soon. The projected move could lead to an impressive gain of around 90% to 100% once the price breaks above the wedge resistance.
This falling wedge pattern is typically seen at the end of downtrends or corrective phases, and it represents a potential shift in market sentiment from bearish to bullish. Traders closely watching PYTHUSDT are noting the strengthening momentum as it nears a breakout zone. The good trading volume adds confidence to this pattern, showing that market participants are positioning early in anticipation of a reversal.
Investors’ growing interest in PYTHUSDT reflects rising confidence in the project’s long-term fundamentals and current technical strength. If the breakout confirms with sustained volume, this could mark the start of a fresh bullish leg. Traders might find this a valuable setup for medium-term gains, especially as the wedge pattern completes and buying momentum accelerates.
✅ Show your support by hitting the like button and
✅ Leaving a comment below! (What is your opinion about this Coin?)
Your feedback and engagement keep me inspired to share more insightful market analysis with you!
