Ether to sellLong term sell of the cryptocurrencies, from bits to bits. This downleg to possibly continue to support near 1000. Light short position at 2010, could spike to 2200 in short term.
Chart Patterns

GBPUSD – 2H chart...GBPUSD – 2H chart 👇
Structure shows:
Descending trendline recently broken
Strong support zone around 1.3630–1.3640
Price bouncing from support
Next clear resistance above
🎯 Upside Targets (if support holds)
Target 1: 1.3735 – 1.3750
(previous horizontal resistance)
Target 2: 1.3820 – 1.3840
(major resistance zone marked on my chart)
🔑 Invalidation
If price closes back below 1.3600, upside structure weakens and could retest lower levels.
Right now bias = bullish while above support.

Oil at a Crossroads as US–Iran Talks LoomOil at a Crossroads as US–Iran Talks Loom
Oil has not been moving for days. The current geopolitical tension is creating an even more confusing path for one of the most traded commodities.
The problem this time is Iran.
The White House confirmed that the US and Iran will meet for talks in Oman on Friday (February 6, 2026) over Tehran’s nuclear program, but a disagreement over the agenda suggests that progress will be difficult to achieve amid the threat of a regional war in the Middle East.
Technical Analysis:
From a technical perspective, oil is moving inside a contracting triangle pattern, showing hesitation in direction. In my opinion, it will only move after the news above. It's news-related
If the US and Iran fail to reach a deal, oil could move above the triangle, opening the door for further gains as shown in the chart
If the US reaches a deal with Iran, oil could break the triangle and start the downward movement, as shown in the chart.
You may find more details in the chart.
Thank you and good luck! 🍀
❤️ If this analysis helps your trading day, please support it with a like or comment ❤️

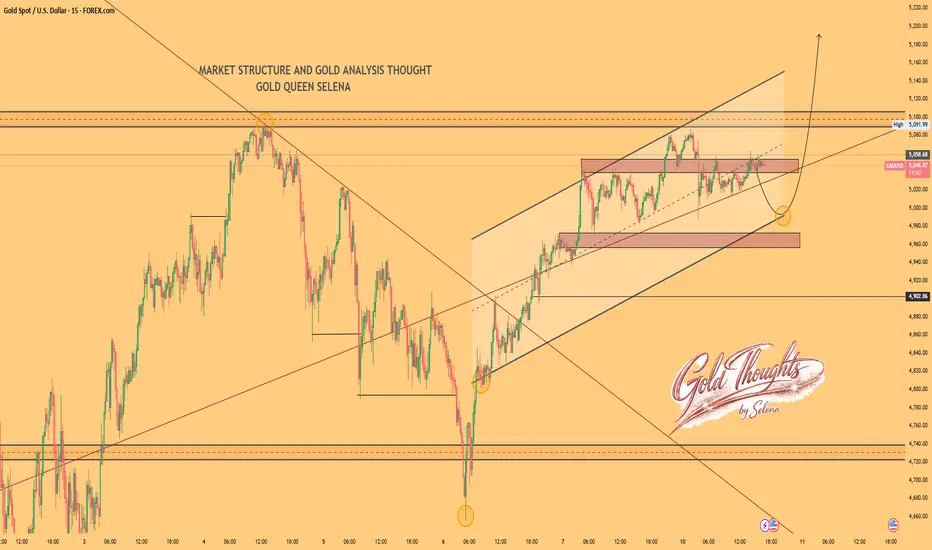
Selena | XAUUSD · 15M – Ascending Channel | Compression FOREXCOM:XAUUSD PEPPERSTONE:XAUUSD
After a strong bullish reversal from the sell-side liquidity sweep near the lower demand, XAUUSD transitioned into a controlled bullish channel. The market is now consolidating below resistance, which typically precedes either a continuation breakout or a corrective pullback toward demand before the next leg.
Key Scenarios
✅ Bullish Case 🚀 →
• Acceptance above 5,100 resistance
• 🎯 Target 1: 5,150
• 🎯 Target 2: 5,200
❌ Bearish Case 📉 →
• Rejection from resistance + channel breakdown
• 🎯 Downside Target 1: 4,980
• 🎯 Downside Target 2: 4,950
• 🎯 Downside Target 3: 4,900
Current Levels to Watch
Resistance 🔴: 5,090 – 5,120
Support 🟢: 5,000 → 4,950
⚠️ Disclaimer: This analysis is for educational purposes only. It is not financial advice.
ETH: Bearish Continuation Toward $1,660?ETH: Bearish Continuation Toward $1,660?
ETH has broken down from a bearish pattern after failing to sustain momentum near the upper trendline resistance around the $2,120–$2,150 region.
The structure shows a clear loss of higher-low support, signaling potential bearish continuation.
Price is now trading below the lower boundary of the channel, turning former support into resistance.
If sellers maintain control, we can expect a move toward the marked demand zones below.
Key downside targets:
$1,873
$1,771
$1,661
You may find more details in the chart.
Thank you and good luck! 🍀
❤️ If this analysis helps your trading day, please support it with a like or comment ❤️

XAUUSD Outlook: From Liquidity Grab to Bullish Breakout SetupGold (XAUUSD) is currently transitioning from a corrective bearish phase into a potential bullish continuation, as highlighted by recent market structure developments and liquidity behavior.
🔍 Market Structure Overview
After printing a Higher High (HH) near the 5,600 zone, price experienced a sharp selloff that resulted in a Change of Character (CHoCH), confirming a temporary bearish shift. This move led to a strong displacement lower, ultimately forming a Lower Low (LL) around the 4,400–4,500 demand region.
However, this sell-side liquidity grab was quickly absorbed, signaling institutional demand at discounted prices.
📈 Bullish Recovery & Internal Structure
From the demand zone, Gold established a Higher Low (HL) and began forming internal Higher Highs and Higher Lows, suggesting buyers are regaining control. The recent consolidation above the 5,000 psychological level further strengthens the bullish case.
Price is currently holding above a key equilibrium zone, indicating acceptance and accumulation rather than distribution.
🧠 Key Levels to Watch
Support: 4,950 – 5,000 (pullback & reaction zone)
Demand Zone: 4,600 – 4,800 (bullish invalidation below)
Resistance / Supply: 5,400 – 5,550 (previous premium & sell-side imbalance)
🚀 Bullish Scenario
If price delivers a controlled pullback into the 5,000 region and holds above structure support, a continuation move toward 5,200+ and eventually 5,400–5,500 becomes highly probable. This aligns with the projected path marked on the chart.
⚠️ Invalidation
A decisive breakdown below the current HL would weaken the bullish bias and open the door for deeper retracements toward the demand zone.
📌 Conclusion
Gold is no longer in free fall. The combination of liquidity sweep, higher low formation, and consolidation above equilibrium suggests smart money accumulation. As long as structure holds, bullish continuation remains the favored scenario.

CADJPY - Range High Pressure!CADJPY is currently hovering right at the upper bound of its range, a level that has repeatedly acted as a ceiling for price.
Each time price reached this area in the past, upside momentum faded and sellers stepped in.
As long as this resistance zone holds, the focus stays on short setups, looking for a rotation back toward the middle or lower end of the range.
For the bears to fully take over, we need confirmation.
That confirmation comes with a break below the last low marked in red. A clean break there would signal that sellers are gaining control and that downside continuation becomes more likely.
Will this range reject price once again… or is a breakout brewing? 👀
⚠️ Disclaimer: This is not financial advice. Always do your own research and manage risk properly.
📚 Stick to your trading plan regarding entries, risk, and management.
Good luck! 🍀
All Strategies Are Good; If Managed Properly!
~Richard Nasr

EURJPY (2H CHART PATTERN)...EURJPY (2H CHART PATTERN).
As long as price stays below 183.70–184.00, bears are in control.
🎯 Target 1: 181.80
🎯 Target 2: 181.00
🎯 Extended Target: 180.20
❌ Stop loss above 183.60
🔺 If ME are looking for BUY (support bounce trade)
Only valid if we get strong bullish confirmation candle on 2H.
🎯 Target 1: 183.70
🎯 Target 2: 185.00
🎯 Target 3: 186.00 (major resistance)
📌 Key Level to Watch:
Break below 181.80 → strong continuation down.
Strong rejection from current zone → possible retracement to 183.50–185.00.
Right now structure is bearish, so safer setup is sell on pullback unless clear reversal forms.

BTCUSD – 2H timeframe...BTCUSD – 2H timeframe.
🔍 Structure
Clear downtrend (descending trendline respected)
Price trading below Ichimoku cloud
Currently moving toward major demand zone 63,500 – 62,000
Equal lows liquidity sitting below 64K
📉 Bearish Scenario (More probable short term)
If price breaks 64,000 cleanly:
🎯 Sell Targets:
TP1: 63,500
TP2: 62,000 (strong demand zone)
Extended: 60,000 psychological level
❌ Invalidation: 2H close above 69,500
📈 Bullish Reversal Scenario
If price taps 62K–63K and shows strong rejection:
🎯 Buy Targets:
TP1: 70,000
TP2: 72,000 (my marked supply zone)
Extended: 78,000 – 80,000 major resistance
📌 My View
Short term → downside liquidity sweep toward 62K looks likely
After that → possible bounce to 70K+

GOLD, Break out of range before NFP? Gold has been consolidating since the weekend as major catalysts were postponed last Friday. With NFP rescheduled for tomorrow and no concrete outcome from the US–Iran talks, price remains trapped in a tight structure between 5000–5050 — false breaks on both sides but no real expansion.
depending on the data that we see it could be crucial for Golds next movement. Bias remains bullish on the intraday as long as 5000 holds strong.
📍 Key Levels to Watch
🟢 Support Zones:
. 4990 – immediate demand
. 4964 – structure support
. 4813 – final bullish line → loss of this flips market bearish
🔴 Resistance Zones:
. 5050 – intraday barrier
. 5089 – supply cluster
. 5116 breakout - opens path to 5300 FVG with potential run toward ATH > 5600

Hellena | EUR/USD (4H): LONG to 1.19523 (Nearest target).Colleagues, following on from the previous forecast, I believe it is necessary to come up with a new idea that does not contradict the old plan.
The price shows a resumption of the upward movement, and I think that now we need to highlight two main levels:
1) 1.17663 - if the price updates this level, it means that the structure is changing and the waves need to be redrawn.
2) 1.19074 - breaking through this level and above will mark the continuation of the upward movement. This means that the structure is not broken and wave “4” has formed lower than I originally thought, but within acceptable limits. In this case, I expect the nearest target of 1.19523 to be reached - the area of volume accumulation.
Manage your capital correctly and competently! Only enter trades based on reliable patterns!

GBPUSD – Bullish Reversal From Descending ChannelGBPUSD – Bullish Reversal From Descending Channel
GBPUSD has been trading inside a well-defined descending channel, respecting both upper and lower trendline boundaries.
Price recently reacted strongly from the channel support, signaling a potential bullish reversal.
The current structure suggests buyers are stepping in, with momentum favoring a push toward key supply zones.
A confirmed break and hold above the channel resistance could open the door for continuation toward the first target at 1.3750, followed by the higher resistance zone around 1.3830.
You may find more details in the chart.
Thank you and good luck! 🍀
❤️ If this analysis helps your trading day, please support it with a like or comment ❤️

USDJPY TodayHello Team! 👋
We are analyzing the OANDA:USDJPY daily chart as it navigates a highly volatile structure following a rejection from its recent peaks. The pair is showing signs of a potential trend reversal or a deep correction after failing to sustain momentum above the Previous local Top near 158.91.
Technical Landscape
The breakdown suggests that the previous bullish structure is under significant pressure. We are seeing a shift in liquidity as the pair moves away from the 158.00 level, heading toward a massive High Volume Zone identified by the Volume Profile (VRVP) around the 147.00 - 148.00 region.
Did you know that the Japanese Yen is often called a "safe-haven" currency? Interestingly, today's sharp move coincides with a broader market shift where the Yen has gained nearly 1% against the dollar in a single session. In the world of Forex, the USD/JPY pair is affectionately nicknamed "The Gopher" and remains the second most traded pair globally, often reacting violently to interest rate differentials between the Fed and the Bank of Japan.
Scenario 1
As long as the price stays below the 158.00 breakdown level the bearish momentum is likely to accelerate. In this case we expect a continuation of the sell-off toward the High Volume Zone near 147.50. This area represents a major demand zone where institutional buyers might look to re-enter the market or cover short positions.
Scenario 2
As long as the bulls can reclaim the 158.91 Previous local Top on a daily close the bearish thesis is invalidated. This seems unlikely in the short term right now.
👇 WANT MORE?
🚀 Hit the rocket, read my profile and follow so we can find each other again.

BITCOIN Could that be the shortest Bear Cycle ever???Bitcoin (BTCUSD) reached (almost) its 1W MA200 (orange trend-line) last week fastest than any other Bear Cycle before. At the same time, its 1W LMACD hit the same symmetrical level (blue) it did every time BTC completed the 1st Stage of the Cycle. Especially in the case of the (previous) 2022 Bear Cycle, it was around the same time the price came close to the 1W MA200 as well.
As this chart shows, the 4-year Cycle bottom occurs around when the 1W LMACD makes a Bullish Cross after its hits -0.21. We are still far from that. But what past Bear Cycles show is that when the 1W LMACD has hit the current level, Bitcoin takes at best the same amount of time to bottom as it did from the start of the Bear Cycle to the moment the LMACD hit the current level (blue Support). That was particularly the case during the previous (2022) Bear Cycle (was 27 weeks from High to LMACD contact, and another 27 weeks until the Cycle bottomed). The two Bear Cycles before it, bottomed in less time.
As a result, given that last week completed 17 weeks from the Cycle Top up until the LMACD contact, the Cycle could bottom in the next 17 weeks (based on that model). This suggests the first week of June 2026, while the 4-year Cycle suggests mid-September. So what do you think is more likely to happen? Could that be BTC's shortest Bear Cycle ever?
Feel free to let us know in the comments section below!
---
** Please LIKE 👍, FOLLOW ✅, SHARE 🙌 and COMMENT ✍ if you enjoy this idea! Also share your ideas and charts in the comments section below! This is best way to keep it relevant, support us, keep the content here free and allow the idea to reach as many people as possible. **
---
💸💸💸💸💸💸
👇 👇 👇 👇 👇 👇

DeGRAM | GBPUSD will break the resistance area📊 Technical Analysis
● Price exited the descending channel and formed a strong V-shaped reversal from the 1.350 support, confirming bearish exhaustion and a shift in structure.
● Higher lows are developing along a rising trendline, with price approaching the resistance area near 1.373–1.378; a breakout opens the path toward 1.384 and higher.
💡 Fundamental Analysis
● The pound is supported by resilient UK data and easing recession concerns, improving sterling sentiment.
● Softer US macro signals and fading USD momentum reinforce upside potential in GBP/USD.
✨ Summary
Channel breakout confirmed, trend reversal in play. Key resistance at 1.378–1.384; bullish bias holds above 1.365 support.
-------------------
Share your opinion in the comments and support the idea with a like. Thanks for your support!

EUR/CHF: Confirmed BoS Signals at Historic Low📉EURCHF updated the all time low, violating a major
horizontal demand cluster on an intraday chart and closing below that.
The broken structure turns into resistance now.
Bears will keep pushing the market lower.
Next support - 0.9110

RIVER/USDT Analysis. Potential Long Setup
After a prolonged decline, buying activity is beginning to dominate again. A strong volume support level has formed in the $17.5–$16.5 zone.
If price retests this area and buyer reaction appears, a long position can be considered with a target at the technical level of $24.8.
This publication is not financial advice.

USDJPY 30Min Engaged ( Bearish & Bullish Entry Detected )⚡Base : Hanzo Trading Alpha Algorithm
The algorithm calculates volatility displacement vs liquidity recovery, identifying where probability meets imbalance.
It trades only where precision, volume, and manipulation intersect —only logic.
✈️ Technical Reasons
/ Direction — LONG / Reversal 153.110 Area
☄️Bullish momentum confirmed through strong candle body.
☄️Structure shifted with higher-low near key demand base.
☄️Volume expanding confirms order-flow alignment upward.
☄️Buyers reclaimed imbalance with sustained clean break.
☄️Algorithm detects rising momentum under low liquidity.
✈️ Technical Reasons
/ Direction — SHORT / Reversal 156.200 Area
☄️Bearish rejection confirmed through sharp candle body.
☄️Lower-high forming beneath resistance supply region.
☄️Volume decreasing confirms exhaustion in price rally.
☄️Sellers regained imbalance with heavy top rejection.
☄️Algorithm detects fading demand and shift to control.
⚙️ Hanzo Alpha Trading Protocol
The Alpha Candle defines the day’s real control zone — the first battle of momentum.
From this origin, the Volume Window reveals where the next precision strike begins.
⚙️ Hanzo Volume Window / Map
Window tracked from 10:30 — mapping true market behavior.
POC alignment exposes institutional bias and breakout potential zones.
⚙️ Hanzo Delta Window / Pulse
Delta window monitors real buying vs. selling power behind each move.
Tracks volume aggression to expose who controls the candle — buyers or sellers.
When Delta aligns with Volume Map, momentum becomes undeniable.

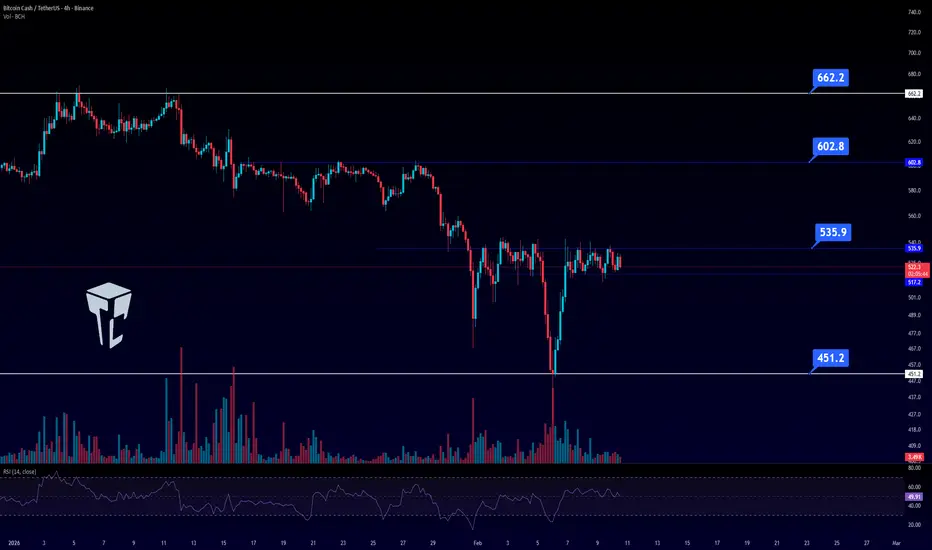
TradeCityPro | BCHUSDT Ready for the Next Move👋 Welcome to TradeCity Pro!
Let’s take a look at Bitcoin Cash (BCH). After delivering strong and attractive bullish moves in recent months, BCH has once again entered a key decision-making zone.
Market Structure (4H Timeframe)
Following a rejection from the $662 level, price entered a corrective phase, which was technically healthy and necessary from a higher-timeframe perspective. This correction pushed price down to a major weekly support at $451.
The reaction from this support was sharp and impulsive, leading to a strong upside move. Currently, BCH is consolidating within a clear range between $517 and $535, showing sideways price action.
Current Conditions & Outlook
At this stage, BCH is one of the assets that should be closely monitored. The longer price consolidates within this range while volume continues to decline, the higher the probability of a decisive breakout from this box.
Bullish Scenario (Long Setup)
The market structure suggests the formation of a V-shaped recovery pattern.
A break and sustained close above $535 would confirm the neckline breakout, activating the bullish structure and opening the door for further upside momentum.
Bearish Scenario (Short Setup)
From the downside perspective, a range breakdown could offer a clear entry opportunity.
A break below $517 may serve as an attractive trigger for a short position, signaling a bearish continuation out of the consolidation zone.
📝 Final Thoughts
Stay calm, trade wisely, and let's capture the market's best opportunities!
This analysis reflects our opinions and is not financial advice.
Share your thoughts in the comments, and don’t forget to share this analysis with your friends! ❤️
Let's play with Fibonacci Price Theory & EPP PatternsThis video is an update for the SPX500 and Bitcoin - showing you how price structure tells you everything you need to know about the markets and which direction you need to stay focused on.
For me, trading is about learning to identify where the next big move is going to be and how I can position my trades to benefit from that move. It is not about chasing 20-50 minute trends. I'm going for the bigger price swings and I want to safely deploy my capital to profit from those moves.
I teach these techniques to help traders understand PRICE is all you need to focus on. Sure, other indicators are interesting and useful to help you understand where and how price may move in the future. But I believe PRICE tells us everything we need to know.
Watch this video. Ask questions if you have any.
Learning to use PRICE as an indicator is critically important.
GET SOME!

TON/USDT | TON Holds the Line After Sharp Dump,Bulls Coming BackBy analyzing the LSE:TON chart on the weekly timeframe, we can see that after the strong bearish move toward the $1.11 level, price reacted to demand and has now recovered to the $1.34 area. This rebound shows that buyers are still present, but confirmation is still required.
The key condition for further upside is price stabilization above the $1.245 level. Only if TON manages to hold and consolidate above this zone can we expect a stronger mid-term bullish continuation. Below this level, price remains vulnerable to further volatility and consolidation.
📈 Potential Upside Targets
• Target 1: $1.55
• Target 2: $1.78
• Target 3: $2.05
As always, this chart will be updated step by step as price reacts to key levels.
Please support me with your likes and comments to motivate me to share more analysis with you and share your opinion about the possible trend of this chart with me !
Best Regards , Arman Shaban

BTC:Short-Term Bearish Confirmation After RejectionBTC:Short-Term Bearish Confirmation After Rejection
BTC fell from a strong correction zone that had been holding it strong all these days.
It looked like BTC was going to rise, but apparently the market is not too sure about this optimistic move.
Today BTC confirmed a short-term bearish setup and if this pattern continues, BTC could fall further as shown in the chart.
Main targets:
68k; 66k and 63k
Don't forget:
BlackRock Signaled More Selling as $291M in BTC, ETH Hit Coinbase Amid $2.5B Crypto Options Expiry - Coingape. This could push BTC down more.
You may find more details in the chart.
Thank you and good luck! 🍀
❤️ If this analysis helps your trading day, please support it with a like or comment ❤️

EURUSD - Consolidation ahead of NFP. Bullish trendAfter rallying and reaching a new high of 1.19266, FX:EURUSD entered a consolidation phase amid a weak dollar, which is generally a positive sign for continued growth.
Against the backdrop of a weak dollar, the euro is forming a bullish trend, the likelihood of which continuing is also high, but depends on further news. NFP is being published today.
Local resistance is appearing at 1.19266, relative to which consolidation is forming. The dollar is falling, and against this backdrop, the euro may continue to grow if it breaks the trigger at 1.19266.
Resistance levels: 1.19266, 1.1972
Support levels: 1.1895, 1.1875
Focus on the current consolidation of 1.1895 - 1.1926. Before rising, the market may test the support range, and if the bulls keep the market above the level, the price may form a rally. However, a premature close above 1.19266 will also trigger a continuation of growth to 1.1972 - 1.2025.
Best regards, R. Linda!
