ResiliencyThe price action in the S&P 500 futures markets implies resiliency as the market breaks to the downside but rallies going into the close. This structure implies a market where they are buying the break which can be a sign of confidence and the expectation of follow-through to the upside.
Chart Patterns

GOLD 1H CHART ROUTE MAP UPDATE & TRADING PLAN FOR THE WEEKHey Everyone,
Please see our 1h chart levels and targets for the coming week.
We are seeing price play between two weighted levels with a gap above at 4530 and a gap below at 4505, as support. We will need to see ema5 cross and lock on either weighted level to determine the next range.
We will see levels tested side by side until one of the weighted levels break and lock to confirm direction for the next range.
We will keep the above in mind when taking buys from dips. Our updated levels and weighted levels will allow us to track the movement down and then catch bounces up.
We will continue to buy dips using our support levels taking 20 to 40 pips. As stated before each of our level structures give 20 to 40 pip bounces, which is enough for a nice entry and exit. If you back test the levels we shared every week for the past 24 months, you can see how effectively they were used to trade with or against short/mid term swings and trends.
The swing range give bigger bounces then our weighted levels that's the difference between weighted levels and swing ranges.
BULLISH TARGET
4530
EMA5 CROSS AND LOCK ABOVE 4530 WILL OPEN THE FOLLOWING BULLISH TARGETS
4559
EMA5 CROSS AND LOCK ABOVE 4559 WILL OPEN THE FOLLOWING BULLISH TARGETS
4588
EMA5 CROSS AND LOCK ABOVE 4588 WILL OPEN THE FOLLOWING BULLISH TARGETS
4619
BEARISH TARGETS
4505
EMA5 CROSS AND LOCK BELOW 4505 WILL OPEN THE FOLLOWING BEARISH TARGET
4467
EMA5 CROSS AND LOCK BELOW 4467 WILL OPEN THE SWING RANGE
4427
4391
EMA5 CROSS AND LOCK BELOW 4391 WILL OPEN THE SECONDARY SWING RANGE
4345
4314
As always, we will keep you all updated with regular updates throughout the week and how we manage the active ideas and setups. Thank you all for your likes, comments and follows, we really appreciate it!
Mr Gold
GoldViewFX

BTCUSD Intraday Buy Setup Above 90780Market: Bitcoin / USD
Timeframe: Intraday (30M)
Current Price: 91825
Trade Bias
📈 Bullish (Buy Only) while price stays above 90780
Trade Plan
Buy Zone: Above 90780
Target 1: 93440
Target 2: 94190
Extended Target: 94930 (if bullish momentum continues)
Stop Loss: Below 89540
Technical Reasoning
Price is holding above key support at 90780
RSI is above 50, showing bullish momentum
MACD is positive and above signal line
Price is trading above 20 & 50 moving averages
Pullbacks above support favor buy continuation
Invalidation
❌ If price breaks and closes below 90780, bullish setup becomes invalid
Risk Management
Risk only 1–2% per trade
Enter after confirmation candle
No over-leveraging or emotional trading
Disclaimer
This analysis is for educational purposes only.
I am not a financial advisor.
Crypto trading involves high risk. Trade at your own responsibility.
BITSTAMP:BTCUSD BITSTAMP:BTCUSD CRYPTOCAP:BTC IG:BITCOIN $CRYPTO $INTRADAY GETTEX:BUY AAII:BULLISH

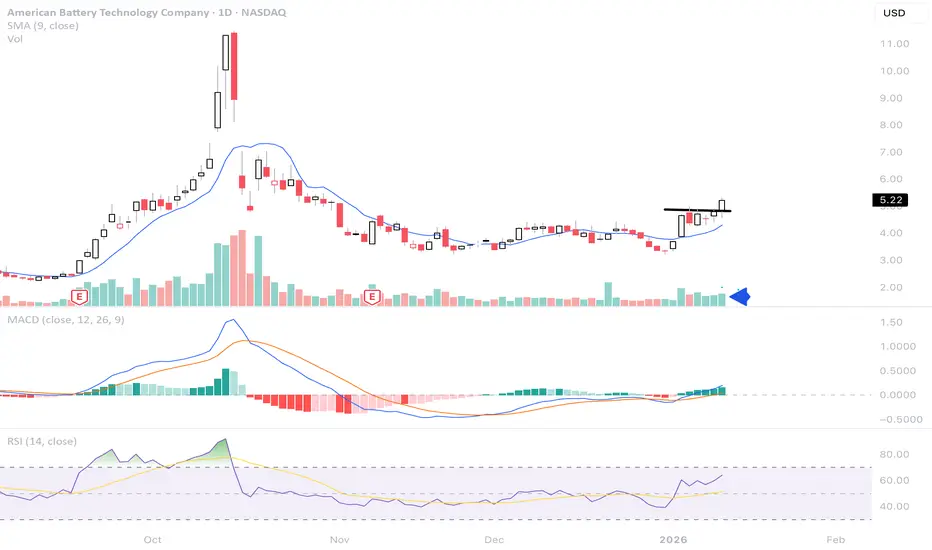
ABATspeculative play idea;
After basing for weeks, we're seeing strong volume bullish MACD crossover, and RSI bouncing off the 50s.
Ideally breaking over $5 could create the next leg higher.
🔋📈 #ABAT #Lithium
From Balance to Expansion | Reading Bullish Market PressureMarket Context (2H – EURCAD)
This chart highlights a clear transition from balance into expansion , driven by strong bullish market pressure .
Price initially developed within a horizontal channel , forming repeated same highs and same lows , reflecting equilibrium between buyers and sellers.
That balance was eventually resolved to the upside, followed by the development of an ascending channel , where price continues to form higher highs and higher lows — a typical structural outcome when buy-side pressure takes control.
Price is now reacting within the ascending structure, making this area important to observe from a pressure perspective.
This is not a prediction, but an observation of how market pressure interacts with evolving structure .
📈 Scenario 1 – Continuation Within Ascending Structure
A continuation higher from the current reaction would remain consistent with:
• Acceptance within the ascending channel
• Higher low structure holding
• Bullish pressure remaining dominant
📈 Scenario 2 – Deeper Pullback
Price may retrace further toward the lower ascending trendline before attempting continuation.
As long as this trendline holds, the broader bullish context remains intact.
⚠️ Pressure Reassessment
If price breaks and sustains below the ascending trendline and begins forming lower lows , bullish pressure becomes less evident and a potential shift toward bearish pressure would require reassessment.
🧠 Key Observation
Patterns describe structure, but market pressure explains why expansions occur after balance .
Learning to recognize these pressure shifts helps frame market behavior without relying on indicators or predictions.
(Those studying market pressure concepts will recognize this transition.)
⚠️ Educational & Analytical Use Only
This analysis is shared strictly for educational and analytical purposes.
No financial advice, trade signals, or guarantees are provided.
All decisions remain the sole responsibility of the reader and should align with their own ethical, legal, and religious principles.

Multi-Pattern Transition | Reading Selling Pressure in StructureMarket Context (30M – EURJPY)
This chart highlights a multi-pattern confluence where selling pressure dominates the broader structure .
Price initially developed within a descending channel , reflecting sustained bearish pressure.
That phase was followed by a combination of an imperfect Head & Shoulders structure and an ascending triangle , both forming within the same price region.
The subsequent breakdown to the downside and current pullback suggest that sell-side pressure remains active in this area.
This is not a prediction, but an observation of how pressure behaves when multiple structures overlap.
📉 Scenario 1 – Pullback Continuation
A continuation lower from the current pullback would remain consistent with:
• Previous descending channel context
• Failed bullish structure resolution
• Persistent selling pressure
📉 Scenario 2 – Deeper Pullback
Price may retrace higher toward the upper horizontal resistance before resuming lower.
As long as price remains below this level, the bearish pressure context remains intact.
⚠️ Pressure Reassessment
If price breaks and sustains above the upper horizontal level, bearish pressure becomes less evident and the market bias would require reassessment, with bullish pressure potentially taking precedence.
🧠 Key Observation
Patterns provide visual structure, but market pressure explains follow-through .
When several patterns fail or overlap in the same zone, pressure often becomes the more reliable context than pattern labels.
⚠️ Educational & Analytical Use Only
This analysis is shared strictly for educational and analytical purposes.
No financial advice, trade signals, or guarantees are provided.
All decisions remain the sole responsibility of the reader and should align with their own ethical, legal, and religious principles.

CIFR Given breakoutTypical swing targets after breakout :
First target: ~$20 – near recent highs
Second target: ~ –$25 – psychological + analyst midpoint
Extended target: $30+ – if momentum and market context remain strong

MLCF - Possible bounce levels identifiedScrip has all along kept on respecting EMA20 and a bounce is anticipated or can be from the EMA in question (Scenario 1).
If Scenario 1 is NOT sustained and the scrips falls further, then in that case a strong Support is marked below, which will be the second viable support zone (Scenario 2)….
Lets c how it plays.

12th Jan - Crypto Volatility - Your Weekly ICT Market AnalysisPopcorn moment, guys… Powell vs Trump is heating up! 🍿
Federal prosecutors have launched a criminal investigation into Jerome Powell over comments he made to Congress regarding the Fed’s policy roadmap, and the Justice Department has issued subpoenas, with possible indictment looming. Powell calls it politically motivated, tied to disputes over interest rate policy. Regardless, this could create massive volatility across markets, and crypto is no exception.
On the charts:
-I’m still in my BTC short from the top around 94K
-My second BTC short was stopped out at breakeven
-I’ve entered a short on ETH and will update as the position evolves
The key takeaway: my goal isn’t just to call trades, it’s to show you how to apply this logic across any chart. If a short on SOL or XRP looks better, take it!
Short-term, I’m bearish and watching the 86–84K BTC region closely.
⚠️ Disclaimer:
I am not a financial advisor. The content shared on this channel is for educational and informational purposes only and should not be considered financial advice.
Trading and investing in cryptocurrency involve high risk — you could lose some, or all, of your money. Always do your own research and make sure you understand the risks before making any financial decisions.

GBPUSD Intraday Buy Setup Above 1.3442Market: GBP / USD
Timeframe: Intraday (30M)
Current Price: 1.3469
Trade Bias
📈 Bullish (Buy Only) while price stays above 1.3442
Trade Plan
Buy Zone: Above 1.3442
Target 1: 1.3511
Target 2: 1.3528
Extended Target: 1.3545 (if bullish momentum continues)
Stop Loss: Below 1.3414
Technical Reasoning
Price is holding above key support at 1.3442
RSI is above 50, confirming bullish strength
MACD is positive, supporting upside continuation
Price is trading above moving averages
Pullbacks above support favor buy continuation
Invalidation
❌ If price breaks and closes below 1.3442, bullish setup becomes invalid
Risk Management (House Rule)
Risk only 1–2% per trade
Enter only after confirmation candle
Avoid emotional trading and over-leverage
Disclaimer
This analysis is for educational purposes only.
I am not a financial advisor.
Forex trading involves risk. Trade at your own responsibility.
FX:GBPUSD FX:GBPUSD SPREADEX:GBP AMEX:USD CRYPTOCAP:FOREX $INTRADAY GETTEX:BUY AAII:BULLISH

ICL expected to take a bounce The scrip in question retraces approximately 21%-23% and has already retraced to in the near proximity of the EMA20 and chances are that a bounce may occur from the below marked Green price zone(s) OR from / around the light blue marked dotted line in case of a deep retracement / (second scenario). lets keep fingers crossed and see how it plays

USDCAD Short Ideathis pair has formed an ascending channel on H1 timeframe
now we're waiting for a momentum candle to close below the last touch of the channel so we can enter a sell trade
Follow us for more idea or trades

MS Earnings Play: Buy the Dip Before the Gap-Up!MS Earnings Signal | 2026-01-14
Direction: BUY CALLS
Confidence: 78% (High)
Trend: Short-term bullish
Expiry: Jan 16 (2 days)
Earnings Date: Jan 15, 2026
📌 Key Levels
Strike: $177.50 Call
Entry: ~$4.90
Target 1: $7.35 (+50%)
Target 2: $9.80 (+100%)
Stop Loss: $3.43 (-30%)
Position Size: 5% of portfolio
Katy AI predicts a rise from $179.84 → $185–186 into and after earnings
Momentum is strong after a minor -1.59% dip → optimal “buy the dip”
Support around $178, resistance near $181
Positive fundamentals: 100% historical beat rate, strong capital markets performance
PCR 0.79 → institutional bias favors calls
⚠️ Risks
Medium risk due to IV Crush post-earnings
Rising VIX (15.94) → market volatility
Pre-market monitoring required for gap-up

Gold surges to a new record high!
On Wednesday (January 14th), during the Asian and European trading sessions, spot gold rebounded to around $4635, rising by approximately 1% on the day and briefly touching a historical high of $4639.49.
With softening US inflation data, market expectations for a Federal Reserve interest rate cut are rising, attracting buyers to precious metals such as gold. December US inflation data showed a slowdown in core inflation, reinforcing the market view that price pressures are gradually easing. Interest rate futures indicate that investors are divided on whether the Fed will cut interest rates twice or three times this year, but both expectations are significantly higher than the single rate cut indicated by policymakers' median forecast. The US prosecutor's initiation of a criminal investigation into Federal Reserve Chairman Powell has sparked new concerns about the Fed's independence, leading to increased safe-haven demand and supporting gold prices. At the same time, geopolitical risks remain high, and the market is closely watching the possibility of US intervention in the political turmoil in Iran after repeated warnings of potential military action.
In one hour, the US Census Bureau will release November retail sales data. Surveys by authoritative media outlets show that US retail sales are expected to rise by 0.4% month-on-month in November, compared to a flat reading in October. US retail sales data is often referred to as "the terrifying data" because it usually has a significant impact on financial markets, and is therefore likely to affect the trend of assets such as the dollar and gold. Gold has begun a new round of record-breaking gains, and market risk sentiment may drive gold prices higher. The US will release November retail sales data on Wednesday, another important data point that could affect dollar demand. At 21:30 Beijing time on Wednesday, the US November Producer Price Index (PPI) will be released, with a projected monthly increase of 0.3% and an annual increase of 2.7%. On Wednesday, US retail sales and PPI data will be the focus of market attention. These reports may provide some clues about the direction of US interest rates. Any signs of rising US inflation could boost the dollar in the short term and put pressure on the price of gold, which is denominated in dollars. Investors will focus on US retail sales and PPI data today, which are expected to trigger significant market movements. Gold is facing downward pressure in the short term, but in the long run, factors such as interest rate cuts, core inflation remaining above central bank targets, and geopolitical tensions support gold's status as a safe-haven asset. The overall outlook for 2026 is optimistic, and investors need to pay close attention to the movement of the US dollar to adjust their positions. Perhaps we are all waiting for this correction; as prices rise higher and higher, a correction seems increasingly distant. However, I still believe that prices will eventually fall. Now that the price has risen to 4639, if there is another sell-off, is it possible that the magnitude will be even greater than the previous $600 drop? This probability is quite high, but currently, there is a lack of a trigger point. Bullish factors are overwhelming, giving bears no room to breathe.
Today, the price of gold started rising from around 4590, fluctuating upwards, and after breaking through 4630, it accelerated to around 4639 before stalling and falling back. For two consecutive days, the price of gold has broken new highs compared to the previous day, but the momentum is very limited, and there was a drop of over 50 points yesterday, indicating that there is some disagreement among institutions regarding the direction at the 4640 level. From option data, we can also see that call options are gradually decreasing, and a correction may begin this week. Although the daily chart reached a new high, it still closed with a bearish candle. The overall trend is still strong, but we need to be aware of the possibility of a correction at any time during the trading day.
Currently, in terms of trading strategy, we can first short gold at the first high point of 4640. If it falls back as planned, the key level below is still around 4600, where we can consider buying for the first time. The key support level below is around 4570; if it falls below 4570, we should temporarily abandon long positions, as a sharp drop may occur. If it unexpectedly breaks through 4640, it may continue to rise to 4650-60, but the upward momentum should be limited in the short term. In summary, the short-term trading strategy for gold today is mainly to short on rallies and buy on dips as a secondary strategy. The key resistance level above is 4625-4635, and the key support level below is 4520-4500. Everyone should keep up with the pace.

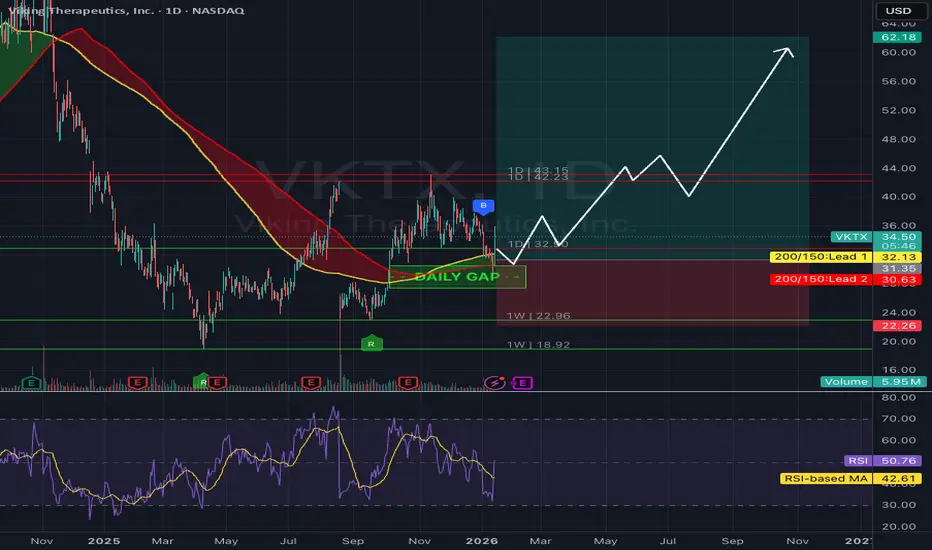
Momentum in the LabViking Therapeutics (VKTX) is currently testing the bottom of a key daily gap near the $30 level, an area that has acted as strong technical support and a potential reversal zone. A confirmed breakout above the $43 level would signal renewed bullish momentum and open the door for a move toward the $62.18 resistance, which aligns with prior highs and major supply levels.
This setup offers a great risk-to-reward ratio, with a clearly defined stop loss at $22.26, allowing downside risk to be managed while targeting substantial upside.
From a fundamental standpoint, VKTX continues to attract attention in the biotech space due to its obesity and metabolic disease pipeline, which has kept institutional interest elevated and volatility high—an ideal environment for momentum-driven moves once key levels break.
final pullbackas we try to fill the weekly fair value gap he dail had to pullback from the last weekly swing high liquidity sweep.. heading to 160.7 psted before these path tool was completed here on minds: www.tradingview.com

TSM Earnings Trade Information — Pre-Earnings BreakoutTSM Earnings Signal | 2026-01-14
Direction: BUY CALLS | Confidence: 78%
Entry Plan: Pre Earnings Close | Expiry 2026-01-16
Direction: BUY CALLS
Confidence: 78% (High)
Trend: Neutral → short-term bullish
Expiry: Jan 16 (2 days)
Earnings Date: Jan 15, 2026
📌 Key Levels
Strike: $327.50 Call
Entry: ~$6.55
Target 1: $13.10 (100% gain)
Target 2: $19.65 (200% gain)
Stop Loss: $3.93 (40% loss)
Position Size: 3% of portfolio
Katy AI predicts a rise to $330+ into earnings
Strong trending regime (96% strength)
Bullish MACD and multi-timeframe confirmations
PCR 2.09 → indicates hedges, not speculative shorts
Positive news: Nvidia pivot, potential trade pact
⚠️ Risks
High IV (75.4%) → IV crush can hurt calls post-earnings
Stock highly correlated with market/tech moves
Limit orders recommended to avoid slippage

ZEN Main Trend (anonymous) 01/15/2025Logarithm. Time frame: 1 week. A very long horizontal channel with a large increment, with the price being pulled toward its resistance. A conditional fractal on a smaller scale is observed, with a previous local pump and a false exit from the channel range. The overall trend reversal and transition to phase 3 of the trend pump bowl occurs only after a breakout and consolidation above the descending line of the main trend (indicated by the thick red line).
Research online to find out what, how, who the investors are, and at what price this "investing" is. When trading, manage your risks, as the channel is very long and there are many passengers. Medium-term interest rates and logic are shown.
Locally now Time frame: 1 day.

Long ETHUSD I currently hold a long position in ETH (Ethereum), having established my entries at price points of 3130.00 and 3180.00. My strategy involves maintaining this position without a predetermined take profit target, allowing for potential upside gains. However, I am closely monitoring the market for signs of resistance, particularly as the price approaches the 3500 level, which I anticipate could present a significant barrier to further upward movement. Therefore, while I am optimistic about the potential for continued appreciation in the value of ETH, I am also prepared to adjust my strategy if strong resistance emerges around the 3500 mark.

The Monthly Money MachinePDI is a long-term income compounder, and any buy in the $16 range is attractive for investors focused on consistent cash flow. This is not a short-term trade for me—it’s a buy-and-hold income machine designed to work for you month after month.
What makes PDI powerful is the monthly dividend. By reinvesting those dividends and continuing to add shares over time, you unlock the real advantage here: compounding. Every dividend buys more shares, which then generate even more income, creating a snowball effect that accelerates over the long run.
PDI fits perfectly in a retirement or income-focused portfolio, where the goal is steady cash flow and long-term wealth building rather than short-term price swings. This is a position I’m comfortable holding for years and adding to consistently.

EURUSD Long ideaThe daily seems to be over extended on the down side and activated all the break out sellers after taking out the previous daily low. 4HR gave us a nice divergence and the 1HR broke structure to the up side currently returning to the origin or demand zone for a long entry. This is not trading advice.

Short EUR/USD on risk-off sentiment. Stop-loss above the 50-SMA Consider a short position in EUR/USD amid prevailing risk-off sentiment. To mitigate potential losses, implement a stop-loss order positioned above the 50-period Simple Moving Average. This strategy aims to capitalize on downward price movements in the EUR/USD currency pair, driven by a risk-averse market environment, while employing a stop-loss to protect against unexpected upward price spikes beyond the 50-SMA.

ORDI Update – Key level reactionORDI has pushed back into a key resistance zone after a prolonged range.
Price briefly broke above resistance but failed to hold, showing signs of a possible deviation rather than a clean breakout.
This level is now critical:
Hold above resistance → acceptance and continuation higher
Failure to hold → rejection back into the range, potentially towards support
This area will decide whether this move has real strength or was simply a liquidity sweep.
Will the breakout hold and continue, or will resistance step in again?
MrC
