The chart is a 1-hour Gold Spot (XAU/USD) price chartThe chart is a 1-hour Gold Spot (XAU/USD) price chart
1. Price Action: The chart displays a bullish trend with green and black candlesticks indicating price movements. The recent price is $4,509.73, down slightly by 0.04%.
2. Trend Lines: Two blue parallel lines form an ascending channel, suggesting an uptrend. The price is moving within this channel.
3. Target Point: A horizontal black line marks the target price at approximately 4,549.52, indicating an expected bullish move toward this level.
4. Sell Side Liquidity Zone: A red shaded area between ~4,433.02 and ~4,457.27 represents a liquidity zone where sell orders are likely concentrated. The price has broken above this zone, signaling potential further upside.
5. Green Rectangle: Highlights the projected bullish move from the liquidity zone to the target point, with an expected range of 4,457.00 to 4,549.52.
Interpretation
- The analysis suggests a buy setup, expecting the price to rise from the liquidity zone toward the target after breaking the channel.
- The sell-side liquidity zone acted as a support before the breakout.
- Traders may watch for consolidation above the zone or a pullback to the channel for entry.
Chart Patterns

IREN: breakout + continuation or a range-trap rejection Market Structure
The run into the 60–70 area reads like distribution / buying climax behavior (public chase, then failure). The selloff that followed looks like markdown, ending with a base-building process around the low-40s.
Current price action is back at the “creek” (range highs) -> this is where real supply shows itself. Bullish outcome: breakout above the creek = SOS, followed by a controlled retest (LPS) that holds. Bearish Wyckoff: push above the creek that fails fast = Upthrust (UT/UTAD-type) failure, often leading to a sharp reaction.
Candlestick Read
Recent candles are tight-bodied / spinning-top style as price leans on resistance -> indecision at a ceiling (buyers pushing, sellers absorbing).
What matters next is the confirmation candle:
Bullish confirmation: wide-range green close through resistance (engulfing / strong close, minimal upper wick).
Bearish confirmation: shooting star / bearish engulfing at the breakout level (wicky failure) = breakout buyers getting sold into.
Box (the tradable frame)
Box Top (Trigger): ~49
Box Bottom (Support): ~40–41 (with a working shelf in the 42–45 zone)
Price is riding the upper rail. That’s where breakouts are born — or where traps happen.
Fibonacci Map
Retracements (supports):
23.6%: 46.64
38.2%: 45.18
50%: 44.00
61.8%: 42.82
78.6%: 41.14
Extensions (targets on breakout):
127.2%: 51.72
161.8%: 55.18
200%: 59.00
Tactical Game Plan
Plan A — Breakout (Bullish)
Trigger: Daily close > 49 with volume expansion (ideally 1.5–2.0x recent average).
Best entry: breakout close or first retest that holds 49 (Wyckoff LPS).
Targets: 51.7 -> 55.2 -> 59, then the big 60–70 supply zone overhead.
Risk line: failure back below 46.6 (23.6%) starts to degrade the breakout.
Plan B — Rejection / Range Trap (Bearish short-term)
Signal: rejection at ~49 with a shooting star / bearish engulfing, especially on heavy volume.
Magnet zones: 45.2 -> 44.0 -> 42.8 -> 41.1.
Invalidation: acceptance back above 49–50 (not just a wick—a close and hold).
What “Smart Money” Looks Like Here
Bullish: pullbacks are shallow and volume dries up (absorption), then price pushes through 49 with conviction.
Bearish: breakout attempts show big wicks + heavy volume (selling into strength), followed by a slip back into the box.
Bottom line: This is a high-quality pivot. Above 49 = trend continuation setup. Failure at 49 = range-trap risk back toward mid/lower box support.
Not financial advice

XMR PERPETUAL TRADE SELL SETUP Short from $582XMR PERPETUAL TRADE
SELL SETUP
Short from $582
Currently $582
Targeting $567 or Down
(Trading plan IF XMR
go up to $602 will add more shorts)
Follow the notes for updates
In the event of an early exit,
this analysis will be updated.
Its not a Financial advice

CADJPY My Opinion! SELL!
My dear friends,
CADJPY looks like it will make a good move, and here are the details:
The market is trading on 113.72 pivot level.
Bias - Bearish
Technical Indicators: Supper Trend generates a clear short signal while Pivot Point HL is currently determining the overall Bearish trend of the market.
Goal - 113.39
About Used Indicators:
Pivot points are a great way to identify areas of support and resistance, but they work best when combined with other kinds of technical analysis
Disclosure: I am part of Trade Nation's Influencer program and receive a monthly fee for using their TradingView charts in my analysis.
———————————
WISH YOU ALL LUCK


XAUUSD Delivered Excellent Results but 4900 is on Mark !!XAUUSD Delivered Excellent Results but 4900 is on Mark !!
XAUUSD Delivered Excellent results as we mentioned in our previous commantary our target will be 4590 which xauusd delivered early beyond our expectations.
XAUUSD | 4H Structure Update
Gold has printed another BOSat 4550 on the 4H timeframe, shifting the structure to the upside.As I'm expecting Price-action has to retest the structural level and prevoius BOS 4550-4540 zone,which sits in the optimal buying area.
Secondly If H4 closed below then further retracement willbe at 4490.
This zone also aligns with previous supply turned demand,adding confluence for a potential reaction.
If buyers hold this 4550 area,upside Targets remain:
-4600 (current ATH)
-A possible test of the upper trendline,located near 4645

Trade idea on xauusd My chart tells you the story and my mind map on xausd for the New York session
I see price dropping to around 4562-4550 for a retest before continuing to the upside but in the case 4600 fails, a retest of it for bullish continuation to the upside.
What's your take ? Share your thoughts in the comments

Monday's Trading PlanNow let's look at today's gold trend. Gold opened flat this week and then rose, briefly reaching 4600. However, there is some resistance at this price. We need to pay attention to the resistance level at 4600. If it cannot be effectively broken through, gold will face a short-term pullback before consolidating!
XAUUSD
Support: 4570 Resistance: 4600

GLMUSDT UPDATE#GLM
UPDATE
GLM Technical Setup
Pattern: Falling Wedge Pattern
Current Price: 0.2652$
Target Price: 0.4340$
Target % Gain: 71.16%
Technical Analysis: GLM is breaking out of a falling wedge pattern on the 1D chart, signaling bullish continuation. Price has reclaimed the descending resistance trendline with improving momentum, confirming the breakout structure. The measured move from the wedge projects a upside target near the 0.43–0.44$ zone, which also aligns with previous resistance levels. Holding above the breakout area keeps the bullish setup intact.
Time Frame: 1D
Risk Management Tip: Always use proper risk management.

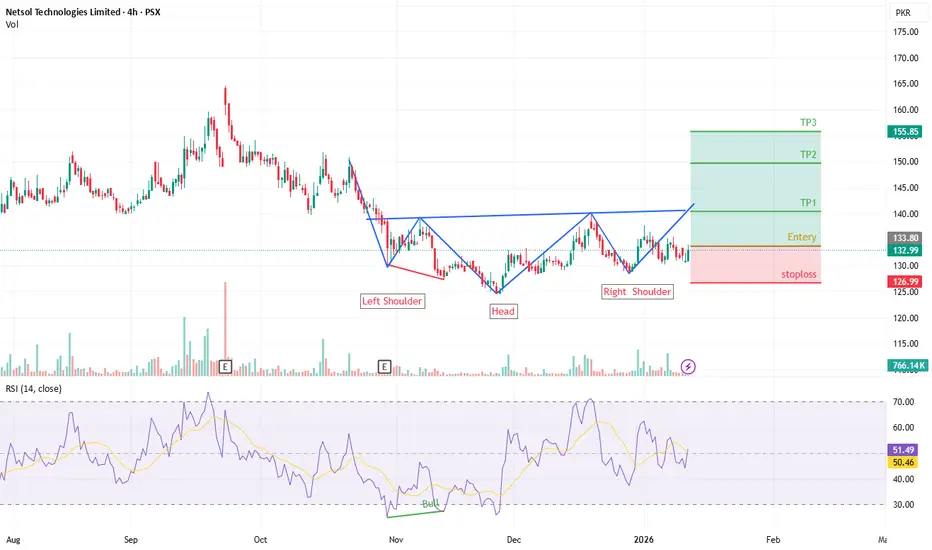
NETSOL – Inverse Head & Shoulders Breakout SetupNETSOL Technologies has formed a clear Inverse Head & Shoulders pattern on the 4H timeframe.
Price is approaching the neckline breakout zone, signaling a potential trend reversal and bullish continuation.
RSI is stabilizing above mid-levels, supporting upside momentum if the neckline is sustained.
Trade Plan:
Entry: 133
Targets:
TP1: 140.41
TP2: 149.71
TP3: 155.80
Stop Loss: Below right-shoulder support
> Favorable risk-to-reward setup
> Wait for confirmation and manage risk properly.
> Not financial advice.
Gold longsGold’s bullish case stays intact: easing-rate expectations and falling real yields, relentless central-bank accumulation, deficit-driven confidence hedging, and geopolitical tail risk. With price in breakout/ATH territory, liquidity tends to pull XAUUSD higher.

Us30 trAdeplan 1:5 RRFirst day of the week looking for double bottom and to start initiating by orders one is to 5 ^ what ratio it's going to be a burner follow for more details

EURUSD LONG TRADEDirection BUY (Long)
The "Why" The price just broke a high hilltop (Market Structure Shift), showing Team Europe is taking control.
The Entry We are waiting for the price to drop back into our Launchpad (Order Block) at roughly 1.1639.
The Safety Net If the price falls below 1.1617, our idea is wrong, and we "get out" to keep our piggy bank safe (Stop Loss).
The Goal We want to ride the move up to the next big hilltop at 1.1742 (Take Profit).

6hsCAUTION !
Very volatile stock .
Has not gone in to production yet .
( but might be soon )
That said , it is such a small miner . With imo great potential .
If you look at marketcap even the medium miners go to after production .
This includes copper probably only going up in price the next 1-2 years .
And the clearly very large accumulation zone break out now .

GBPUSD Challenges the 1.36 Resistance Ahead of US CPI, UK GDPKey Events
• While US GDP growth has reached 2-year highs at +4.3%, UK GDP growth expectations remain sluggish near 0%, supporting dollar strength over the pound.
• US CPI reports are expected to stabilize this week near 2.7%, following a mixed jobs report, supporting continued Fed rate uncertainty and DXY consolidation.
• Key technical levels remain critical to confirming longer-term trends beyond the GBPUSD consolidation that has been in place since June 2025.
From a weekly timeframe perspective, GBPUSD price action continues to respect the bounds of a consolidation connecting higher highs between July 2023 and September 2025, forming a multi-year resistance zone near 1.38.
A medium-term bullish bias remains visible:
• Weekly RSI is holding above the 50 neutral zone, leaning momentum toward a neutral-to-bullish reading.
• Price action remains supported above the 1.30 psychological level, the 9-month support, and SMA 89.
However, a clean hold above 1.36 and 1.38 is required to confirm a longer-term bullish breakout, opening the way toward 1.40 and 1.42 (2021 high), respectively.
Should price action fail to break above 1.36, short-term retracement risks increase toward 1.3280, 1.3220, and 1.30, the latter acting as a key pivot that could either support another bullish rebound or open the door to a longer-term drawdown toward 1.2940 and 1.2740.
- Razan Hilal, CMT

NZDCAD-BULLISH SETUPNZDCAD is seems to be in bullish trend as it has shown bullish point using technical and fundamental analysis.

#ALICE/USDT – Potential Trend Reversal After Long Accumulation#ALICE
The price is moving within a descending channel on the hourly timeframe. It has reached the lower boundary and is heading towards a breakout, with a retest of the upper boundary expected.
The Relative Strength Index (RSI) is showing a downward trend, approaching the lower boundary, and an upward bounce is anticipated.
There is a key support zone in green at 0.1650. The price has bounced from this level several times and is expected to bounce again.
The indicator is showing a trend towards consolidation above the 100-period moving average, which we are approaching, supporting the upward move.
Entry Price: 0.1700
First Target: 0.1750
Second Target: 0.1786
Third Target: 0.1841
Stop Loss: Below the green support zone.
Don't forget one simple thing: Money Management.
For inquiries, please leave a comment.
Thank you.

EURGBP oversold bounce back capped at 0.8708 resistance. The EURGBP pair is currently trading with a bearish bias. Recent price action shows a further pullback and the loss of support within the uptrend.
Key resistance is located at 0.87608, a prior consolidation zone. This level will be critical in determining the next directional move.
A bearish rejection from 0.8708 could confirm the resumption of the downtrend, targeting the next support levels at 0.8660, followed by 0.8644 and 0.8630 over a longer timeframe.
Conversely, a decisive breakout and daily close above 0.8708 would invalidate the current bearish setup, shifting sentiment to bullish and potentially triggering a move towards 0.8720, then 0.8736.
Conclusion:
The short-term outlook remains bearish unless the pair breaks and holds above 0.8708. Traders should watch for price action signals around this key level to confirm direction. A rejection favours fresh downside continuation, while a breakout signals a potential trend reversal or deeper correction.
This communication is for informational purposes only and should not be viewed as any form of recommendation as to a particular course of action or as investment advice. It is not intended as an offer or solicitation for the purchase or sale of any financial instrument or as an official confirmation of any transaction. Opinions, estimates and assumptions expressed herein are made as of the date of this communication and are subject to change without notice. This communication has been prepared based upon information, including market prices, data and other information, believed to be reliable; however, Trade Nation does not warrant its completeness or accuracy. All market prices and market data contained in or attached to this communication are indicative and subject to change without notice.

GBPAUD Bearish sideways consolidation capped at 2.0190The GBPAUD pair is currently trading with a bearish bias, aligned with the broader downward trend. Recent price action shows a further pullback and the loss of support within the downtrend.
Key resistance is located at 2.0190, a prior consolidation zone. This level will be critical in determining the next directional move.
A bearish rejection from 2.0190 could confirm the resumption of the downtrend, targeting the next support levels at 2.0000, followed by 1.9967 and 1.9925 over a longer timeframe.
Conversely, a decisive breakout and daily close above 2.0190 would invalidate the current bearish setup, shifting sentiment to bullish and potentially triggering a move towards 2.0240, then 2.0286.
Conclusion:
The short-term outlook remains bearish unless the pair breaks and holds above 2.0190. Traders should watch for price action signals around this key level to confirm direction. A rejection favours fresh downside continuation, while a breakout signals a potential trend reversal or deeper correction.
This communication is for informational purposes only and should not be viewed as any form of recommendation as to a particular course of action or as investment advice. It is not intended as an offer or solicitation for the purchase or sale of any financial instrument or as an official confirmation of any transaction. Opinions, estimates and assumptions expressed herein are made as of the date of this communication and are subject to change without notice. This communication has been prepared based upon information, including market prices, data and other information, believed to be reliable; however, Trade Nation does not warrant its completeness or accuracy. All market prices and market data contained in or attached to this communication are indicative and subject to change without notice.

How I’m Reading GBP/USD at This SupportGBP/USD has bounced sharply from a higher‑timeframe demand area after grinding lower for several sessions. The current reaction comes right as price taps into that deeper zone of interest, with buyers stepping in aggressively and rejecting lower prices instead of accepting a breakdown.
Technically, this push aligns with a classic rotation from discount back towards the prior supply area above, with clear space for price to travel before it meets heavier resistance. For me, that makes this region a logical place to look for continuation higher as long as the demand zone holds and intraday pullbacks keep getting bought up rather than sold into.
From a broader perspective, the pair is still sensitive to shifts in risk sentiment and Bank of England vs Fed expectations, so any new data that supports GBP or pressures the dollar only adds fuel to this bounce. Until then, my focus is simple: respect the levels, manage risk under the zone, and let price tell me if this is just a reaction or the start of a deeper recovery
How would you manage GBP/USD from here – hold for the upper supply, or scale out earlier and protect gains?

ETHUSD At a Critical Support Test — Accumulation or Breakdown?On the H1 timeframe, ETHUSD is currently trading at a key decision zone, where market structure, EMA positioning, and liquidity dynamics are all converging. From a broader perspective, the market previously completed a clear bearish cycle, with price trending below the EMA and producing lower highs and lower lows. This confirms that the dominant structure before the current phase was bearish, not impulsively bullish.
As price reached the lower area around 3,080–3,100, selling pressure began to weaken. The market transitioned into a sideways accumulation phase, marked by compressed candles and reduced downside follow-through. This zone now acts as a critical support and liquidity base, where buyers and sellers are actively battling for control.
Currently, price is trading below the EMA, which is an important technical detail. As long as ETH remains below this dynamic resistance, upside moves should be treated as corrective pullbacks, not confirmed trend reversals. The recent push up and rejection back into the support zone reinforces the idea that the EMA is still capping price.
Two primary scenarios are now in play:
In the bullish cycle continuation scenario, if price holds above the highlighted support zone and forms a higher low, this would signal successful absorption of sell-side liquidity. A reclaim and acceptance above the EMA would then shift the structure into early markup. In this case, the first upside target sits near 3,163, followed by a higher liquidity objective around 3,218, where previous supply and imbalance remain untested.
In the bearish continuation scenario, a clean break and close below the support zone would confirm that accumulation has failed. This would open the door for a renewed markdown phase, with price likely targeting the lower liquidity pool around 3,036–3,026, where unfilled demand and stops are resting.
In summary, ETHUSD is sitting at a cycle inflection point. The support zone is the line between accumulation and further distribution. Traders should remain patient and wait for confirmation — either a strong reclaim above the EMA for bullish continuation, or a decisive breakdown below support to confirm bearish expansion.

ETHUSD Completing a Cycle Reset — Is the Next Expansion Loading?On the H1 timeframe, ETHUSD appears to be progressing through a classic market cycle reset, where the market transitions from a completed markdown phase into early accumulation and potential markup preparation.
Structurally, the left side of the chart clearly shows a strong markdown phase, characterized by impulsive bearish legs and weak corrective rallies. Selling pressure dominated until price reached the lower support area around the 3,085–3,100 region. This zone acted as a cycle low, where downside momentum stalled and volatility compressed, signaling seller exhaustion.
Following this, price entered an accumulation phase, visible through sideways price action, overlapping candles, and multiple failed attempts to push lower. This behavior aligns with cycle theory, where smart money absorbs liquidity before initiating a new directional move. The recent dip back toward this support area appears corrective rather than impulsive, suggesting it may function as a final test within the accumulation range.
The projected curved path on the chart reflects a cycle-based expansion scenario. If ETH holds above the 3,085 support and forms a higher low, the market would transition into an early markup phase. In this bullish cycle scenario, the first upside objective sits near the 3,164 liquidity level, where prior supply and internal structure reside.
Acceptance above 3,164 would confirm strength and open the path toward the upper cycle target near 3,216, which aligns with previous distribution and unfilled liquidity from the prior bearish leg. This level represents a natural magnet during early markup as price seeks equilibrium at higher value.
However, from a cycle perspective, failure to hold the 3,085 support would invalidate the accumulation thesis and suggest the market is still stuck in a prolonged markdown or re-accumulation phase. In that case, price may rotate lower again before any sustainable bullish cycle can begin.
In summary, ETHUSD is currently positioned at a cycle inflection zone. The broader bearish phase appears complete, accumulation is underway, and the market is now waiting for confirmation to transition into markup. The next higher low will be the key signal that determines whether this projected expansion becomes reality or remains a delayed cycle rotation.

OMG GOLD SHORT!!! The sell of for gold is going to be insane. This is where smart money comes into play. I'm looking to hold this trade for a week or 2.
