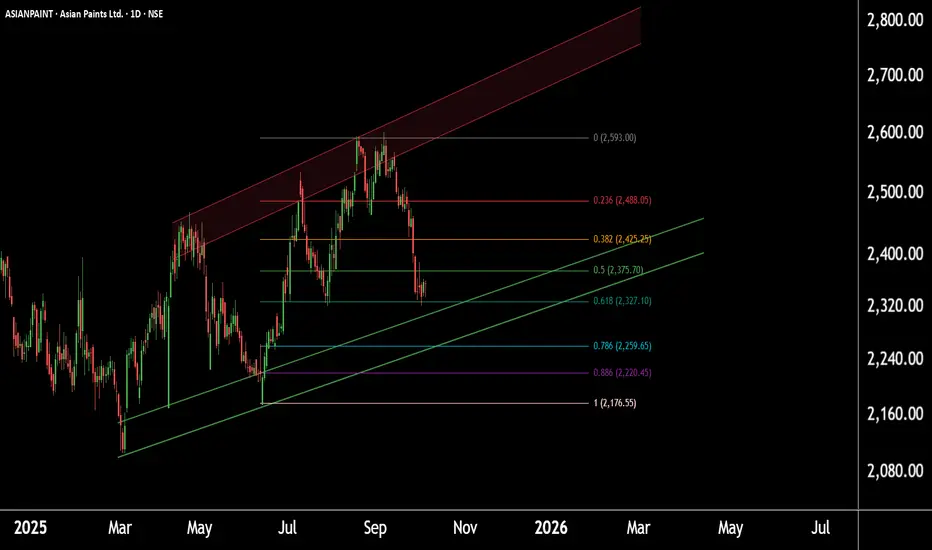
Asian Paints at Demand Zone —Eyes on a Potential Reversal Setup!Asian Paints – Daily Chart Analysis
Chart Timeframe: Daily chart observation.
Current Price Zone: Trading near the Fibonacci golden zone around 2320.
Support Zone: Strong support identified between 2240–2260, aligned with the channel base and Fibonacci retracement.
Technical Confluence: Both channel and Fibonacci levels confirm 2260 as a crucial support level.
Outlook: If these two zones hold, we may see higher prices in Asian Paints in the upcoming sessions.
Thank you.
Chartpatterntrading
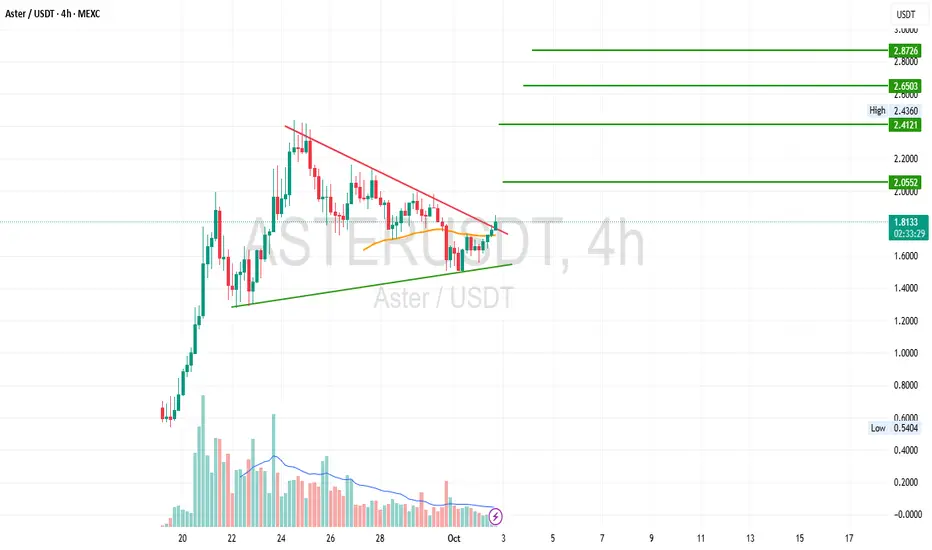
ASTER 4H Trade Idea$Aster has broke down trenline on 4H TF which quite strong indication. Expected targets are given on chart. NFA DYOR
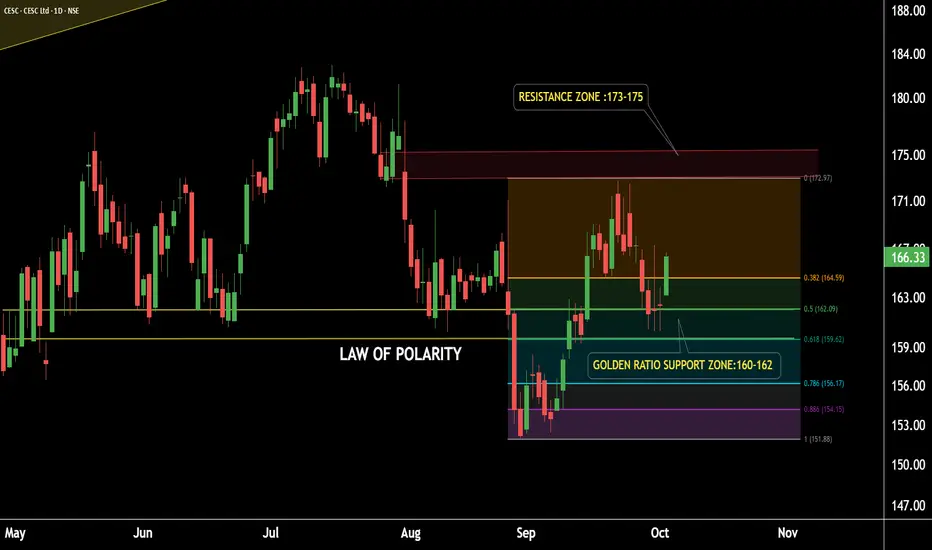
CESC on Fire - Strong Momentum Building !CESC Daily Timeframe Analysis
CESC is sustaining above its Law of Polarity (LOP) after a breakout.
The stock has successfully retested the LOP and is showing strength.
This level also aligns with the Golden Ratio Zone of Fibonacci Retracement, representing a strong support zone around 159–162.
Potential Upside Target: 172–175.
If the support zone sustains, we may see higher prices in CESC.
Thank you!
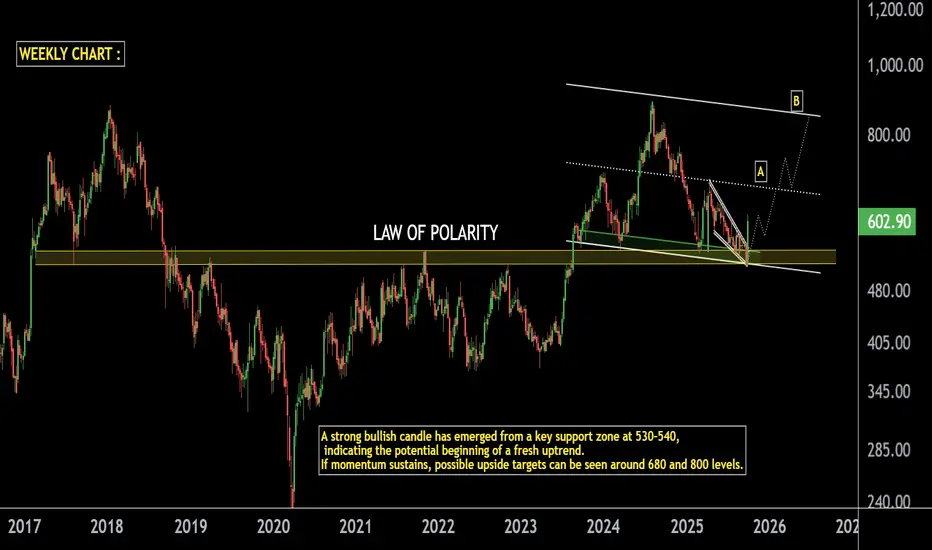
SUN TV on Fire: Explosive Move from Strong Support Zone.SUN TV Weekly Analysis
Support Zone: Stock is respecting the long-term LOP with strong support in the 520–530 range.
Bullish Candle: A powerful bullish candle has formed at this support zone, signaling strength.
Momentum Outlook: If momentum continues, a minor correction could act as a healthy pause before the next rally.
Resistance Levels:
First resistance / rally stop point near 680.
If 680 breaks, next resistance is positioned around 850.
Trend View: As long as the 520–530 support zone sustains, SUN TV may continue its rally in the coming sessions.
Thank You !!
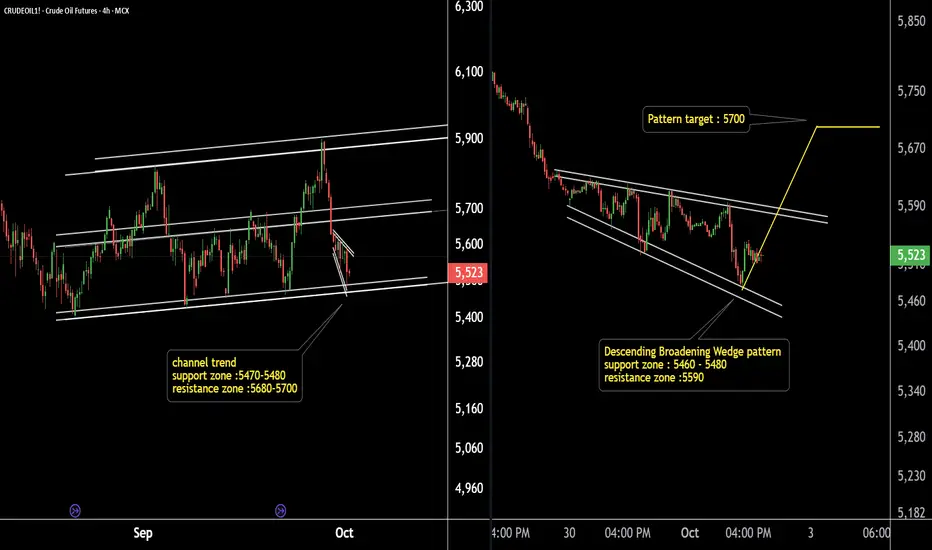
Crude Oil Ready to Explode ? Watch This Key Support Pattern!Crude Oil (4H & 15Min Chart) Analysis:
Crude Oil is moving within a well-defined parallel channel on the 4-hour timeframe, with a strong support zone at 5480–5490.
On the 15-minute chart, a descending broadening wedge is forming, with the pattern support zone also near 5480–5490 and pattern resistance around 5600.
Potential breakout target: 5700.
If the support zone holds, we may see higher prices in Crude Oil.
Summary: Key support at 5480–5490 is critical. Watch for a breakout above 5600 for a potential upside move toward 5700.
Thank you !!
BTCUSDT Cut n Reverse Area? what's next??#BTCUSDT - perfect holdings upside as we discussed in our last idear regarding Bitcoin and now market just reached at his ultimate area/region, that is around 107500-700
keep close that region because that is market full n final region for buyers.
dont hold your buying positions below that.
NOTE: we will go for cut n reverse below that that region.
good luck
trade wisely

Strong Base Formed ! Nifty Positioned for Explosive Move This is the daily timeframe chart of Nifty 50.
Nifty 50 is sustaining above the LOP support zone around 24,400–24,500. The index has formed an ascending broadening wedge pattern at this support and appears to be completing the last leg of the structure.
Support Zone: 24,500–24,550
Resistance Zone: 25,600–25,800
If the support zone holds, we may see higher prices in Nifty 50 in the coming sessions.
Thank you.

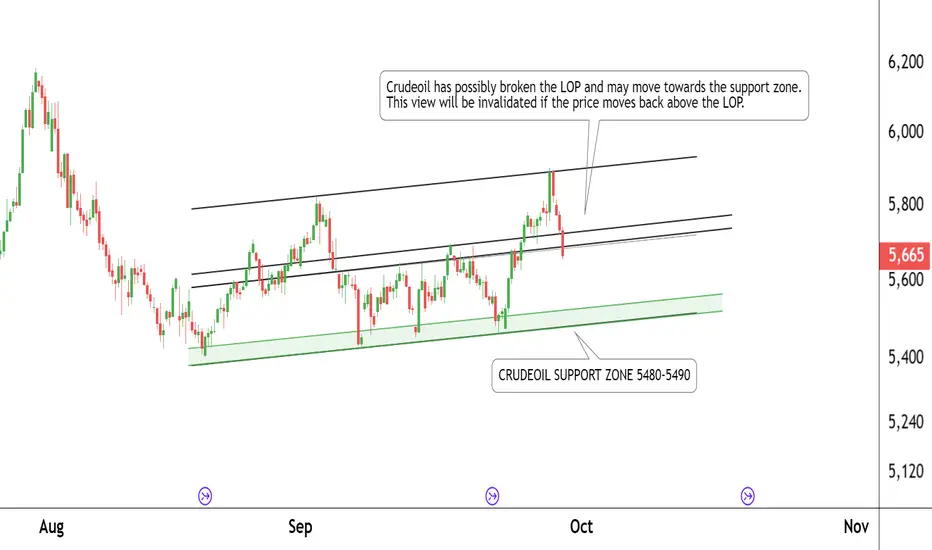
Crude Oil Breakdown – Short Trade ViewThis is the 4-hour timeframe chart of Crude Oil.
Crude Oil has broken the LOP support zone around 5700–5720.
The next key support zone is placed around 5480–5490.
The previous LOP zone may now act as a resistance.
If this resistance holds, Crude Oil prices may continue to move lower.
Thank You!!
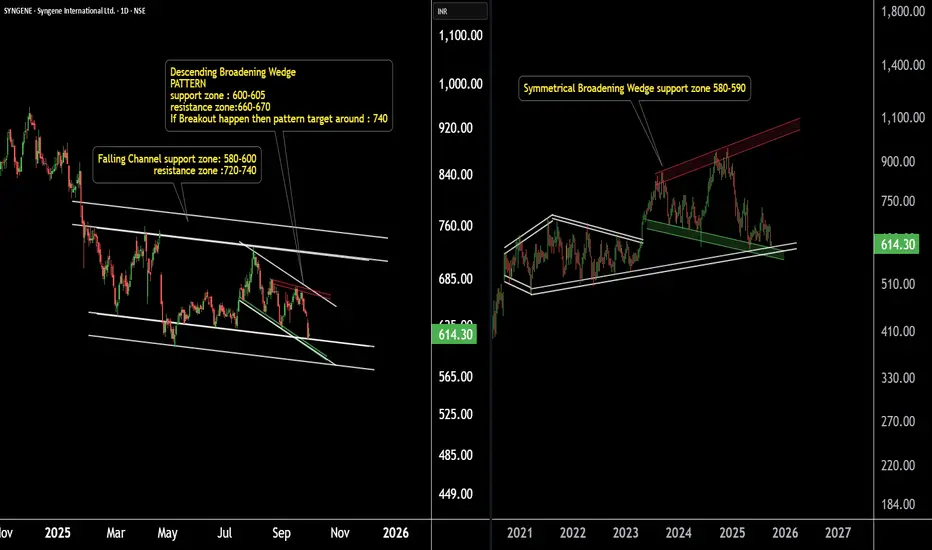
Big Move Loading in Syngene International.Pattern on Support.Syngene International – Daily & Weekly Chart Analysis
Syngene International is exhibiting a confluence of patterns across multiple timeframes, all aligning near a strong support zone.
On the weekly chart, the stock is forming a broadening wedge pattern, with a key support zone around ₹580–590.
On the daily chart, Syngene is trading within a well-defined falling channel, with support again placed near ₹580–590.
Additionally, the price structure is also shaping into a descending broadening wedge, with support around ₹590–600.
Key Insight:
The presence of multiple patterns converging near the same support zone highlights the significance of this level. Sustaining above ₹580–600 could pave the way for a strong reversal move in the coming sessions.
I'm still long biased @ $XAUUSD (but deleveraging)Technical View
A potential bullish cup & handle pattern is forming, often seen as a continuation signal.
Price has already broken out of a bearish channel, which suggests that buyers have taken control.
Triangle and wedge formations point to pressure building upward.
The broader macro channel remains intact, so the larger trend has not been broken.
Clear invalidation levels are visible near 3,730 and 3,612, which provides trade structure from a technical perspective.
Overall, the technical picture continues to lean bullish.
Macro View
US CPI remains sticky while jobless claims are softening, hinting at stagflation dynamics.
The Federal Reserve is under pressure to cut rates, with real interest rates already negative.
Historically, when real rates are negative, gold tends to outperform bonds as a store of value.
Global central banks remain net buyers of gold as they diversify away from Treasuries.
This combination is similar to the 1970s stagflation backdrop: falling rates with inflation uncertainty often encouraged capital flows into gold.
Opinion
Technicals suggest upward momentum. Macro factors also support a bullish bias. The main caveat is that positioning in gold is already heavy, which can lead to sharp short-term volatility. Directionally, however, the long bias aligns with both the charts and the macro backdrop.
Disclaimer
This post reflects only my personal market observations and opinions, shared for educational and informational purposes. It should not be considered financial advice, investment recommendation, or a call to action. Trading financial markets involves risk, and you should carefully assess your own situation and risk tolerance before making any trading decisions. Past performance or historical patterns do not guarantee future results. Always do your own research and consult a licensed financial professional if needed.

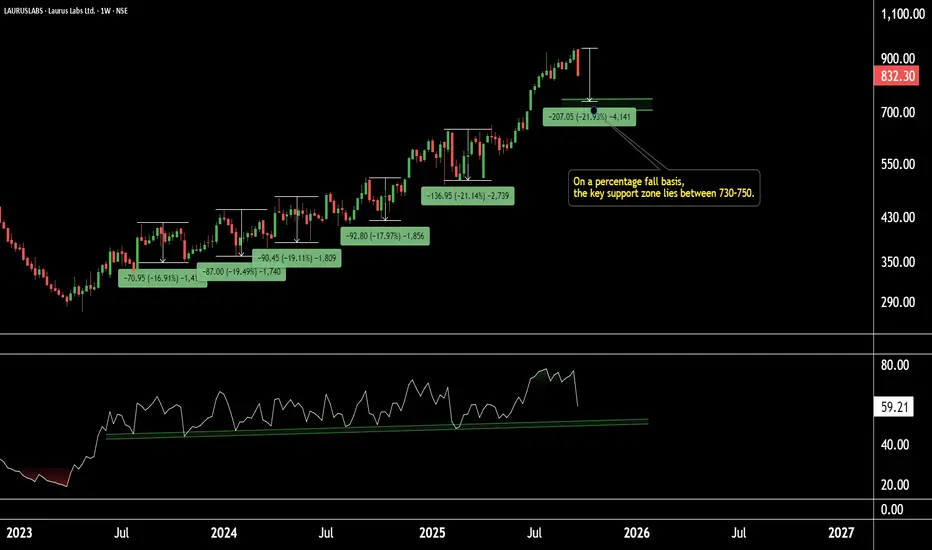
Laurus Labs | Price Action Buying Zone on RadarLaurus Labs | Weekly Technical Outlook
On the weekly timeframe, Laurus Labs has been showing consistent corrections of around 19–20% in each fall.
Currently, the stock is approaching a strong support zone near 700–730, where the weekly RSI is also holding support.
If this level sustains, Laurus Labs has the potential to see higher price levels in the coming sessions.
Thank You !!
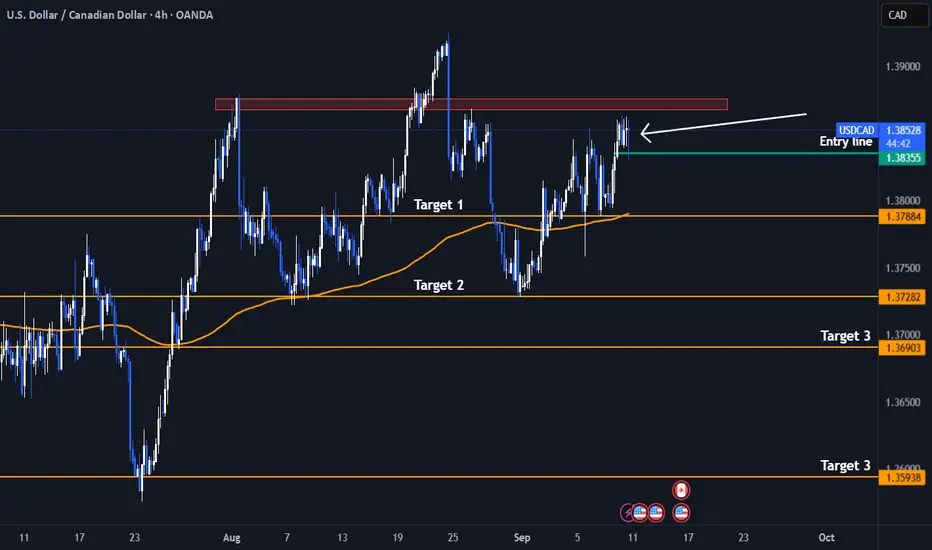
Short! Short! USDCAD - Double Head and Shoulder PatternI have identified a clear head and shoulders pattern forming within a larger head and shoulders structure on the daily timeframe for USD/CAD, indicating a potential bearish reversal.
From a fundamental perspective, several key factors are contributing to the current weakness in the Canadian dollar against the US dollar:
Canada's labor market showed significant weakness in August 2025, with a notable loss of 65.5 thousand jobs and a rise in unemployment to 7.1%, the highest in years. This has increased market expectations for monetary easing from the Bank of Canada (BoC).
Although core inflation remains above target, the weak jobs data is pushing the BoC towards potential rate cuts or a more accommodative policy stance, which weighs on the Canadian dollar.
The market is currently pricing in a very high chance (around 98%) of an additional rate cut by the BoC in September, following previous reductions to 2.75%. This dovish stance contrasts with the Federal Reserve’s more cautious or hawkish approach, creating a wider interest rate differential that supports US dollar strength.
Additionally, declining oil prices, a major export for Canada, are exerting further downward pressure on the CAD.
While recent US economic data has been mixed, the Fed is generally seen as less dovish than the BoC, sustaining demand for the USD.
Trade tensions and geopolitical risks between the US and Canada add to concerns over Canada’s growth outlook, contributing to CAD depreciation risk.
Trade Tip
A strong close below the Entry line will be a perfect entry /4hr TF
Stoploss : Above the Left Shoulder (Red Rectangle)
In summary, the combination of a weakening Canadian economy, dovish BoC bias, lower oil prices, and interest rate divergence between the US and Canada all support a bearish outlook for USD/CAD, which aligns well with the bearish head and shoulders pattern I have spotted on the chart.
Not an Investment Advise
DB Corp | Crucial Price Action Zone AheadDB Corp | Technical Outlook
On the daily timeframe, DB Corp is currently trading rangebound within a well-defined consolidation zone, with a strong support zone at 250–260.
The stock is respecting the 0.382 Fibonacci retracement level, with a critical support level placed at 254.
If this level holds, we may see a potential upside move towards 287.
However, if the support at 254 breaks, the next major support lies around 170–180.
Conclusion: Price action around the 254 level will be crucial for the next directional move.
Thank You !!

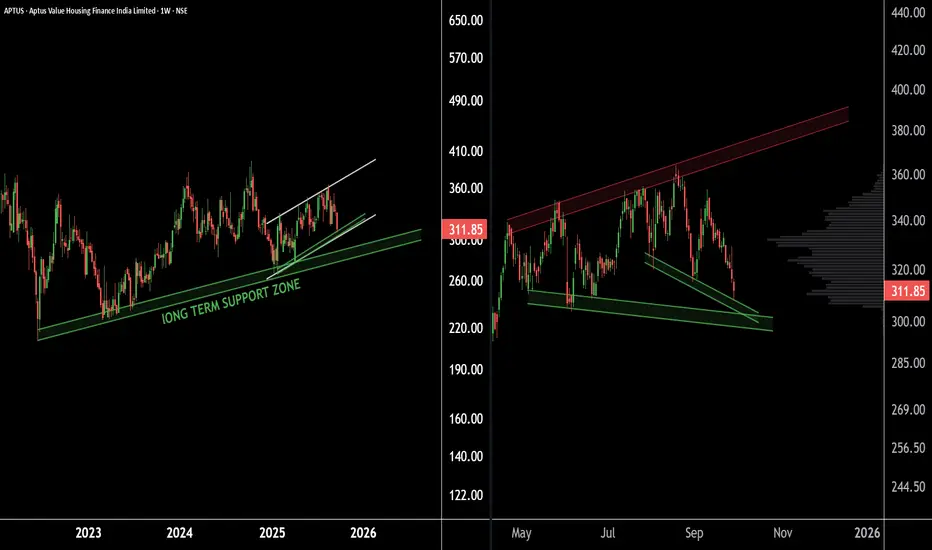
APTUS | High Probability Trading Zone IdentifiedAPTUS Technical Outlook
On weekly timeframe, APTUS is currently respecting its long-term support zone near the 270-280 range.
On the daily timeframe The stock is trading within a well-defined parallel channel, maintaining a Higher High – Higher Low (HH-HL) structure with a key support around 300 levels.
Additionally, a broadening pattern is visible, with strong support holding near 300 levels.
If this zone sustains, APTUS has the potential to move towards higher price levels in the coming sessions.
Thank You !!
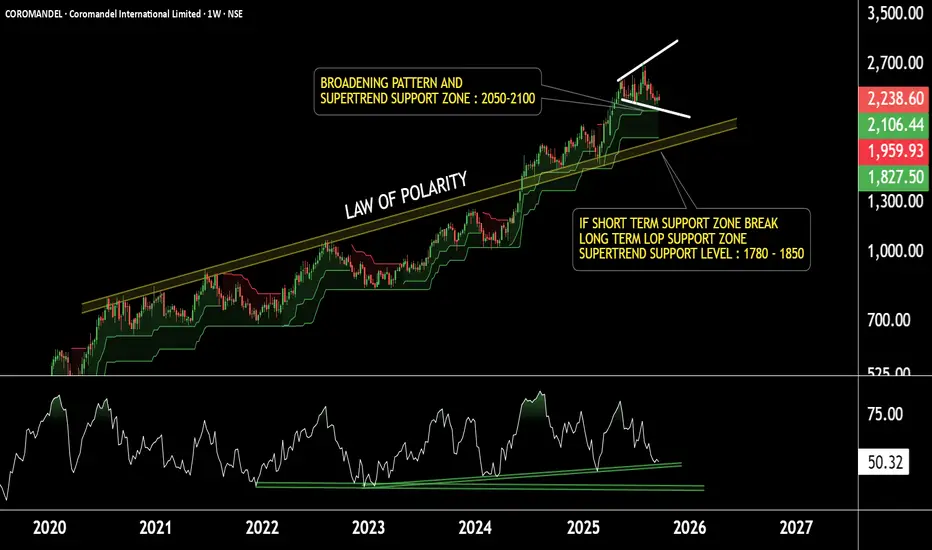
Strong Base, Strong Future – Coromandel Set to FlyWeekly Timeframe Analysis – Coromandel International
Coromandel is maintaining a Higher High – Higher Low (HH–HL) structure on the weekly timeframe and is currently taking support from the Supertrend indicator, with immediate support near ₹2100. The stock is also forming a broadening pattern with a strong support zone around ₹2050.
If the stock breaks below this zone, the next major polarity support lies near ₹1800–1850.
However, if the ₹2050–2100 support holds in the shorter timeframe, we may see upside momentum towards the upper boundary of the pattern near ₹2900.
In case the shorter-term support fails, we will wait for the long-term support before reassessing the potential targets.
Key Levels to Watch:
Support: ₹2050–2100 / ₹1800–1850
Resistance / Potential Target: ₹2900
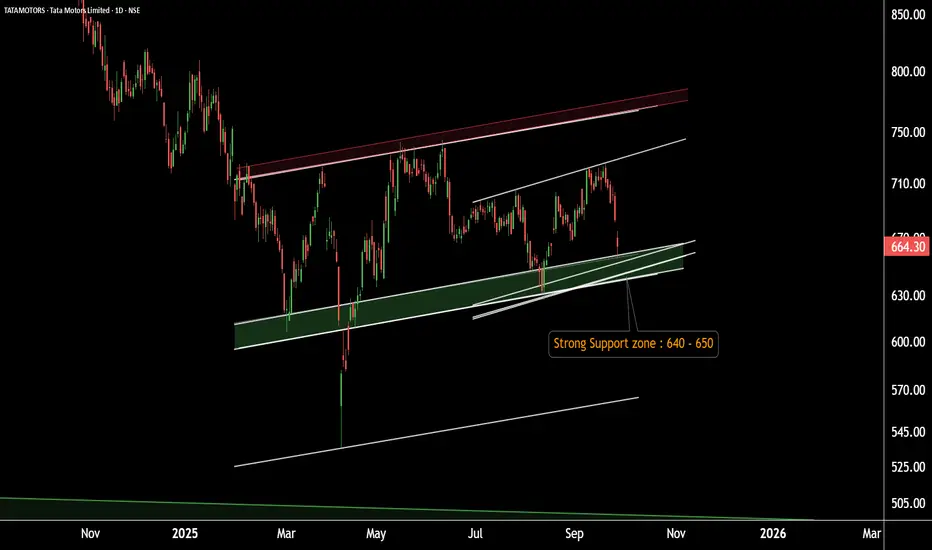
Tata Motors – Back at Key Support! Setting Up for the Next Bull.Tata Motors Daily Chart Update
Tata Motors is moving within a well-defined parallel channel, with a strong support zone around 630–650.
If this zone holds, the stock may see upward momentum.
Potential upside target: 730–740.
Thank you!
KotakBank at Critical Level – A Hidden Pattern Unfolding!KotakBank Daily Chart Update
KotakBank is forming a Broadening Pattern near the Law of Polarity support zone at 1910–1930.
Currently trading close to the pattern resistance. A breakout above this level may open the way towards the upper boundary target near 2200.
If the pattern extends further, the stock could first see a dip before beginning its final leg of the structure.
Sustaining above the 1910–1930 support zone will strengthen the bullish outlook.
Thank you!

INJ 4H INJ is at good support level and bounce on upper side very well. RR is really good on this trade. NFA DYOR

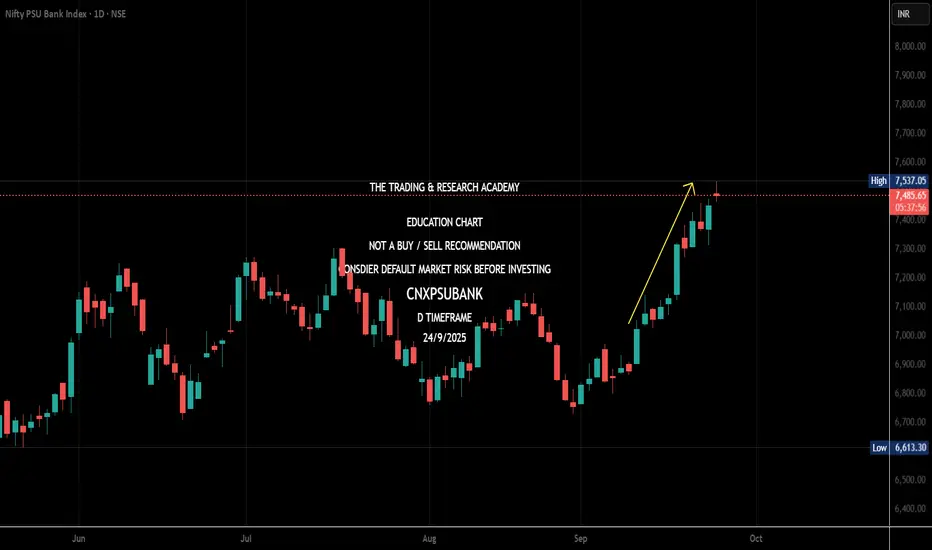
CHART SPEAKS- PSU BANKS#NiftyBank - PSU Banks have been rallying over a week. News came in Today. Was someone already aware of this?
The NEWS
UPDATE ON PSU BANKS: GOVT CONSIDERING TO RAISE FOREIGN INVESTMENT LIMITS IN PSU BANKS FROM THE CURRENT 20% -ET NOW
That's why I am Strong believer of Price Action. #Chartspeaks #chartsabkuchboltahai
SBIN Chart Breakout – Momentum AheadSBIN Double Breakout Alert
On the 4H timeframe, SBIN has given a parallel channel breakout.
Additionally, it has also confirmed a broadening pattern breakout.
Sustaining above the ₹850–₹860 level may open the path for higher prices ahead.
Thank you!

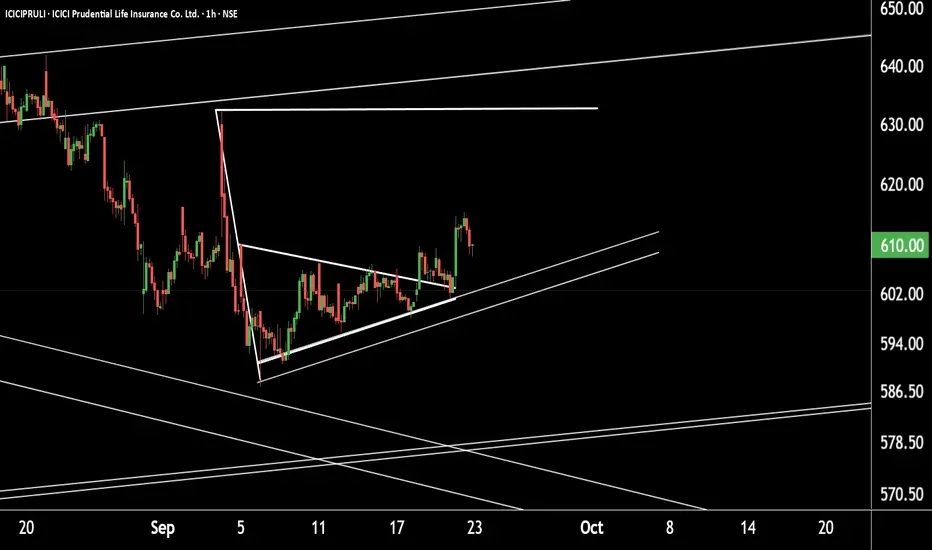
Securing growth with ICICI Prudential Life –A BUY for the futureTechnical Update: ICICI Prudential Life Insurance (1H Timeframe)
ICICIPRULI is currently moving in a Higher High – Higher Low (HH-HL) structure, indicating a strong uptrend. The stock is taking support near the ₹595–600 zone.
f this level is sustained, we may see the stock move towards its pattern target at ₹632–640.
Thank you!
TATA CHEMICALS on Full Momentum – Don’t Miss the RideTATA CHEMICALS – 4 Hour Timeframe Update
Tata Chemicals is currently forming a broadening pattern and is in the process of completing its 4th leg.
The stock is showing strong momentum, supported by the Supertrend indicator, and continues to make new highs.
Support Zone: 980 – 990
Potential Upside Target: 1050 – 1070 (valid only if the support holds)
Thank you!

HDFC Life Insurance – A Big Pattern Unfolding!This is the daily timeframe chart of HDFC Life Insurance.
The stock is currently forming a Diamond Pattern with a support zone around 760–770.
In the short term, the price action indicates a potential move toward the pattern resistance zone at 800–810.
A confirmed breakout above this level could unlock a larger upside, with a pattern target projected near 915.
Thank you
