Can One Company Break China's Rare Earth Stranglehold?Lynas Rare Earths Limited (OTCPK: LYSCF / ASX: LYC) has emerged as the Western world's strategic counterweight to Chinese dominance in rare earth minerals, positioning itself as critical infrastructure rather than merely a mining company. As the only significant producer of separated rare earths outside Chinese control, Lynas supplies materials essential for advanced defense systems, electric vehicles, and clean energy technologies. The company's transformation reflects an urgent geopolitical imperative: Western nations can no longer tolerate dependence on China, which controls nearly 90% of global rare earth refining capacity and previously held 99% of heavy rare earth processing. This monopoly has enabled Beijing to weaponize critical minerals as diplomatic leverage, prompting the U.S., Japan, and Australia to intervene with unprecedented financial backing and strategic partnerships.
The confluence of government support validates Lynas's indispensable role in allied supply chain security. The U.S. Department of Defense awarded a $120 million contract for domestic heavy rare earth separation capability in Texas, while Japan's government provided A$200 million in financing to secure priority NdPr supply through 2038. Australia committed A$1.2 billion to a Critical Minerals Reserve, and U.S. officials are exploring equity stakes in strategic projects. This state-backed capital fundamentally alters Lynas's risk profile, stabilizing revenue through defense contracts and sovereign agreements that transcend traditional commodity market volatility. The company's recent A$750 million equity placement demonstrates investor confidence that geopolitical alignment overrides cyclical price concerns.
Lynas's technical achievements cement its strategic moat. The company successfully achieved the first production of separated heavy rare earth oxides—dysprosium and terbium—outside China, eliminating the West's most critical military supply vulnerability. Its proprietary HREE separation circuit can produce up to 1,500 tonnes annually, while the high-grade Mt Weld deposit provides exceptional cost advantages. The October 2025 partnership with U.S.-based Noveon Magnetics creates a complete mine-to-magnet supply chain using verified non-Chinese materials, addressing downstream bottlenecks where China also dominates magnet manufacturing. Geographic diversification across Australia, Malaysia, and Texas provides operational redundancy, though permitting challenges at the Seadrift facility reveal the friction inherent in forcing rapid industrial development onto allied soil.
The company's strategic significance is perhaps most starkly demonstrated by its targeting in the DRAGONBRIDGE influence operation, a Chinese state-aligned disinformation campaign using thousands of fake social media accounts to spread negative narratives about Lynas facilities. The U.S. Department of Defense publicly acknowledged this threat, confirming Lynas's status as a national defense proxy. This adversarial attention, combined with robust intellectual property protections and government commitments to defend operational stability, suggests that Lynas's valuation must account for factors beyond traditional mining metrics—it represents the West's collective bet on achieving mineral independence from an increasingly assertive China.
China!

Weekly Trading Opportunities | October 21–25 • Monday: China GDP data
China’s third-quarter GDP report will be closely watched as growth is expected to slow to 4.8% year-on-year from 5.2% in Q2.
Slowing growth in China could reduce demand and prices for commodities. A surprise upside could support commodity prices.
• Tuesday: Coca-Cola and Netflix earnings.
Earnings season continues with Coca-Cola, Netflix, and others including Tesla, IBM, and Intel.
Strong results could offset soft U.S. data and help reignite the risk-on environment.
• Wednesday: U.K. inflation data and Tesla earnings
U.K. inflation is expected to edge back toward 4%. A softer reading could boost U.K. equities and pressure the pound.
• Thursday: Intel earnings
• Friday: U.S. CPI report
With the U.S. government shutdown entering its fourth week, the CPI release remains the week’s key data point. A hotter print could lift the dollar.
TRUMP TWEET: High Tariffs on china will NOT remain.I expect a deal with Xi to be announced at the APEC meeting
#ES
#STOCKS
#SPX
BTC USA-CHINA Tariff War IndecisionTwo scenarios outlined for BTC as price moves lower due to China-US tariff war. Wait for close confirmation to proceed with long scenario. Shorts have already been triggered (Invalidation is close above resistance).
GGs

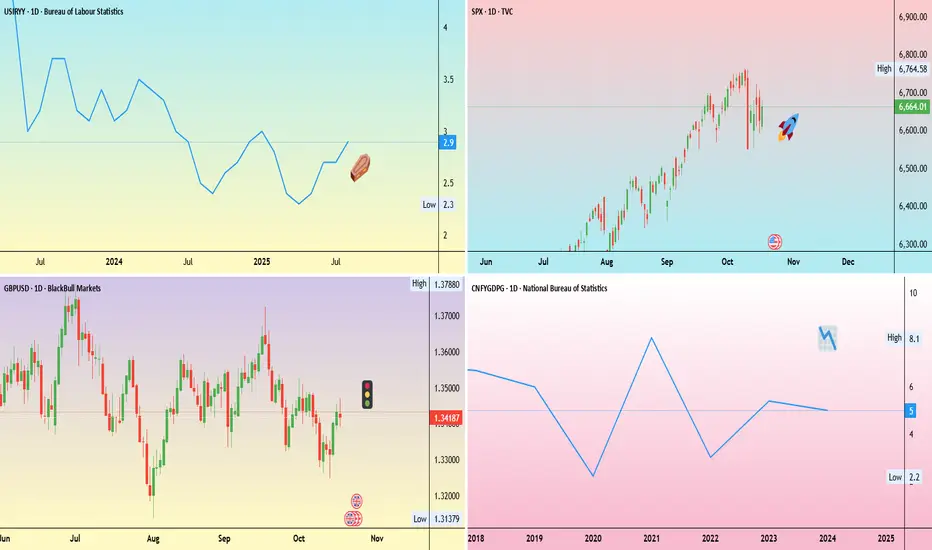
$CNIRYY -China CPI (September/2025)ECONOMICS:CNIRYY
September/2025
source: National Bureau of Statistics of China
- China’s consumer prices dropped 0.3% yoy in September 2025,
steeper than market estimates of a 0.1% decline but slightly less than
a 0.4% fall in the previous month.
Food prices declined further (-4.4% vs -4.3% in August), recording the strongest contraction since January 2024, amid broad-based falls across categories, with pork prices down further due to abundant supply ahead of the Golden Week holidays,
lower production costs, and weak demand.
In contrast, non-food inflation quickened (0.7% vs 0.5%), supported by ongoing consumer trade-in schemes to bolster consumer demand, with more increases in housing (0.1% vs 0.1%), clothing (1.7% vs 1.8%), healthcare (1.1% vs 0.9%), and education (0.8% vs 1.0%).
Meanwhile, transport costs fell at a slower pace (-2.0% vs -2.4%).
Core inflation, which excludes food and energy, rose 1.0% yoy, the highest in 19 months, after August's 0.9% gain.
On a monthly basis, the CPI inched up 0.1%, missing forecasts of 0.2% after remaining flat in August.

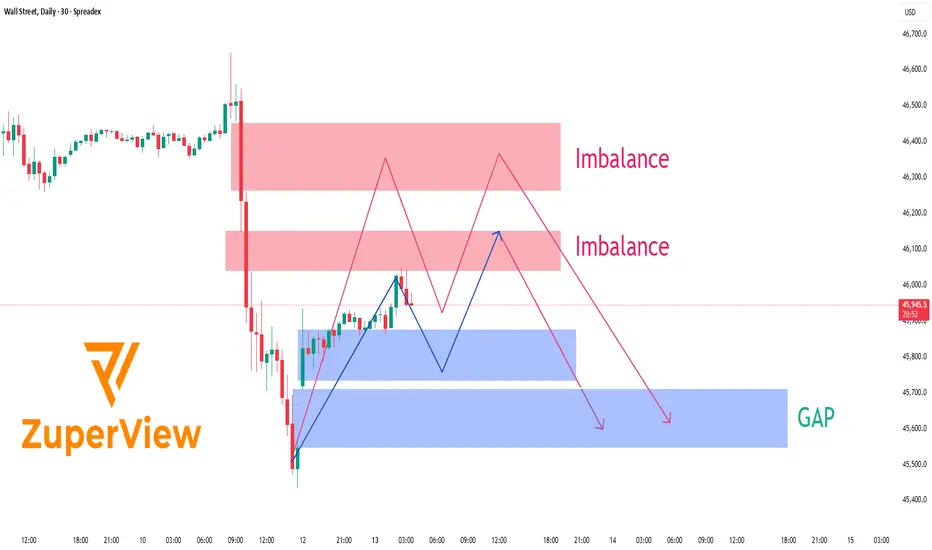
US30: Rebound before the stormTechnical Outlook – Wall Street Index (30-Minute Chart)
After the announcement that the U.S. will impose a 100 % tariff on Chinese imports, Wall Street ⚡ plunged sharply, leaving behind distinct Imbalance zones and an unfilled GAP lurking below current price levels.
At present, price is hovering around 45,950 💵, showing a modest rebound after tapping into a short-term demand zone. Above, two notable Imbalance areas stand out — around 46,000-46,150 and 46,250-46,450 - both formed as aggressive sell orders flooded the market following the latest wave of trade-war headlines 🌍.
The likely scenario 🎯:
Price could continue to retrace upward ↗️ to test one of these supply/imbalance zones before sellers re-enter the market. If selling pressure remains dominant, the index may resume its decline toward the GAP area around 45,500 - 45,650 📉, where liquidity is still unfilled and buyers may look to step back in.
Current price action indicates a corrective pullback rather than a full reversal. Trading volume is thinning 📉, candlestick patterns show signs of exhaustion 🕯️, and the upper imbalance zones remain untouched — all signaling that sellers still hold the upper hand.
________________________________________
🌍 Fundamental Context – U.S. vs. China Tensions Heating Up
On October 10, President Trump officially declared a 100 % additional tariff on Chinese goods, effective November 1, 2025 — the most aggressive move since the 2018-2019 trade war.
Beijing immediately condemned the plan, warning of “corresponding countermeasures”, including restrictions on rare-earth exports and higher port fees on U.S. vessels. While strong in tone, China has so far stopped short of announcing a direct tariff retaliation, signaling a cautious approach while keeping the door open for talks.
Washington, meanwhile, insists the measure aims to “protect American interests and reduce over-reliance on China’s supply chains,” but officials also noted that negotiations remain possible if China shows “substantive goodwill.”
Financial markets reacted swiftly 💥:
• U.S. and Asian equities dropped 2–3 % on average.
• USD strengthened, while gold and JPY rallied as safe-haven flows increased.
• Tech and industrial stocks with strong China exposure saw the largest losses.
Overall, risk sentiment remains fragile as investors brace for a prolonged phase of trade uncertainty.
________________________________________
💡 Trading Summary
Short-term structure favors a sell-the-rally approach. The market may retest upper imbalance zones before resuming its downtrend toward the 45,500 USD GAP area.
If U.S.–China tensions intensify further, downside momentum could accelerate. Conversely, any sign of renewed dialogue or tariff delay could trigger a short-term rebound — but bias remains bearish until the market reclaims 46,300 USD convincingly.
In short: patience, risk control, and reaction to headlines are key this week. ⚖️
Please like and comment below to support our traders. Your reactions motivate us to do more analysis in the future 🙏✨
Harry Andrew @ ZuperView
Australian Oilseeds Holdings Limited ($COOT) Spike 173% Today The price of Australian Oilseeds Holdings Limited (NASDAQ: NASDAQ:COOT ) Spike nearly 180% Today after Trump targets China.
The Australian giant spike amidst reacting to the rare earth trade tensions between the US and China spiking from a falling wedge pattern gaining roughly 175% today.'
However, albeit growing momentum, the asset is currently oversold sitting with an RSI of 73 trading above all moving averages respectively.
About Australian Oilseeds Holdings (NASDAQ: NASDAQ:COOT )
Australian Oilseeds Holdings Limited, through its subsidiaries, manufactures and sells chemical free, non-genetically modified organism, and sustainable edible oils and products derived from oilseeds worldwide. The company offers vegetable oils, including unrefined canola oil, premium canola oil, extra filtered canola oil, RBD canola oil, safflower oil, sunflower oil, RBD sunflower oil, soyabean oil, linseed oil, and extra virgin olive oil.

SPX500USD | Daily Analysis #3**Yesterday Review**
As observed, the index reacted to the 6682 zone, and news from China stating, "China will maintain tariffs until the end," fueled the market with sellers, pushing the price to the lower zone at 6584. In the morning of the New York session, it appeared that Trump realized the importance of offering a positive signal or message, or the index would suffer significantly. After a strong battle between buyers and sellers on the 1-hour timeframe, the price began to rise, driven by buying pressure.
During the middle of the New York session, Trump found an opportunity to provide some optimism, announcing a scheduled meeting with Chinese President Xi in South Korea on November 1st to discuss trade matters. (This could be a significant day.) This news contributed to a bounce, pushing the price back up to 6682.
**1-Hour & 4-Hour Timeframes**
On the 1-hour timeframe, two potential patterns are forming. One is a box range between 6682 and 6585, and the other is an upward trend channel. However, neither pattern is fully respected due to limited confirmation.
On the 4-hour timeframe (although I cannot share an image here), if you draw two lines—one starting from February 25, 2025, and the other from August 12, 2025—and extend them to the right, you'll notice a clear respect and relationship between these lines.
**Current Situation**
As of the time I am posting this analysis, the price is currently testing below the trendline, and we are awaiting a reaction. If the index, with or without further news, breaks the 6682 zone or the trendline strongly, we could expect the price to reach the 6672 zone. On the other hand, if the price respects the box or the upward trend channel, the index may find support and rise toward the 6604 area.

Silvers reached a fresh record high due to the short squeezeSilver prices reached an all-time high of over 53 USD/ounce, driven by a significant short squeeze in London. This rally was further fueled by safe-haven demand following the resumption of US-China trade tensions.
US President Trump expressed openness to negotiations after announcing an additional 100% tariff on Chinese goods, but China has not responded. Meanwhile, China's Sep exports surprisingly increased by 8.3% YoY, the fastest pace in six months, driven by demand from countries other than the US. Exports to the US fell 27% YoY due to tariff pressures. This indicates that the additional threat from Trump may not significantly impact China, especially given its crucial role in the AI value chain and its dominance in rare earth production. These elevated tensions could continue to drive markets toward safe-haven assets amid global instability.
On the supply side, the London Bullion Market Association, as reported by Bloomberg, confirmed that it is “aware of tightness in the silver market and is actively monitoring the situation.” Mine production has remained below demand since 2021, primarily due to electrical and electricity demand, especially from photovoltaics, where China is a dominant force. The ongoing supply shortage could continue to support silver prices.
Technically, XAGUSD is showing strong bullish momentum after breaking its previous record high, with both EMAs diverging and extending.
XAGUSD could continue to rise and test the 227.2% Fibonacci extension at 60.
Conversely, price could face take profit pressure after a long rally with the RSI indicates the overbought level (over 88). If the bullish momentum weakens, XAGUSD could test the resistance level at 47.88.
By Van Ha Trinh - Financial Market Strategist at Exness

The S&P500 paused on AI valuation concerns and trade fears
The US equity rally, driven by optimism over AI momentum, Fed rate-cut expectations, and solid consumer data, lost steam after President Trump’s combative remarks toward China. Delta Air Lines beat 3Q estimates with profit up 4.1% YoY and EPS at 1.71 USD, while Costco’s (COST) Sep sales rose 8% YoY, underscoring resilient US consumption. However, Trump’s threat of steep tariff hikes triggered the S&P; 500’s sharpest one-day drop in three months.
US500 extended its sharp decline, briefly testing the support at 6530. The index broke below the ascending channel's lower bound, suggesting a potential shift toward bearish momentum. If US500 breaks below the support at 6530 again, the index may retreat toward the next support at 6420. Conversely, if US500 breaches above EMA21 and the resistance at 6700, the index may advance toward the psychological resistance at 6800.

$SPY / $SPX Scenarios — Week of Oct 13–17, 2025🔮 AMEX:SPY / SP:SPX Scenarios — Week of Oct 13–17, 2025 🔮
🌍 Market-Moving Headlines
🚩 Inflation-heavy week: PPI, Retail Sales, and Industrial Production headline the macro slate — but several may be ⚠️subject to delay due to the shutdown.
💬 Fed circuit overload: 10+ Fed speakers including Bowman, Waller, Bostic, Barkin, and Miran — tone-watching replaces missing data.
📉 Consumer & housing pulse: Retail Sales, Homebuilder Confidence, and Housing Starts offer critical insight into demand — if they post on time.
💻 Earnings meets macro: Early Q3 results from banks + big tech guide sentiment alongside muted macro signals.
📊 Key Data & Events (ET)
📅 Mon, Oct 13 — Columbus Day 🇺🇸 (Bond Market Closed)
⏰ 12:55 PM — Anna Paulson (Philadelphia Fed) speaks
📅 Tue, Oct 14
⏰ 6:00 AM — NFIB Small Business Optimism (Sept)
⏰ 8:45 AM — Michelle Bowman (Fed Gov) speech
⏰ 3:25 PM — Christopher Waller (Fed Gov) speech
⏰ 3:30 PM — Susan Collins (Boston Fed) speech
📅 Wed, Oct 15
⏰ 🚩 8:30 AM — Empire State Manufacturing Survey (Oct)
⏰ 12:10 PM — Raphael Bostic (Atlanta Fed) speech
⏰ 12:30 PM — Stephen Miran (Fed Gov) speech
⏰ 1:00 PM — Christopher Waller (Fed Gov) speech
⏰ 🚩 2:00 PM — Fed Beige Book
📅 Thu, Oct 16
⏰ 🚩 8:30 AM — Retail Sales (Sept) — ⚠️ May be delayed due to shutdown
⏰ 🚩 8:30 AM — Producer Price Index (PPI, Sept) — ⚠️ May be delayed
⏰ 🚩 8:30 AM — Initial Jobless Claims (Oct 11) — ⚠️ At risk of delay
⏰ 9:00 AM — Waller & Miran (Fed Govs) speeches
⏰ 10:00 AM — Homebuilder Confidence (Oct)
⏰ 10:00 AM — Michelle Bowman (Fed Gov) remarks
⏰ 12:45 PM / 4:30 PM — Tom Barkin (Richmond Fed) speeches
📅 Fri, Oct 17
⏰ 🚩 8:30 AM — Housing Starts / Building Permits (Sept) — ⚠️ Possible delay
⏰ 8:30 AM — Import Price Index (Sept) — ⚠️ Possible delay
⏰ 🚩 9:15 AM — Industrial Production & Capacity Utilization (Sept) — ⚠️ Possible delay
⚠️ Shutdown Watch:
Several economic reports (Retail Sales, PPI, Jobless Claims, Housing, Industrial Production) depend on agencies like the Census Bureau, BLS, and BEA — if the shutdown persists, these will be postponed until government funding resumes.
Expect headline-driven trading, Fed-speak sensitivity, and lighter macro liquidity through the week.
⚠️ Disclaimer: Educational / informational only — not financial advice.
📌 #trading #stockmarket #SPY #SPX #Fed #Powell #Bowman #Waller #Bostic #Barkin #Miran #RetailSales #PPI #BeigeBook #inflation #bonds #shutdown #economy #housing #earnings #macro
BTC at the China's Mercy$19,000,000,000 liquidated from the crypto market last Friday Oct.10,2025 at the closing of the NYSE Session as Trump's threatens to impose new 100% Tariffs for China. This event recorded the biggest liquidation in Crypto History.
China also warns the US government of countermeasures if Trump doesn’t walk back tariff threat that will be effective Nov.1,2025.
BTC declines to $104,782 as a reaction to fear. Now the scenario is at China's Mercy if they will continue the tariff war between the US or make a truce.
Interest rates announcement gains has been wiped out by this bold declaration of added tariffs.
Upcoming rate cuts can move the BTC to $115K but another fall can happen this week if the tension grows expecting at $100k .
This is not the 1st time Trump has moved the market for Tariff war declaration for China and other countries. Tariffs has been Trump's weapon against China and his main way to raise US revenues.
The Trade war between two countries has massive economic impact on stocks, crypto and other investment vehicles as seen on the market's Fear index.
Can Trump really stand against China?

$USGRES - U.S Gold Reserves (October/2025)ECONOMICS:USGRES
October/2025
source: World Gold Council
-The U.S Treasury's Gold Reserves ECONOMICS:USGRES have surpassed 1$ Trillion Dollars in
Value for the first time in History;
more than 90 times what's stated on the Government's Balance Sheet.
United States now holds 2.4 Times more Gold than Germany,
the second largest Gold holder in the World.
Not even the 2020 Pandemic Crisis, 2008 Financial Crisis or Dot.Com Bubble saw
TVC:GOLD post a 40% Annual Gain.
As The U.S Dollar TVC:DXY continues to lose Purchasing Power,
Safe Heaven assets like TVC:GOLD , TVC:SILVER and CRYPTOCAP:BTC continue their
Uptrend Resumption .

BYD flipping resistance to supportGood trade setup, defined stop loss. what was once resistance has now become support.

China50 to form a higher low?CHN50 - 24h expiry
Daily signals are bullish.
Intraday dips continue to attract buyers and there is no clear indication that this sequence for trading is coming to an end.
Trading has been mixed and volatile.
Dip buying offers good risk/reward.
Trend line support is located at 15030.
We look to Buy at 15075 (stop at 14945)
Our profit targets will be 15465 and 15525
Resistance: 15339 / 15400 / 15500
Support: 15109 / 14948 / 14855
Risk Disclaimer
The trade ideas beyond this page are for informational purposes only and do not constitute investment advice or a solicitation to trade. This information is provided by Signal Centre, a third-party unaffiliated with OANDA, and is intended for general circulation only. OANDA does not guarantee the accuracy of this information and assumes no responsibilities for the information provided by the third party. The information does not take into account the specific investment objectives, financial situation, or particular needs of any particular person. You should take into account your specific investment objectives, financial situation, and particular needs before making a commitment to trade, including seeking, under a separate engagement, as you deem fit.
You accept that you assume all risks in independently viewing the contents and selecting a chosen strategy.
Where the research is distributed in Singapore to a person who is not an Accredited Investor, Expert Investor or an Institutional Investor, Oanda Asia Pacific Pte Ltd (“OAP“) accepts legal responsibility for the contents of the report to such persons only to the extent required by law. Singapore customers should contact OAP at 6579 8289 for matters arising from, or in connection with, the information/research distributed.

CSI 300: China’s Market Gauge & Bitcoin Sync Hint at April 2026.$CSI300 / $SHCOMP 5D (September 30, 2025)
The CSI 300 Index ➖ is a market-cap-weighted index tracking the 300 largest and most liquid A-shares on the Shanghai (SSE) and Shenzhen (SZSE) stock exchanges. It covers ~70% of mainland China’s market cap, spanning key sectors: financials (~30–35%), industrials (~20%), consumer goods (~15%), IT, healthcare, and energy. This makes it a key gauge of China’s economy, sensitive to domestic consumption, exports, and policy shifts.
• The Chinese government, at various levels, is stepping up to support the stock market. Signals suggest state funds, insurers, and pension funds are being nudged to boost investments in domestic equities.
• The CSI 300’s dividend yield (~3.5%) compared to government bond yields (~1.6%) makes stocks look attractive over “safe” instruments. Fiscal and monetary policy stimulus could further fuel growth.
Chart Insight:
Here’s an interesting observation comparing the CSI 300 and Bitcoin charts. Bitcoin’s peaks aligned with CSI 300 in late 2017–early 2018 and Q1 2021.
The next peak might hit in 180–200 days—around late March to April 2026.
There’s also a chance for a Bitcoin and altcoin rally (the altseason everyone’s waiting for) within that same timeframe.
Snapshot:
#StockMarket #China #Bitcoin

BABA: triangle with tensionOn the weekly chart, BABA has already formed a golden cross - price is above both MA50 and MA200, confirming a bullish trend shift. The stock is now approaching the upper edge of the symmetrical triangle and the key resistance at $122, which also aligns with the 0.5 Fibonacci level.
The numbers inside the triangle represent the contraction phases, not Elliott waves. This is a classical consolidation before a potential breakout. If the $122 level is broken and retested, upside targets are $128 (0.618), $137 (0.786), and eventually $148–181 (1.0–1.618 extension).
Volume is rising, MACD is flipping bullish, and RSI is climbing out of oversold territory — all signs point to growing bullish momentum.
Fundamentally, Alibaba benefits from China's economic rebound, possible regulatory relief, and ongoing share buybacks. With Chinese tech rotating back into favor, BABA could lead the rally.
So if you're still waiting for a signal - it's already here. The golden cross is done, price is flying above moving averages, and all that’s left is a clean breakout. Watch $122 — that’s the launchpad.

Hype betas crowding the market like agent Smith In the world of memecoins, during the previous cycle you had token with "baby" appended in front of a bigger token's name. Their purpose was to use token tax collected from its trading (5% mostly) and use it to buy the main memecoin. These were the origins of beta play memecoins.
In this cycle, we had beta plays that didn't benefit the main coin in any way but they were made as a coping mechanism for people who missed out on the main one. Examples include countless WIF derivatives, blonde and brunette on base, trump and melania on sol earlier this year.
Regardless, in both the cases arrival of beta plays kills the main coin and ofcourse itself too. In previous cycle one would argue it made people think "what is the inherent value of this token if not collecting taxes to buy the main one? Why then shouldn't I buy the main one. Then their minds would ponder " what is the inherent value of the main one even? Why should I buy it?" And everything would nosedive. In this cycle, their is shortage of retail liquidity so arrival of beta plays sucks out monetary liquidity and attention liquidity from the main coin and injects it into the derivative. The derivative coin pumps while the main one dies. And then people realise the derivative doesn't have as much meme power as the main one. So this dies too and people move on to the next one.
But that's about memecoins. Such kinds of things shouldn't happen to serious chains right? Well i don't know if we should consider anything serious really. Call me silly but i see parallels between hype this cycle and luna last cycle. Both attracted people who wanted decentralisation above anything else. Although in case of hype the decentralisation factory is disputed, we can keep that talk for a later date. So cults can take things to the top but can they keep it up there? Maintainance is harder than the rise. I'm not saying it will crash and burn like luna but at some point the bells will be rung, and we'll be too busy partying loudly to hear them.
Binance founder came out of prison and decided to launch his own version of hyperliquid to vamp attack hype. This shouldn't be that concerning because eth and bnb have coexisted forever... Right? Not really. Hype is not eth. If you were there to see eth go from ico to $100 you'd understand what I'm saying. But regardless, this cycle even eth is struggling and bnb is breaking ATH after ATH. I was never a fan of binance ecosystem but i recently learned the chinese crypto community lives in their own world. For them BNB is both BTC and ETH. And anything the binance people make them believe. I'm not the biggest fan of Aster but chinese community+ hyperliquid factory + the fact that most retail normal people outside Anglo countries use binance makes me think....
HYPE is short term bearish desu.

RBA's Bullock says inflation under control, Aussie steadyRBA Governor Bullock testified before a parliamentary committee on Monday. Bullock said that inflation was in a "very good position" as higher interest rates had curbed demand. Still, she warned that there inflation risks remained on "both sides".
Bullock was less positive about the geopolitical environment, warning that the significant change in the global trading system which had created massive uncertainty. The Reserve Bank was particularly concerned about the impact of US tariffs on China, Australia's largest trading partner.
Bullock warned that the financial markets had not priced in the risks of the tariffs, which could affect financial stability if the the domstic economy was significantly affected by the tariffs.
The RBA is expected to hold the cash rate at 3.6% at next week's meeting, after lowering rates by a quarter-point in August. The markets have priced in a 10% likelihood of a rate cut at the upcoming meeting, with an 86% likelihood of a cut in November.
There are no US economic releases today but investors will be keeping a close eye on Fedspeak, with five FOMC members scheduled to deliver public remarks. New Fed Governor Miran, who voted for a 50-bp cut at the September 17 meeting, is expected to give a detailed explanation of his view in today's speech.
At last week's meeting, the Fed signaled that more rate cuts were coming and the markets have priced in an October cut at 90%, according to CME's FedWatch. The Fed appears to have shifted to a more dovish stance after maintaining rates since December 2024 until lowering rates last week.
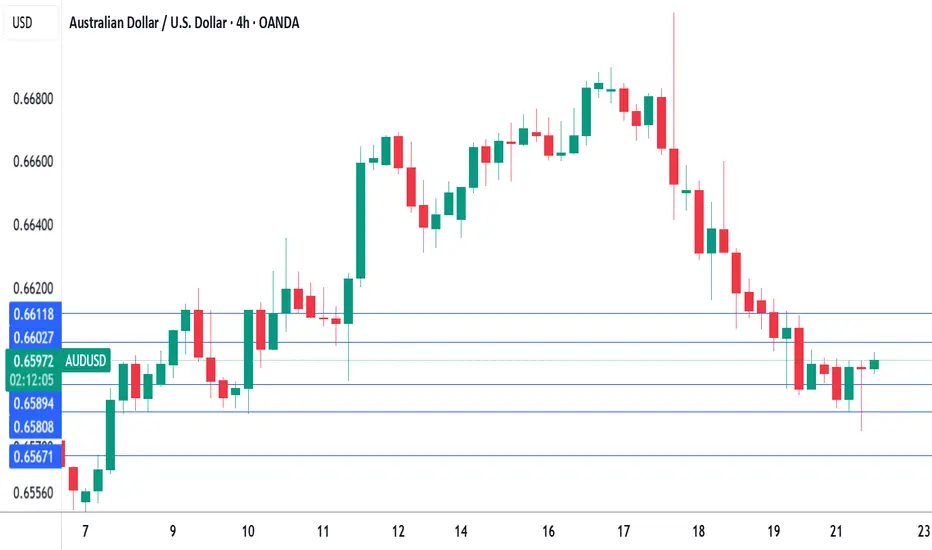
AUDUSD tested support at 0.6589 and 0.6580 earlier. Next, there is support at 0.6567
There is resistance at 0.6602 and 0.6611
GDS | Data Centers in China | LONGGDS Holdings Ltd. engages in developing and operating data centers in China. It builds, operates, and transfers data centers at other locations. Its data centers are carrier and cloud-neutral, which enable customers to connect to major telecommunications carriers, and to access a number of cloud service providers. The firm also offers colocation and managed services, which include direct private connection to major public cloud platforms. The company was founded by William Wei Huang in 2001 and is headquartered in Pudong, China.

BILI | China Tech Will Rise | LONGBilibili, Inc. is a holding company, which engages in the provision of online entertainment content. The firm enables broad video-based content consumption scenarios centered around professional user generated videos supplemented with live broadcasting, occupationally generated videos, or occupationally generated videos. The company was founded by Xu Yi in June 2009 and is headquartered Shanghai, China.

WTI falls after US slaps 50% tariff on India over Russian oilWTI oil prices have dropped from $65 to around $62.80 as markets react to new US tariffs on India, triggered by India’s ongoing oil trade with Russia. These tariffs, along with threats of even higher tariffs on China, are weighing on global demand and pushing oil prices lower. Meanwhile, Iran’s oil production has hit multi-year highs, adding more supply to the market and reinforcing the bearish trend.
Technically, oil has broken below a key Fibonacci support level, signalling a deeper pullback. If prices fall below $62, further downside toward $57 is possible. Upside moves may be short-lived unless there’s a major geopolitical shock, such as an escalation in the Russia-Ukraine conflict. For now, both the macro environment and technical signals indicate continued pressure on oil prices.
This content is not directed to residents of the EU or UK. Any opinions, news, research, analyses, prices or other information contained on this website is provided as general market commentary and does not constitute investment advice. ThinkMarkets will not accept liability for any loss or damage including, without limitation, to any loss of profit which may arise directly or indirectly from use of or reliance on such information.

CN50 price action forming a top?CHN50 - 24h expiry
Intraday rallies continue to attract sellers and there is no clear indication that this sequence for trading is coming to an end.
Price action looks to be forming a top.
Rallies should be capped by yesterday's high.
We look for a temporary move higher.
Risk/Reward would be poor to call a sell from current levels.
We look to Sell at 15235 (stop at 15369)
Our profit targets will be 14835 and 14765
Resistance: 15288 / 15400 / 15500
Support: 15063 / 15000 / 14900
Risk Disclaimer
The trade ideas beyond this page are for informational purposes only and do not constitute investment advice or a solicitation to trade. This information is provided by Signal Centre, a third-party unaffiliated with OANDA, and is intended for general circulation only. OANDA does not guarantee the accuracy of this information and assumes no responsibilities for the information provided by the third party. The information does not take into account the specific investment objectives, financial situation, or particular needs of any particular person. You should take into account your specific investment objectives, financial situation, and particular needs before making a commitment to trade, including seeking, under a separate engagement, as you deem fit.
You accept that you assume all risks in independently viewing the contents and selecting a chosen strategy.
Where the research is distributed in Singapore to a person who is not an Accredited Investor, Expert Investor or an Institutional Investor, Oanda Asia Pacific Pte Ltd (“OAP“) accepts legal responsibility for the contents of the report to such persons only to the extent required by law. Singapore customers should contact OAP at 6579 8289 for matters arising from, or in connection with, the information/research distributed.
