BTC at the China's Mercy$19,000,000,000 liquidated from the crypto market last Friday Oct.10,2025 at the closing of the NYSE Session as Trump's threatens to impose new 100% Tariffs for China. This event recorded the biggest liquidation in Crypto History.
China also warns the US government of countermeasures if Trump doesn’t walk back tariff threat that will be effective Nov.1,2025.
BTC declines to $104,782 as a reaction to fear. Now the scenario is at China's Mercy if they will continue the tariff war between the US or make a truce.
Interest rates announcement gains has been wiped out by this bold declaration of added tariffs.
Upcoming rate cuts can move the BTC to $115K but another fall can happen this week if the tension grows expecting at $100k .
This is not the 1st time Trump has moved the market for Tariff war declaration for China and other countries. Tariffs has been Trump's weapon against China and his main way to raise US revenues.
The Trade war between two countries has massive economic impact on stocks, crypto and other investment vehicles as seen on the market's Fear index.
Can Trump really stand against China?
China

$USGRES - U.S Gold Reserves (October/2025)ECONOMICS:USGRES
October/2025
source: World Gold Council
-The U.S Treasury's Gold Reserves ECONOMICS:USGRES have surpassed 1$ Trillion Dollars in
Value for the first time in History;
more than 90 times what's stated on the Government's Balance Sheet.
United States now holds 2.4 Times more Gold than Germany,
the second largest Gold holder in the World.
Not even the 2020 Pandemic Crisis, 2008 Financial Crisis or Dot.Com Bubble saw
TVC:GOLD post a 40% Annual Gain.
As The U.S Dollar TVC:DXY continues to lose Purchasing Power,
Safe Heaven assets like TVC:GOLD , TVC:SILVER and CRYPTOCAP:BTC continue their
Uptrend Resumption .

BYD flipping resistance to supportGood trade setup, defined stop loss. what was once resistance has now become support.

China50 to form a higher low?CHN50 - 24h expiry
Daily signals are bullish.
Intraday dips continue to attract buyers and there is no clear indication that this sequence for trading is coming to an end.
Trading has been mixed and volatile.
Dip buying offers good risk/reward.
Trend line support is located at 15030.
We look to Buy at 15075 (stop at 14945)
Our profit targets will be 15465 and 15525
Resistance: 15339 / 15400 / 15500
Support: 15109 / 14948 / 14855
Risk Disclaimer
The trade ideas beyond this page are for informational purposes only and do not constitute investment advice or a solicitation to trade. This information is provided by Signal Centre, a third-party unaffiliated with OANDA, and is intended for general circulation only. OANDA does not guarantee the accuracy of this information and assumes no responsibilities for the information provided by the third party. The information does not take into account the specific investment objectives, financial situation, or particular needs of any particular person. You should take into account your specific investment objectives, financial situation, and particular needs before making a commitment to trade, including seeking, under a separate engagement, as you deem fit.
You accept that you assume all risks in independently viewing the contents and selecting a chosen strategy.
Where the research is distributed in Singapore to a person who is not an Accredited Investor, Expert Investor or an Institutional Investor, Oanda Asia Pacific Pte Ltd (“OAP“) accepts legal responsibility for the contents of the report to such persons only to the extent required by law. Singapore customers should contact OAP at 6579 8289 for matters arising from, or in connection with, the information/research distributed.

CSI 300: China’s Market Gauge & Bitcoin Sync Hint at April 2026.$CSI300 / $SHCOMP 5D (September 30, 2025)
The CSI 300 Index ➖ is a market-cap-weighted index tracking the 300 largest and most liquid A-shares on the Shanghai (SSE) and Shenzhen (SZSE) stock exchanges. It covers ~70% of mainland China’s market cap, spanning key sectors: financials (~30–35%), industrials (~20%), consumer goods (~15%), IT, healthcare, and energy. This makes it a key gauge of China’s economy, sensitive to domestic consumption, exports, and policy shifts.
• The Chinese government, at various levels, is stepping up to support the stock market. Signals suggest state funds, insurers, and pension funds are being nudged to boost investments in domestic equities.
• The CSI 300’s dividend yield (~3.5%) compared to government bond yields (~1.6%) makes stocks look attractive over “safe” instruments. Fiscal and monetary policy stimulus could further fuel growth.
Chart Insight:
Here’s an interesting observation comparing the CSI 300 and Bitcoin charts. Bitcoin’s peaks aligned with CSI 300 in late 2017–early 2018 and Q1 2021.
The next peak might hit in 180–200 days—around late March to April 2026.
There’s also a chance for a Bitcoin and altcoin rally (the altseason everyone’s waiting for) within that same timeframe.
Snapshot:
#StockMarket #China #Bitcoin

BABA: triangle with tensionOn the weekly chart, BABA has already formed a golden cross - price is above both MA50 and MA200, confirming a bullish trend shift. The stock is now approaching the upper edge of the symmetrical triangle and the key resistance at $122, which also aligns with the 0.5 Fibonacci level.
The numbers inside the triangle represent the contraction phases, not Elliott waves. This is a classical consolidation before a potential breakout. If the $122 level is broken and retested, upside targets are $128 (0.618), $137 (0.786), and eventually $148–181 (1.0–1.618 extension).
Volume is rising, MACD is flipping bullish, and RSI is climbing out of oversold territory — all signs point to growing bullish momentum.
Fundamentally, Alibaba benefits from China's economic rebound, possible regulatory relief, and ongoing share buybacks. With Chinese tech rotating back into favor, BABA could lead the rally.
So if you're still waiting for a signal - it's already here. The golden cross is done, price is flying above moving averages, and all that’s left is a clean breakout. Watch $122 — that’s the launchpad.

Hype betas crowding the market like agent Smith In the world of memecoins, during the previous cycle you had token with "baby" appended in front of a bigger token's name. Their purpose was to use token tax collected from its trading (5% mostly) and use it to buy the main memecoin. These were the origins of beta play memecoins.
In this cycle, we had beta plays that didn't benefit the main coin in any way but they were made as a coping mechanism for people who missed out on the main one. Examples include countless WIF derivatives, blonde and brunette on base, trump and melania on sol earlier this year.
Regardless, in both the cases arrival of beta plays kills the main coin and ofcourse itself too. In previous cycle one would argue it made people think "what is the inherent value of this token if not collecting taxes to buy the main one? Why then shouldn't I buy the main one. Then their minds would ponder " what is the inherent value of the main one even? Why should I buy it?" And everything would nosedive. In this cycle, their is shortage of retail liquidity so arrival of beta plays sucks out monetary liquidity and attention liquidity from the main coin and injects it into the derivative. The derivative coin pumps while the main one dies. And then people realise the derivative doesn't have as much meme power as the main one. So this dies too and people move on to the next one.
But that's about memecoins. Such kinds of things shouldn't happen to serious chains right? Well i don't know if we should consider anything serious really. Call me silly but i see parallels between hype this cycle and luna last cycle. Both attracted people who wanted decentralisation above anything else. Although in case of hype the decentralisation factory is disputed, we can keep that talk for a later date. So cults can take things to the top but can they keep it up there? Maintainance is harder than the rise. I'm not saying it will crash and burn like luna but at some point the bells will be rung, and we'll be too busy partying loudly to hear them.
Binance founder came out of prison and decided to launch his own version of hyperliquid to vamp attack hype. This shouldn't be that concerning because eth and bnb have coexisted forever... Right? Not really. Hype is not eth. If you were there to see eth go from ico to $100 you'd understand what I'm saying. But regardless, this cycle even eth is struggling and bnb is breaking ATH after ATH. I was never a fan of binance ecosystem but i recently learned the chinese crypto community lives in their own world. For them BNB is both BTC and ETH. And anything the binance people make them believe. I'm not the biggest fan of Aster but chinese community+ hyperliquid factory + the fact that most retail normal people outside Anglo countries use binance makes me think....
HYPE is short term bearish desu.

RBA's Bullock says inflation under control, Aussie steadyRBA Governor Bullock testified before a parliamentary committee on Monday. Bullock said that inflation was in a "very good position" as higher interest rates had curbed demand. Still, she warned that there inflation risks remained on "both sides".
Bullock was less positive about the geopolitical environment, warning that the significant change in the global trading system which had created massive uncertainty. The Reserve Bank was particularly concerned about the impact of US tariffs on China, Australia's largest trading partner.
Bullock warned that the financial markets had not priced in the risks of the tariffs, which could affect financial stability if the the domstic economy was significantly affected by the tariffs.
The RBA is expected to hold the cash rate at 3.6% at next week's meeting, after lowering rates by a quarter-point in August. The markets have priced in a 10% likelihood of a rate cut at the upcoming meeting, with an 86% likelihood of a cut in November.
There are no US economic releases today but investors will be keeping a close eye on Fedspeak, with five FOMC members scheduled to deliver public remarks. New Fed Governor Miran, who voted for a 50-bp cut at the September 17 meeting, is expected to give a detailed explanation of his view in today's speech.
At last week's meeting, the Fed signaled that more rate cuts were coming and the markets have priced in an October cut at 90%, according to CME's FedWatch. The Fed appears to have shifted to a more dovish stance after maintaining rates since December 2024 until lowering rates last week.
AUDUSD tested support at 0.6589 and 0.6580 earlier. Next, there is support at 0.6567
There is resistance at 0.6602 and 0.6611
GDS | Data Centers in China | LONGGDS Holdings Ltd. engages in developing and operating data centers in China. It builds, operates, and transfers data centers at other locations. Its data centers are carrier and cloud-neutral, which enable customers to connect to major telecommunications carriers, and to access a number of cloud service providers. The firm also offers colocation and managed services, which include direct private connection to major public cloud platforms. The company was founded by William Wei Huang in 2001 and is headquartered in Pudong, China.

BILI | China Tech Will Rise | LONGBilibili, Inc. is a holding company, which engages in the provision of online entertainment content. The firm enables broad video-based content consumption scenarios centered around professional user generated videos supplemented with live broadcasting, occupationally generated videos, or occupationally generated videos. The company was founded by Xu Yi in June 2009 and is headquartered Shanghai, China.

WTI falls after US slaps 50% tariff on India over Russian oilWTI oil prices have dropped from $65 to around $62.80 as markets react to new US tariffs on India, triggered by India’s ongoing oil trade with Russia. These tariffs, along with threats of even higher tariffs on China, are weighing on global demand and pushing oil prices lower. Meanwhile, Iran’s oil production has hit multi-year highs, adding more supply to the market and reinforcing the bearish trend.
Technically, oil has broken below a key Fibonacci support level, signalling a deeper pullback. If prices fall below $62, further downside toward $57 is possible. Upside moves may be short-lived unless there’s a major geopolitical shock, such as an escalation in the Russia-Ukraine conflict. For now, both the macro environment and technical signals indicate continued pressure on oil prices.
This content is not directed to residents of the EU or UK. Any opinions, news, research, analyses, prices or other information contained on this website is provided as general market commentary and does not constitute investment advice. ThinkMarkets will not accept liability for any loss or damage including, without limitation, to any loss of profit which may arise directly or indirectly from use of or reliance on such information.

CN50 price action forming a top?CHN50 - 24h expiry
Intraday rallies continue to attract sellers and there is no clear indication that this sequence for trading is coming to an end.
Price action looks to be forming a top.
Rallies should be capped by yesterday's high.
We look for a temporary move higher.
Risk/Reward would be poor to call a sell from current levels.
We look to Sell at 15235 (stop at 15369)
Our profit targets will be 14835 and 14765
Resistance: 15288 / 15400 / 15500
Support: 15063 / 15000 / 14900
Risk Disclaimer
The trade ideas beyond this page are for informational purposes only and do not constitute investment advice or a solicitation to trade. This information is provided by Signal Centre, a third-party unaffiliated with OANDA, and is intended for general circulation only. OANDA does not guarantee the accuracy of this information and assumes no responsibilities for the information provided by the third party. The information does not take into account the specific investment objectives, financial situation, or particular needs of any particular person. You should take into account your specific investment objectives, financial situation, and particular needs before making a commitment to trade, including seeking, under a separate engagement, as you deem fit.
You accept that you assume all risks in independently viewing the contents and selecting a chosen strategy.
Where the research is distributed in Singapore to a person who is not an Accredited Investor, Expert Investor or an Institutional Investor, Oanda Asia Pacific Pte Ltd (“OAP“) accepts legal responsibility for the contents of the report to such persons only to the extent required by law. Singapore customers should contact OAP at 6579 8289 for matters arising from, or in connection with, the information/research distributed.

Forex pricing depending on TikTok Trade talks between the US and China are occurring this week, and a major topic of conversation could be how TikTok can be severed from its Chinese government and Chinese/ Hong Kong corporate interests.
How this plays out is could affect overall market sentiment in the U.S.–China trade relationship, which in turn could ripple through global risk assets. Forex pairs related to commodity exports or closely correlated with Chinese economic performance, like the Australian dollar (AUD), may see indirect effects.
AUD/USD is currently in an uptrend in the short‐term, trading within an ascending channel.
The latest candles show strong green closes with shallow pullbacks. That type of price action can indicates continuation rather than exhaustion, at least until the next key resistance zone.
Key resistance potentially lies at ~0.6687, with a more significant barrier at ~0.67485.
Support zones perhaps lie just below current prices: near the 9-day EMA. The 50-day EMA could provide a stronger support if the pair pulls back.

KWEB: China’s Internet Sector - AI Catch-Up and Cheap ValuationsChina’s internet and tech stocks have been hammered for years — regulatory crackdowns, slowing growth fears, and geopolitical tension have crushed sentiment. But as investors know, the best opportunities often hide in what everyone hates.
Enter KWEB, the KraneShares CSI China Internet ETF.
It’s a diversified, liquid way to play a bounce in major names like Alibaba, Tencent, JD .com, Baidu, Meituan and PDD.
Here’s why I think the risk/reward looks compelling now — especially if you believe in AI closing the gap.
Key Bullish Points:
1) Valuations at Rock-Bottom
Many big China internet stocks are still trading at single-digit P/E ratios, even as their cash flows recover. Compared to U.S. big tech trading at 30–50x, this is a huge valuation gap.
Regulatory fears seem largely priced in — Beijing wants growth, not stagnation, and some policies are easing.
2) China’s AI Push — Just “Months Behind”
Jansen Whang recently argued that China’s generative AI development is only “months behind” the U.S. Players like Baidu, Alibaba Cloud, Tencent, and SenseTime are all racing to launch new LLMs and integrated AI tools.
If you believe the gap closes, Chinese platforms could see a major earnings rebound as they roll out AI upgrades across search, cloud, e-commerce and social media.
3) Sentiment So Bad, It’s Good
When the headlines scream “China is uninvestable,” that’s often when big mean reversion trades set up. Even a small policy pivot, stimulus plan, or positive AI news cycle can spark a sharp rally.
KWEB is one of the cleanest ways to express this view because it holds a diversified basket — you don’t have to pick a single winner.

A Great and Clear Idea For AlibabaKEY POINTS (Why this idea stands out):
Bullish Symmetrical Triangle → The breakout has already happened, and the price has successfully retested the triangle trendline — a strong confirmation of bullish continuation.
Fibonacci Retracement → Confirms healthy pullback levels, showing the market structure is intact and technically strong.
Fibonacci Extension aligned with Triangle Take Profit → Rare confluence that significantly increases the probability of hitting the target.
MACD Bullish Crossover → Momentum indicator is turning positive, further validating the bullish setup and supporting upside continuation.
📊 This is a pure and clear Murphy-style Technical Analysis, based exclusively on objective chart signals.
Why Alibaba (like JD.com) is the right choice now:
Deeply undervalued: Current market price does not reflect Alibaba’s real business strength.
Pre-earnings tech opportunity: Chinese tech stocks historically experience strong price action ahead of earnings.
Perfect technical + fundamental alignment: Breakout confirmation, Fibonacci confluence, and bullish momentum (MACD) combine with undervaluation to create a high-probability setup.
⚠️ Main Risk Factor:
U.S. financial media often manipulates sentiment on Chinese equities with aggressive negative campaigns (Zacks, Dow Jones News, Alpha News).
✅ Solution: Filter out the noise and rely on neutral, fact-based outlets like Reuters.]
$CNIRYY - China CPI (August/2025)ECONOMICS:CNIRYY
August/2025
source: National Bureau of Statistics of China
- China’s consumer prices dropped 0.4% yoy in August 2025, after being flat in the previous month and missing market expectations of a 0.2% fall.
It was the fifth time of consumer deflation this year and the sharpest pace since February.
Food prices slumped (-4.3% vs -1.6% in July), logging the steepest fall in nearly four years, with broad-based decreases across categories and a sharper drop in pork prices, due to ample supply, lower production costs, and weak demand.
In contrast, non-food inflation quickened (0.5% vs 0.3%), supported by Beijing’s ongoing consumer goods subsidies, with increases in housing (0.1% vs 0.1%), clothing (1.8% vs 1.7%), healthcare (0.9% vs 0.5%), and education (1.0% vs 0.9%).
Meanwhile, transport costs shrank but at a slower pace (-2.4% vs -3.1%). Core inflation, which excludes food and energy, rose 0.9% yoy, the highest in 18 months, after a 0.8% gain in July.
On a monthly basis, CPI was flat, below forecasts of 0.1%, following a 0.4% increase in July.

$CFX: my green zones are back. Time to refill our bags.LSE:CFX delivered an impressive bounce during this mini-altseason, confirming it’s a project worth keeping on the radar for the upcoming full altseason.
However, its non-US listing status could limit its performance if BlackRock launches altcoin index ETFs — as it’s unlikely Conflux would be included, meaning it wouldn’t directly benefit from institutional inflows.
That said, LSE:CFX remains a strong, China-based blockchain project, and if the Chinese government takes significant steps toward crypto adoption, this coin has the potential to skyrocket.
--------------------------------
The altcoin market just saw a solid pump, following the massive CRYPTOCAP:BTC and CRYPTOCAP:ETH institutional billion-dollar purchases.
On the Daily timeframe, we’re actually printing higher lows, showing clear market strength. The top of the range was rejected, and now it’s highly probable that the crypto market will enter a consolidation phase — a move that could push several altcoins into my buying zones.
💡 Reminder: My buying zones are areas where it’s statistically safer to buy and hold, with an almost guaranteed chance of making a solid profit on the next bounce.
What could spark the infamous Altseason?
Many altcoins share one thing in common: a major resistance line (marked in yellow). For them to pump to the moon, this line needs to be broken.
We’re also seeing a price compression — meaning the breakout could be imminent. This pullback might be your last chance to enter a long position before the real Altseason kicks off.
Possible Altseason catalysts:
📉 FED Interest Rate Cut of 1% or more.
📈 Institutional adoption through altcoin index ETFs — imagine BlackRock launching ALT10, ALT50, ALT100 ETFs, attracting massive institutional money into the altcoin market.
I believe both events could happen before the end of the year.
DYOR — but the window might be closing fast. 🚀

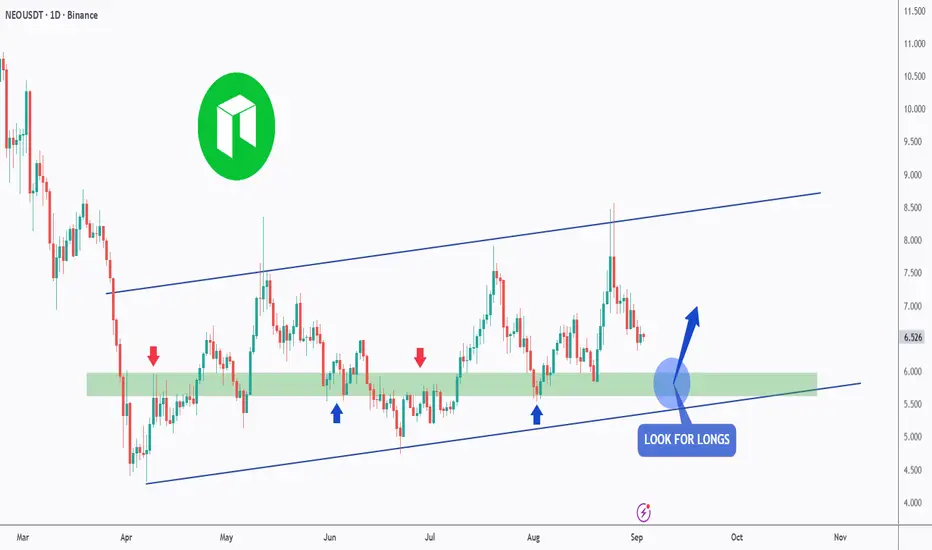
NEO - Will the Bulls take over?Hello TradingView Family / Fellow Traders. This is Richard, also known as theSignalyst.
📈NEO has been overall bullish trading within the flat rising channel marked in blue.
This week, NEO has been retesting the lower bound of the channel.
Moreover, the green zone is a strong support and structure.
🏹 Thus, the highlighted blue circle is a strong area to look for buy setups as it is the intersection of the lower blue trendline and green support.
📚 As per my trading style:
As #NEO approaches the blue circle zone, I will be looking for trend-following bullish reversal setups (like a double bottom pattern, trendline break , and so on...)
📚 Always follow your trading plan regarding entry, risk management, and trade management.
Good luck!
All Strategies Are Good; If Managed Properly!
~Richard Nasr
Australian dollar extends gains, hits three-week highThe Australian dollar is coming off a positive week and has extended its gains on Monday. In the North American session, AUD/USD is trading at 0.6556, up 0.27% on the day. Earlier, the Aussie rose as high as 0.6560, its highest level since August 11. With US markets closed for Labor Day, we're unlikely to see stronger movement from AUD/USD during the day.
China's manufacturing sector continues to contract and that could spell trouble for the Australian economy and the Aussie. China's manufacturing PMI for August inched higher to 49.4 from 49.3 in August. This missed the market forecast of 49.5 and marked the fight straight month of contraction in manufacturing.
The manufacturing industry has been dampened by weak global demand and US tariffs on Chinese products. The drop in manufacturing activity means there has been less demand for iron ore from Australia, which is used in the production of steel. This has resulted in a decline in iron ore prices, which has weighed on the Australian dollar and dampened Australia's export-reliant economy.
The US core personal consumption expenditures price index (core PCE), the Federal Reserve's preferred inflation indicator, ticked higher to 2.9% in July, up from 2.8% in June. This matched the market estimate and was a five-month high. Monthly, core PCE rose 0.3%, unchanged from June and in line with the market estimate. The slight rise in US core inflation has raised expectations of a rate cut at the Fed's September 17 meeting to 89%, up from 86% just before the core PCE release on Friday.
AUD/USD is testing resistance at 06552. Above, there is resistance at 0.6563 and 0.6578
0.6537 and 0.6526 are providing support

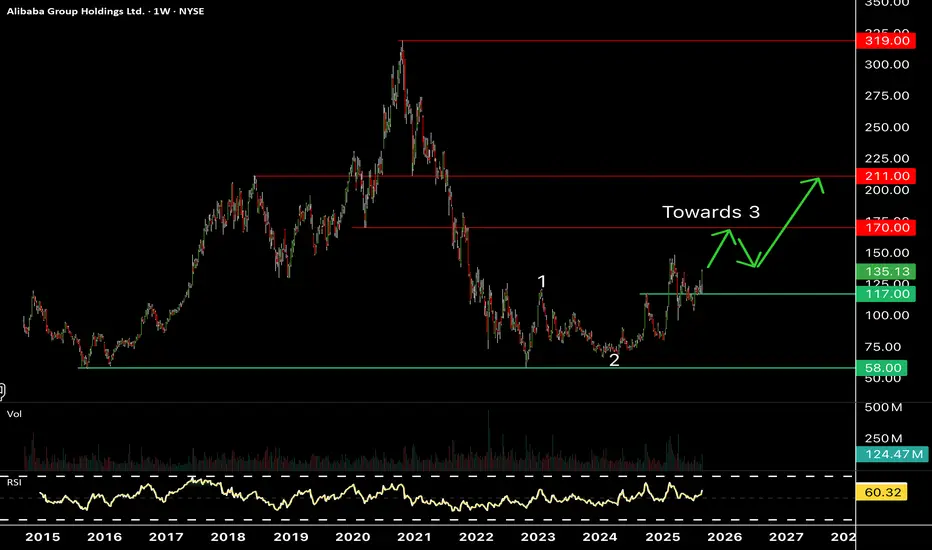
Is Alibaba a Buy: Fundamental Deep DiveWe have looked over some key metrics of Alibaba.
Based on Revenue, Debt, Net Income, PE, Free Cash Flow and other metric we have concluded that Alibaba can continue to move higher.
We provide some baseline targets based off of wall street EPS estimates.
We prove some hyperbolic targets based off of historical median PE targets.
Its amazing how much risk premium is built into this China valuation as Alibaba sure looks good.
EPS is set to continue to surge, Cap Ex spending should slow, net debt has been reducing.
All key metrics support a stronger balance sheet and a continued growth.
Baba cloud division is finally turning profitable and if this continues will be a major tailwind for the stock.
New AI chip development could catapult this stock as it tries to capture a tiny share of NVDA market.
We have been long NYSE:BABA since early July and will continue to buy on pullbacks (Not FA advice)

Is Alibaba entering a stage 2 breakout formation? This video depicts a pure technical summary of Alibaba on multiple different time frames.
We will follow this video up with a fundamental view.
Using previous cycles we believe Alibaba is poised for a 12-24 month explosive move.
Baba looks o be entering the explosive stage 2 formation.
Breaking out and defending monthly chart support...Baba looks great on all time frames.
Many bullish patterns are triggering....Weekly bull flags / inverse head and shoulders.
The minimum upside target if the bullflag completes is around 160 - 165.
We have been long Baba since early July when it kissed the daily 200 MA.

Alibaba looking to move higherToday's results seem to have trigger Alibaba for much higher levels. The market seems to have appreciated the growth of its cloud and AI business as well as its new AI chips.
Chinese big cap techs are much cheaper than US counterparts and seem to be presenting interesting opportunities.
Next resistance/target in the $170 area as long as $117 support is holding.
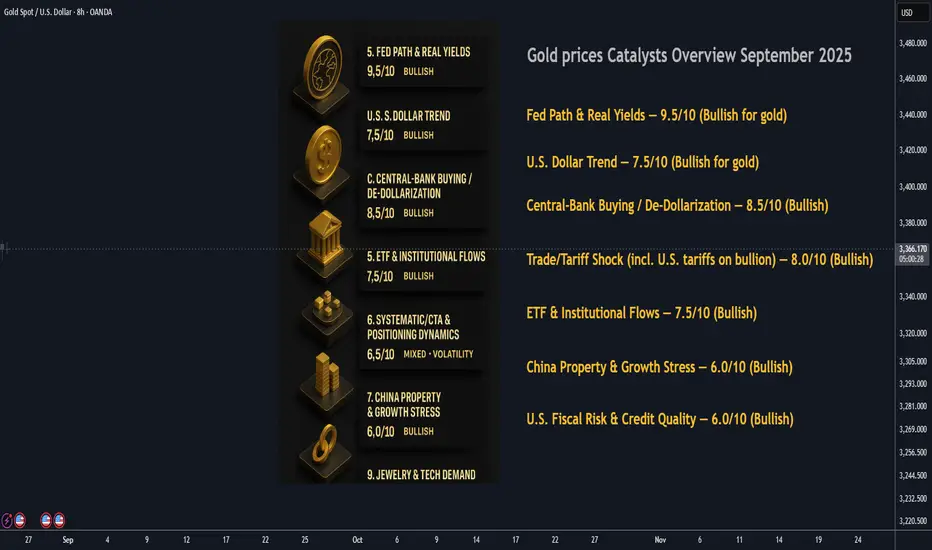
Gold Prices Overview of Primary Catalyst : September 2025⚡️ Gold: Consolidation Before the Next Move
Gold set fresh records earlier this year and now sits in a tight post–Jackson Hole range around $3,360–$3,380/oz as rate-cut odds jumped and the dollar eased back. Spot was ~$3,368 this morning, slightly off Friday’s spike after Powell opened the door to a September cut.
________________________________________
1) Fed Path & Real Yields — 9.5/10 (Bullish for gold)
Powell’s Jackson Hole remarks highlighted rising labor-market risks and explicitly “opened the door” to a September cut. Futures now price a high probability of an initial -25 bps move with more to follow into year-end. Lower policy rates/real yields remain the single strongest tailwind for non-yielding gold.
2) U.S. Dollar Trend — 7.5/10 (Bullish for gold)
The DXY slipped toward the high-97s after Powell’s dovish tilt and remains soft versus recent peaks, reducing a key headwind to non-USD buyers. If the dollar rebound stalls, gold’s upside path stays cleaner.
3) Central-Bank Buying / De-Dollarization — 8.5/10 (Bullish)
Official-sector demand stays structurally strong. Global central banks remain on track for another ~1,000t year, with China’s PBoC extending purchases for a ninth straight month. This “sticky” bid continues to underwrite dips.
4) Trade/Tariff Shock (incl. U.S. tariffs on bullion) — 8.0/10 (Bullish)
The broad U.S. tariff regime (10% baseline, higher on targeted goods) is inflationary at the margin; crucially, imports of 1kg/100oz gold bars were swept into the rules, temporarily snarling Swiss shipments and roiling COMEX/LBMA logistics until guidance is clarified. Result: fatter location/financing premia and periodic price dislocations that tend to support spot.
5) ETF & Institutional Flows — 7.5/10 (Bullish)
After years of outflows, ETF inflows in the first half of 2025 were the strongest in 5 years (~$38B; +397t), with July showing further additions. GLD holdings are back near ~957t. Continued inflows amplify macro moves.
6) Systematic/CTA & Positioning Dynamics — 6.5/10 (Mixed → Volatility)
CTAs and options flow are magnifying swings around key levels ($3,350–$3,420). Upside call demand is persistent, meaning whipsaws remain likely as trend-following systems react to dollar/yield shifts.
7) China Property & Growth Stress — 6.0/10 (Bullish)
The Evergrande delisting and deepening Country Garden losses underscore a property slump that keeps risk appetite in check and supports defensive assets. Weak housing drags on jewelry demand but typically supports investment demand for bullion.
8) U.S. Fiscal Risk & Credit Quality — 6.0/10 (Bullish)
The May downgrade of U.S. sovereign credit and ongoing wide deficits keep a slow-burn bid under gold. Any wobble in auctions or debt-ceiling theatrics would push this higher.
9) Jewelry & Tech Demand — 5.0/10 (Slightly Bearish/neutral short-term)
Record prices hit Q2 jewelry volumes (-14% y/y to 341t), though India shows early signs of seasonal revival into festivals. Tech demand dipped ~2% y/y amid electronics softness. Physical demand is a brake on parabolic rallies.
10) Geopolitics (Ukraine, Middle East, Taiwan risk, etc.) — 5.5/10 (Event-Bullish)
Headlines remain volatile—Israeli strikes on Iran-aligned Houthis and ongoing Ukraine politics keep a latent safe-haven premium. Spikes are event-driven unless escalation persists.
________________________________________
🌐 Other Catalysts to Watch
• Crypto Cross-Flows (5/10): Sharp crypto drawdowns can funnel short-term interest into gold, though correlation remains inconsistent.
• Bullion Logistics & Refining (New): U.S. tariff ambiguity on kilobars introduces intermittent premiums and arbitrage opportunities between Zurich–London–NY.
• Physical Supply Disruptions (4/10): Always idiosyncratic; currently secondary to macro.
| Rank | Catalyst | Score/10 | Current Impact | Direction | Notes |
| ---- | ------------------------------------------ | -------: | -------------- | ------------------------------ | ------------------------------------------------------------ |
| 1 | Fed path & real yields | **9.5** | Very High | **Bullish** | Dovish tilt; cuts now live for Sept. |
| 2 | Central-bank buying | **8.5** | High | **Bullish** | Ongoing official demand; PBoC keeps adding. |
| 3 | Trade/tariff shock (incl. bullion tariffs) | **8.0** | High | **Bullish** | Broad tariffs + bullion rules raise premia & inflation risk. |
| 4 | U.S. dollar trend | **7.5** | High | **Bullish** | DXY softer post-Jackson Hole; less drag on gold. |
| 5 | ETF/institutional flows | **7.5** | High | **Bullish** | Biggest inflows in 5 yrs; GLD holdings high. |
| 6 | Systematic/CTA flows | **6.5** | Moderate | **Mixed** | Options/CTA activity driving overshoots both ways. |
| 7 | China property stress | **6.0** | Moderate | **Bullish** | Structural drag supports safe-haven demand. |
| 8 | U.S. fiscal/credit risk | **6.0** | Moderate | **Bullish** | Downgrade + deficits maintain hedge demand. |
| 9 | Jewelry/tech demand | **5.0** | Low | **Neutral → Slightly Bearish** | Jewelry volumes fell 14% y/y; festivals could revive. |
| 10 | Geopolitics (broad) | **5.5** | Low–Mod | **Bullish (event-driven)** | Episodic; not the primary driver now. |