NVDA 1D: Pause before the next chipOn the daily chart NVIDIA has shifted from a strong impulsive advance into a consolidation phase. After printing new local highs, price formed a contracting structure, broke higher, and returned for a retest of the breakout area. Selling pressure remains limited, with no follow-through to the downside, suggesting a pause within trend rather than a reversal.
Structurally, price action reflects consolidation inside a broader uptrend. The 185–190 area remains the key holding zone, where price stabilized after the retest and continues to trade above the 100-day moving average. Higher lows are preserved, keeping the higher timeframe structure intact. MACD holds above the zero line, while ADX continues to decline, confirming compression rather than directional expansion.
The primary reaction level sits near 212, marking the upper boundary of the current consolidation. Acceptance above this level would allow for continuation toward the 230–232 area, aligning with the upper expansion of the range. A failure to hold the 185-190 zone would shift price into a wider neutral structure without confirmation of trend continuation.
Fundamentally, NVIDIA remains strong. Q3 2025 EPS came in at 1.30 USD, with Q4 2025 EPS estimated at 1.52 USD ahead of the February 26, 2026 earnings release. Revenue reached 57.01B USD in Q3, with expectations of 65.56B USD for Q4. Cash flows remain robust, with operating cash flow at 83.16B USD and free cash flow at 77.32B USD. Compute and Networking continues to be the dominant revenue driver.
As long as structure holds, the market remains in digestion mode following the prior impulse.
Price action leads before fundamentals follow.
Chips

Can America Break China's Rare Earth Monopoly?USA Rare Earth (Nasdaq: USAR) stands at the center of America's most ambitious industrial gamble in decades. The company pursues a vertically integrated "mine-to-magnet" strategy designed to break China's stranglehold on rare earth elements, critical materials that power everything from electric vehicles to F-35 fighter jets. With China controlling 70% of global mining and over 90% of refining capacity, the United States faces a strategic vulnerability that threatens both its defense capabilities and its energy transition. Recent Chinese export restrictions on gallium and germanium have accelerated USA Rare Earth's timeline, with commercial production now targeted for late 2028, two years ahead of previous guidance.
The company's success hinges on extraordinary government backing and massive capital infusions. A $1.6 billion letter of intent from the Department of Commerce, combined with a $1.5 billion private investment, provides $3.1 billion in potential funding. The government will take a 10% equity stake, signaling an unprecedented public-private partnership in critical infrastructure. This funding supports the entire value chain: extraction at the Round Top deposit in Texas, chemical separation in Colorado, and advanced magnet manufacturing in Oklahoma. The Round Top deposit itself is geologically unique, a 1-billion-metric-ton laccolith containing 15 of 17 rare earth elements, processable through cost-effective heap leaching rather than traditional roasting.
Beyond minerals, the project represents a test of American industrial resilience. The Trump administration's "Project Vault" initiative establishes a $12 billion strategic mineral reserve modeled after the Strategic Petroleum Reserve. International alliances with Australia, Japan, and the United Kingdom create a network of "friend-shored" supply chains designed to counter Beijing's leverage. USA Rare Earth's acquisition of UK-based Less Common Metals provides critical refining expertise currently unavailable outside China. The company achieved a milestone in January 2026 by producing its first batch of sintered neodymium magnets at its Oklahoma facility, proving its technical capabilities.
The path forward remains treacherous. Critics point to timeline delays, insider selling, and the volatility inherent in pre-revenue mining ventures. Short sellers have claimed a potential 75% downside, questioning equipment age and promotional tactics. Yet the strategic imperative is undeniable: without domestic rare earth capacity, the United States cannot maintain technological superiority in defense or achieve energy independence. USA Rare Earth's 2030 goal of processing 8,000 tons of heavy rare earths and producing 10,000 tons of magnets annually would fundamentally reshape global supply chains. The billion-dollar race for magnet supremacy will determine whether America can reclaim industrial sovereignty or remain dependent on geopolitical rivals for the minerals of the future.

[LOI] - SK Hynix - SK Hynix
Key Points :
Bullish Outlook on SK Hynix : The company dominates the high-bandwidth memory (HBM) market with over 50% share, driven by AI demand from clients like NVIDIA. Record 2025 profits suggest continued growth in 2026, with analysts forecasting undervaluation and potential 20-50% stock upside amid a memory supercycle.
CHIPS Act Benefits : SK Hynix secured up to $458M in direct grants and $500M in loans, plus 25% tax credits, supporting its $3.87B Indiana investment. This funding accelerates U.S.-based AI chip packaging, enhancing domestic supply chains.
On-Shoring Advantages : The West Lafayette facility marks SK Hynix's first U.S. advanced packaging plant, creating 1,000 jobs and reducing reliance on Asian production. It aligns with U.S. efforts to bolster national security and AI leadership.
Company Overview :
SK Hynix Inc. (KRX: 000660), a top-tier South Korean semiconductor firm, focuses on DRAM, NAND flash, and HBM chips essential for AI, data centers, and consumer devices. As of January 2026, it holds about 33% global DRAM market share and 21% in NAND, with a market cap around $383B and stock at ~$554. Recent developments include launching a U.S.-based "AI Company" in February 2026, showcasing 16-layer HBM4 at CES, and investing $13B in a new South Korean packaging plant.
Notes on how I personally use my charts/NFA:
Each level L1-L3 and TP1-TP3 (Or S1-S3) has a deployment percentage. The idea is to flag these levels so I can buy 11% at L1 , 28% at L2 and if L3 deploy 61% of assigned dry powder. The same in reverse goes for TP. TP1: 61%, TP2:28% and TP3:11%. If chart pivots between TP's, in-between or in Between Sell levels these percentages are still respected. I like to use the trading range to accumulate by using this tactic.
Just my personal way of using this. This is not intended or made to constitute any financial advice.
This is not intended or made to constitute any financial advice.
NOT INVESTMENT ADVICE
I am not a financial advisor.
The Content in this TradingView Idea is for informational purposes only, you should not construe any such information or other material as legal, tax, investment, financial, or other advice. Nothing contained within this idea constitutes a solicitation, recommendation, endorsement, or offer to buy or sell any securities or other financial instruments in this or in in any other jurisdiction in which such solicitation or offer would be unlawful under the securities laws of such jurisdiction.
All Content on this idea post is information of a general nature and does not address the circumstances of any particular individual or entity. Nothing in the idea/post constitutes professional and/or financial advice, nor does any information on the idea/post constitute a comprehensive or complete statement of the matters discussed or the law relating thereto. You alone assume the sole responsibility of evaluating the merits and risks associated with the use of any information or other Content on the idea/post before making any decisions based on such information.
Sir. Galahad - QUANT
Disclaimer
The information and publications are not meant to be, and do not constitute, financial, investment, trading, or other types of advice or recommendations supplied or endorsed by.

[LOI] - WolfSpeed - WolfSpeed Inc.
Key Points:
Bullish Outlook on Wolfspeed : Research suggests Wolfspeed is well-positioned for growth in silicon carbide (SiC) demand, driven by EVs, AI data centers, and renewables, with potential margin expansion as new fabs ramp up. However, financial risks like debt and dilution temper absolute confidence.
CHIPS Act Benefits : Wolfspeed has secured significant support, including nearly $700M in tax refunds received and up to $750M in grants, enabling U.S. expansions that enhance domestic supply chains.
On-Shoring Advantages : U.S. semiconductor reshoring efforts align with Wolfspeed's investments in North Carolina and New York facilities, potentially bolstering national security and economic resilience amid global competition.
Key bearish insiders :
- November 14, 2025: Soros Fund Management added new put positions in NYSE:WOLF , part of a portfolio update including other hedges like NASDAQ:SMH puts.
Notes on how I personally use my charts/NFA:
Each level L1-L3 and TP1-TP3 (Or S1-S3) has a deployment percentage. The idea is to flag these levels so I can buy 11% at L1 , 28% at L2 and if L3 deploy 61% of assigned dry powder. The same in reverse goes for TP. TP1: 61%, TP2:28% and TP3:11%. If chart pivots between TP's, in-between or in Between Sell levels these percentages are still respected. I like to use the trading range to accumulate by using this tactic.
Just my personal way of using this. This is not intended or made to constitute any financial advice.
This is not intended or made to constitute any financial advice.
NOT INVESTMENT ADVICE
I am not a financial advisor.
The Content in this TradingView Idea is for informational purposes only, you should not construe any such information or other material as legal, tax, investment, financial, or other advice. Nothing contained within this idea constitutes a solicitation, recommendation, endorsement, or offer to buy or sell any securities or other financial instruments in this or in in any other jurisdiction in which such solicitation or offer would be unlawful under the securities laws of such jurisdiction.
All Content on this idea post is information of a general nature and does not address the circumstances of any particular individual or entity. Nothing in the idea/post constitutes professional and/or financial advice, nor does any information on the idea/post constitute a comprehensive or complete statement of the matters discussed or the law relating thereto. You alone assume the sole responsibility of evaluating the merits and risks associated with the use of any information or other Content on the idea/post before making any decisions based on such information.
Sir. Galahad - QUANT
Disclaimer
The information and publications are not meant to be, and do not constitute, financial, investment, trading, or other types of advice or recommendations supplied or endorsed by.

TSLA Catalysts Ranking | Q1 2026 Update | by ProjectSyndicateTSLA: Updated Outlook Jan 2026 — Catalyst Memo
Updated Catalyst Scorecard Ranked by Impact
1 🤖 Autonomous and Robotaxi Execution — 9.4
2 🧱 Energy AI and Optimus Optionality — 9.0
3 🏭 EV Demand and Geographic Mix — 7.8
4 🧮 Battery Cost and Margin Levers — 7.6
5 🗃️ Affordable Model and Next Gen Platform — 7.4
6 ⛓️ Competition and Global Share — 6.7
7 🧭 Macro Trade and Policy — 6.6
8 📉 Rates and Credit Conditions — 6.1
9 🧾 US EV Incentives and Pull Forward — 5.2
10 🧪 Commodities and Inputs — 5.1
11 🛡️ Safety Regulatory and Governance Risk — 8.2 risk flag
________________________________________
Primary Catalyst Stack Updated Scores
🤖 1 Autonomous and Robotaxi Execution — 9.4 out of 10 up
• What changed: Market reporting indicates robotaxi operations in Austin have progressed toward a less supervised operating format, strengthening the commercialization timeline signal.
• Key upside path: Expansion to additional geographies, measurable safety performance, and a clearer unit economics narrative.
• Primary risk: Regulatory intervention, operating restrictions, or a high profile incident that forces program throttling.
• Why higher: This is the clearest pathway to a structural multiple reset and remains the dominant driver of incremental investor positioning.
________________________________________
🧱 2 Energy AI and Optimus Optionality — 9.0 out of 10 up
• What changed: Energy storage deployments remain the most consistently constructive datapoint with rising investor focus on backlog visibility and margin trajectory.
• Key upside path: Sustained deployments growth plus improving profitability, positioning Energy as a second earnings engine rather than a cyclical adjunct.
• Primary risk: Supply chain constraints, project timing volatility, margin normalization if pricing tightens.
• Why higher: Energy plus AI infrastructure adjacency continues to expand the non auto terminal value narrative.
________________________________________
🏭 3 EV Demand and Geographic Mix — 7.8 out of 10 down
• What changed: Deliveries momentum has moderated versus prior year comps, with mix and regional pricing pressure remaining central to earnings power.
• Key upside path: Stabilization in core regions through product refresh cadence, financing support, and disciplined pricing.
• Primary risk: Extended price competition in China and Europe, weaker affordability, inventory driven discounting.
________________________________________
🧮 4 Battery Cost and Margin Levers — 7.6 out of 10 down
• What changed: Margin sensitivity remains elevated given pricing actions, mix shift, and fixed cost absorption.
• Key upside path: Lower bill of materials, manufacturing efficiencies, software attach, and Energy margin expansion.
• Primary risk: Further auto gross margin compression or inability to offset pricing with cost improvements.
________________________________________
🗃️ 5 Affordable Model and Next Gen Platform — 7.4 out of 10 flat
• What changed: The market continues to discount timing uncertainty. Without a defined ramp window, this remains a medium term catalyst rather than a near term driver.
• Key upside path: Clear launch timeline plus credible capacity plan that expands the addressable market.
• Primary risk: Execution delay, demand cannibalization, margin tradeoffs.
________________________________________
🧾 6 US EV Incentives and Pull Forward Dynamics — 5.2 out of 10 down
• What changed: Incentive support is structurally less constructive into 2026, increasing reliance on pricing, financing, and product cadence to drive volume.
• Key upside path: Stronger than expected natural demand, creative financing solutions, improved affordability.
• Primary risk: Air pocket in demand as incentive effects roll off.
________________________________________
📉 7 Rates and Credit Conditions — 6.1 out of 10 flat
• What changed: Financing conditions remain a meaningful second order driver for payment sensitive buyers.
• Key upside path: Easier financing plus improved consumer confidence.
• Primary risk: Sticky rates or tighter underwriting standards.
________________________________________
🧭 8 Macro Trade and Policy — 6.6 out of 10 up
• What changed: Policy remains a swing factor affecting both demand and cost corridors, with tariff and regulatory narratives capable of repricing risk quickly.
• Key upside path: Stable policy environment with limited new frictions.
• Primary risk: Adverse trade moves, tightening regulatory posture, or geopolitical disruptions.
________________________________________
⛓️ 9 Competition and Global Share — 6.7 out of 10 flat
• What changed: Competitive intensity remains high, particularly where local OEMs can compress price points.
• Key upside path: Product refresh leadership plus software differentiation.
• Primary risk: Sustained price war and commoditization pressure.
________________________________________
🛡️ 10 Safety Regulatory and Governance Risk — 8.2 out of 10 risk flag up
• What changed: Autonomy scrutiny remains an active overhang that can change the timeline overnight.
• Key downside path: Restrictions, remedies, reporting burdens, or reputational hits that slow adoption.
• Why elevated: This is the primary left tail against the autonomy bull case.
________________________________________
🧪 11 Commodities and Inputs — 5.1 out of 10 flat
• What changed: Input costs matter, but are not the gating item relative to demand, pricing, and autonomy timelines.
• Key upside path: Lower raw materials supporting margin.
• Primary risk: Sudden spikes that compress profitability.
________________________________________
________________________________________
Analyst positioning and targets
Street posture remains broadly balanced with dispersion widening between autonomy bulls and auto fundamental bears. Into the next earnings cycle, revisions risk is skewed toward fundamentals while multiple sensitivity remains skewed toward autonomy milestones and regulatory developments.
________________________________________
Headlines and tape drivers
• 🤖 Robotaxi commercialization signaling has strengthened
• 🧱 Energy deployments remain a key positive differentiator
• 🛡️ Regulatory scrutiny remains the principal headline risk
• 🧾 Incentive fade increases reliance on pricing and financing levers
________________________________________
Levels and structure
• 🧊 Support zones 405 to 415 then 380 to 395 then 330 to 350
• 🪨 Resistance zones 450 then 475 to 510 then 600
________________________________________
Next 60 to 90 days watch list
1 🤖 Robotaxi expansion pace, operating design, and safety metrics
2 🛡️ Regulatory milestones and any mandated remedies
3 🧱 Energy profitability commentary and backlog visibility
4 🏭 Pricing actions and demand elasticity post incentive fade

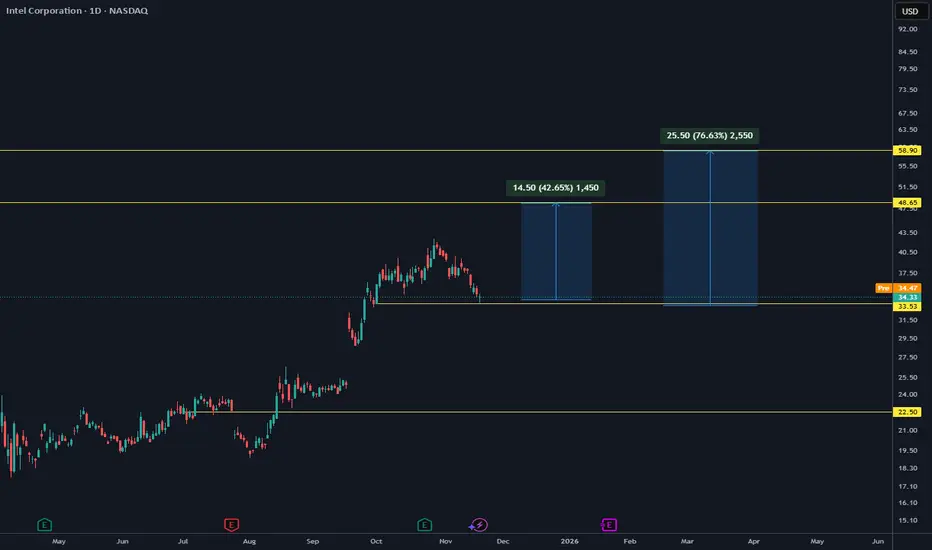
Intel Corporation | INTC | Long at $44.26Entered Intel NASDAQ:INTC after-hours at $44.26. The US government is too heavily invested in this one to let it truely slide. The earnings / EPS projections show a likely major turnaround. Any dips are purely programmatic for entry (watch insiders and politicians . I may sound like a conspiracy theorist here, but a $8.9 billion investment from the US government is absolutely going to lead to major returns by 2028/2029. There is a major price gap a lot of people aren't seeing all the way back to the year 2000 between $71.38 and $73.44. That's my main target. And, like dot-com crash, it may go further until.... So, in the near-term, there could be weakness and a dip to retouch the historical average band ($30's - another entry). But my outlook is longer. And, given the need for chips and the government wanting a major return on their investment, I suspect this one is going to lead to a solid return.
Targets into 2029
$60.00 (+35.6%)
$73.00 (+64.9%)

Is NVIDIA’s AI Boom Hitting a Wall?NVIDIA is the engine behind the global AI boom. From data centers to gaming and high-performance computing, its chips power the most advanced technology on the planet. Over the last two years, NVDA became the market’s biggest winner. Now, it has suddenly slowed down, and investors are asking why.
The stock is down about 12 percent from its all-time high of 212 dollars and closed at 186.23 dollars on January 27, 2026. Even after the pullback, NVIDIA is valued at an eye-watering 4.53 trillion dollars and trades at a P/E ratio of 46. That valuation assumes near-perfect execution, and the market is no longer willing to blindly chase it. After one of the strongest rallies in tech history, NVDA has spent months moving sideways. On the chart, the price is trapped inside a symmetrical triangle, a classic sign of indecision. It is not breaking higher, and it is not breaking lower. Everyone is waiting for something to give.
The biggest reason for this pause is geopolitical, not technical. NVIDIA appeared to secure a massive win with reported orders for more than two million H200 chips from Chinese tech companies, potentially worth around 54 billion dollars. At roughly 27,000 dollars per chip, this deal could have pushed the stock into a new valuation zone. But reality hit fast. Chinese customs blocked H200 shipments just days after the U.S. approved exports under a 25 percent tariff. According to industry sources, the message from Beijing was severe enough to feel like a temporary ban. NVIDIA’s suppliers have already slowed production, and that massive opportunity could disappear almost overnight.
Even if China eventually allows the chips, the math is no longer attractive. A 25 percent tariff means NVIDIA would lose a large chunk of revenue to the U.S. government. Higher prices also make Chinese buyers less enthusiastic, especially as Beijing pushes companies toward domestic alternatives from players like Huawei. This situation risks accelerating China’s long-term shift away from U.S. technology, threatening a market worth tens of billions of dollars every year.
Despite these risks, Wall Street remains optimistic. Analysts still rate NVDA a Strong Buy, with an average price target near 259 dollars, implying roughly 36 percent upside. Some firms, including Evercore ISI, see far higher levels if execution stays flawless. Confidence was also reinforced after CEO Jensen Huang called AI the largest infrastructure buildout in human history and backed that view with a 2 billion dollar investment in CoreWeave to expand AI data centers.
The outlook is clear but tense. NVIDIA is not broken. It is dominant, expensive, and stuck between massive opportunity and serious geopolitical risk. The long consolidation suggests the next move could be powerful. Whether it breaks higher or resets lower will depend less on charts and more on politics, pricing, and how much perfection the market is still willing to pay for.

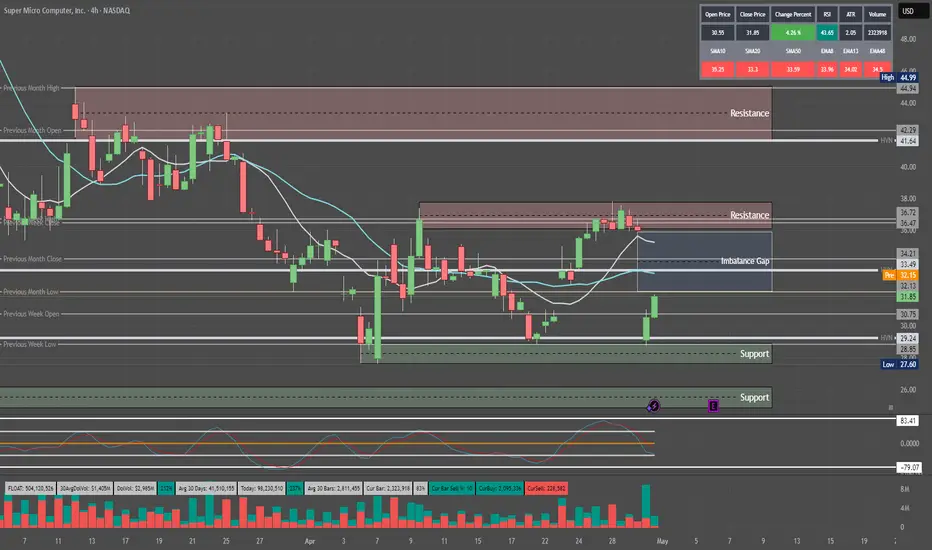
SUPER MICRO SEMI #SMCI Can bounce hard to $60This stock has been hit hard on prior forecast cuts and underwhelming results.
So after a big derating, a "less bad than feared" can be a classic bullish catalyst.
So after sentiment washed out but secular #AI demand still intact, can encourage dip buying and short covering in this name.
We also have the #ASML rumour of IP leaking and SMCI speeding up their own fabrication technology.

Micron’s AI Pivot: A 2025 Strategic & Geopolitical AnalysisThe “AI Supercycle” has finally matured from a buzzword into a tangible balance sheet reality. As of mid-December 2025, Micron Technology (MU) stands at a critical inflection point. With the Federal Reserve lowering rates to 3.75% and the semiconductor industry grappling with an unprecedented divergence between enterprise boom and consumer stagnation, Micron has aggressively repositioned itself. The upcoming fiscal Q1 2026 earnings report on December 17 represents more than a financial update; it is a referendum on CEO Sanjay Mehrotra’s high-stakes gamble on High Bandwidth Memory (HBM).
Business Model Transformation: The Enterprise Pivot
Micron is executing one of the most radical structural pivots in its history. The decision to deprioritize, and in some regions effectively sunset, its consumer-facing Crucial brand by early 2026 signals a ruthless allocation of capital. Management has correctly identified that the consumer PC market is a low-margin drag. Instead, production capacity is being violently swung toward enterprise-grade DRAM and AI-centric storage. This moves Micron from a commodity volume player to a specialized, high-margin infrastructure partner for hyperscalers like Microsoft and AWS.
Technology & Innovation: The HBM Wars
Technological supremacy is now defined by the roadmap to HBM4. While SK Hynix initially led the HBM race, Micron’s aggressive rollout of HBM3E has closed the gap. The company’s 1-beta and upcoming 1-gamma nodes utilize extreme ultraviolet (EUV) lithography to deliver power efficiency metrics that rival Asian competitors. Patent analysis reveals a surge in filings related to 3D-stacking architecture and advanced packaging, confirming that Micron is building a defensive IP moat around its high-performance compute capabilities.
Geostrategy & Geopolitics: Navigating the Fracture
Micron operates on the fault line of the US-China chip war. The lingering effects of Beijing’s 2023 ban on Micron products have accelerated the company’s "China-Plus-One" strategy. In response, Micron has doubled down on domestic manufacturing, leveraging the US CHIPS Act to fund mega-fabs in New York and Idaho. This is not just expansion; it is geopolitical insurance. By embedding itself into the US national security apparatus, Micron mitigates the risk of losing Chinese market share while securing subsidized capital that lowers its long-term cost of production.
Macroeconomics: The Rate Cut Tailwind
The Federal Reserve’s cut to 3.75% this November provides a specific, quantifiable benefit to Micron. Semiconductor manufacturing is arguably the most capital-intensive industry on earth. Lower borrowing costs directly improve the Net Present Value (NPV) of Micron’s multi-billion dollar fab projects. Furthermore, a softer dollar environment boosts the competitiveness of US exports, providing a tailwind for Micron’s international revenue recognition in fiscal 2026.
Cybersecurity & Supply Chain Integrity
In an era of state-sponsored cyber espionage, hardware security is a premium feature. Micron has elevated its cybersecurity posture by securing ISO/SAE 21434 certification for automotive memory, a critical requirement for modern SDVs (Software-Defined Vehicles). This focus extends to the supply chain; rigorous "Zero Trust" protocols now govern raw material sourcing, addressing the vulnerabilities exposed by recent global logistics disruptions. This security-first branding allows Micron to charge a premium to defense and automotive clients who cannot afford compromised hardware.
Management & Leadership
Sanjay Mehrotra’s tenure has been defined by discipline. Unlike previous cycles where memory makers flooded the market, causing price crashes, current leadership has shown remarkable restraint in CapEx spending. The 2025 strategy focuses on "bit growth discipline"—matching supply strictly to demand. This oligopolistic behavior, shared tacitly by competitors, has successfully engineered a favorable pricing environment, driving gross margins back toward the 40%+ range.
Conclusion: The Verdict
Micron Technology in late 2025 is no longer just a cyclical memory stock; it is a derivative play on the AI infrastructure build-out. The risks—ranging from HBM yield issues to renewed geopolitical friction—are real. However, the company’s strategic withdrawal from low-margin consumer markets and successful capture of CHIPS Act incentives position it favorably. As investors look to December 17, the question is not if AI demand exists, but if Micron can manufacture fast enough to satisfy it.

NVIDIA must hold $169A clear line in the sand is evident (in my eyes)
Closing beneath $169 could beget further selloffs and trigger a Head and shoulders pattern.
Which projects down to $135.
Around a -36% Haircut
At which point it could represent really good value to the long side.

GOOGL Stock Forming a BIG Pattern — Key Levels You MUST Watch!In this video, I break down a clear chart pattern forming on GOOGL (Alphabet) stock, using detailed technical analysis.
You’ll see exactly how the pattern developed, what levels matter right now, and where the stock could move next.
🔍 What’s Covered in This Analysis:
GOOGL’s current chart structure
Clear pattern formation (triangle / channel / flag / wedge — based on your chart)
Key support & resistance zones
Breakout / breakdown levels
Trend strength and momentum
Short-term price targets
Medium-term technical outlook
Risk levels & invalidation points
📈 Why This Matters
Alphabet (GOOGL) is showing a highly tradable technical setup, and understanding this chart pattern can help you spot the next big move before it happens.
Perfect for:
Day traders
Swing traders
Long-term technical investors
Anyone following large-cap tech stocks

ARM Holdings : First Long AttemptWhen I asked ChatGPT what Arm does for someone who is not in the chip industry or an electronics engineer, chatgpt gave a very nice answer:
"“A linguist who designed the world’s operating language.”
We're very close to the earnings date. (5 november 2025)
A target price between 200 and 230 is reasonable, but a sharp rise or fall is possible on earnings day.
Whether 230 should be maintained initially or whether a downgrade to the 200 target price will be determined then.
Arm Holdings has subsidiaries in China, making it a giant affected by the US-China trade war.
Reasonable position sizing should be made with this in mind.
We're above the 200 moving average on the 4-hour chart.
ATR % shows that relatively decreasing volatility can experience sharp increases in a short time.
(Not price , volatility )
First, let's try a target of 230 based on a Risk/Reward ratio of 3.
Parameters:
Stop-Loss : 137.5 ( or close under 137.5 )
Risk/Reward Ratio : 3.00
Take-Profit Level : 230.00
As I mentioned above, earnings or other developments can trigger a rapid stop-loss. Therefore, a small position is ideal for this trade.
Regards.

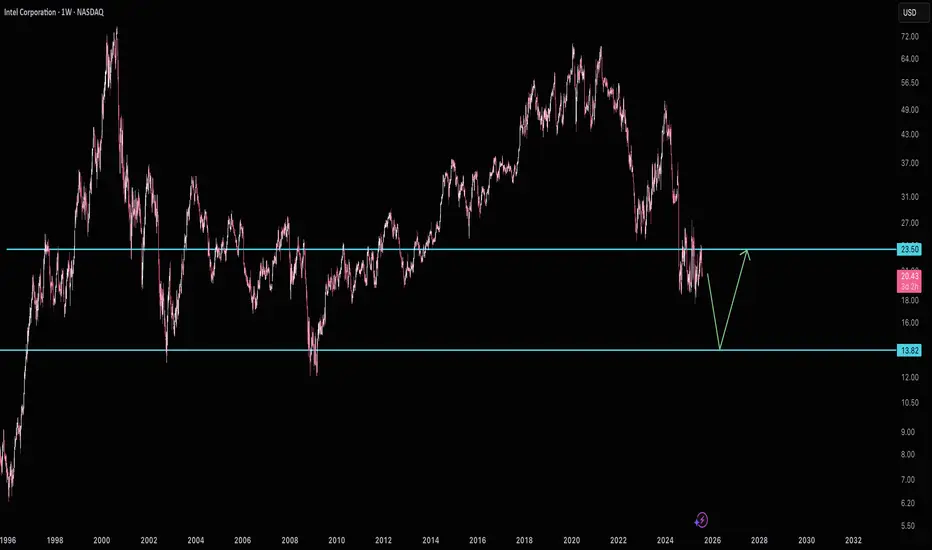
$INTC is set to go to $50I shared this when Intel was sitting at $23 and I am still bullish.
We pulled back to last quarterly opening price which is $34. I wouldnt be surprised if we bounce from here.
Anyway, sentiment is very positive on Intel so good luck.
First $50 then $100 in a long run.
NVDA: Undervalued AI Chip Leader Amid #YoungInvestorPortfolio?NVDA: Undervalued AI Chip Leader Amid #YoungInvestorPortfolio? $209 Target in Sight? 🚀
NVDA trades at $178.19 (+1.45%), undervalued with dominant AI GPU demand tying into Reddit young investor buzz on portfolios—analysts forecast average $209 target, 17% upside from robust data center growth, questioning if Blackwell rollout sparks breakout. 📈
**Fundamental Analysis**
EPS $3.51 ttm with revenue $165.218B and 71.55% YoY growth; P/E 52.56 reflects relative undervaluation in high-growth tech, DCF models indicate 15-20% intrinsic premium on AI expansions.
- **Positive:** Leading AI market share; strong cash flow generation.
- **Negative:** High capex demands; supply chain vulnerabilities.
**SWOT Analysis**
**Strengths:** Innovative GPU technology; data center dominance.
**Weaknesses:** Valuation sensitivity to growth slowdowns.
**Opportunities:** Expanding AI adoption; strategic partnerships.
**Threats:** Regulatory scrutiny; intensifying competition.
**Technical Analysis**
Chart in uptrend with strong volume support. Price: $178.19, VWAP $177.
Key indicators:
- RSI: 53 (neutral, upside potential).
- MACD: Positive signal line.
- Moving Averages: Above 50-day $170, 200-day $150 (bullish).
Support/Resistance: $170/$185. Patterns/Momentum: Ascending triangle targeting $200. 📈 Bullish.
**Scenarios and Risk Management**
- **Bullish:** AI demand surge to $200; DCA on pullbacks below $175 for averaged gains.
- **Bearish:** Chip shortages drop to $160.
- **Neutral:** Consolidates at $180 awaiting earnings.
Risk Tips: Stops at 5% below entry, limit to 2% portfolio, diversify tech exposure, DCA to handle volatility. ⚠️
**Conclusion/Outlook**
Bullish if AI trends accelerate. Watch Q3 earnings. Fits tech theme with #YoungInvestorPortfolio upside. Take? Comment!

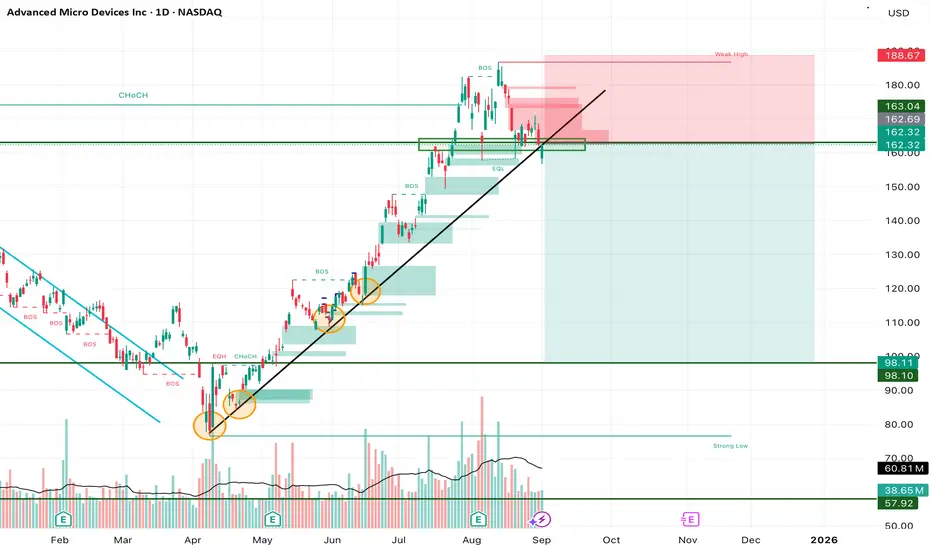
AMD Trendline Break – Short-Term Weakness, Long-Term AI Power PlAMD has broken below its long-standing ascending trendline, which has been respected multiple times since April. This is the first real sign of weakness after months of steady upside. The $162–165 zone, once strong support, is now acting as resistance. Unless bulls can reclaim this area quickly, AMD risks sliding lower toward $150 or even deeper levels.
Technical View:
• Trendline: Broken on daily chart → bearish short-term shift.
• Resistance: $162–165 (former support), $186–187 (weak high).
• Support Levels: $150 psychological, then $135–140 range.
• Indicators: RSI softening, MACD negative, short-term MAs leaning bearish.
Fundamental Backdrop:
Despite this technical weakness, AMD’s long-term story remains strong. HSBC recently upgraded AMD with a $200 price target, citing its MI350 AI chips that rival Nvidia’s Blackwell GPUs. The MI400, due in 2026, could expand GPU sales to $20B by 2028. Melius Research also raised its target to $175, highlighting AMD’s AI trajectory. Fundamentally, AMD is building momentum as a serious competitor in the AI chip race.
Trade Setup (Swing Idea):
• Entry Zone: $162–165 rejection area.
• Stop Loss: Above $188 (weak high).
• Take Profit 1: $150 (psychological level).
• Take Profit 2: $135–140 demand zone.
• Long-Term Accumulation: Any dip below $150 could be a strategic buy for investors with a $175–200 upside target in the AI cycle.
My View:
Short-term, the break of trendline favors bears — I’m watching for a retest of $162–165 to confirm resistance. Medium-term, I see pullback opportunities. Long-term, AMD’s AI roadmap gives conviction that dips should be accumulated rather than feared.
(Not Financial Advice) NASDAQ:AMD
Intel looks to want $13Intel looks to be waiting below $24 resistance for $13 support. I wouldn't short it at it's current price, but I would be patient and wait for $13 if you're looking to buy. Good luck!
Intel to 40. A bet on America's chip when the chips are downIntel is an interesting stock. I made a bet on it this week. It’s very cheap trading at book value. Lots of bad news has destroyed this stock while other chip stocks are at all time highs. With a new CEO running the show and investing in next gen chip production, I think he turns it around.
I think it's at 40 within a year, and makes new all time highs after that.

NVIDIA to $228If Nvidia were truly done for, why is it impossible to find their latest 5000 series GPUs?
Even if someone wanted to buy one, they simply can't.
The reason lies in Nvidia's commitment to fulfilling the soaring demand from AI data centers, which has left them unable to produce enough H100 and H200 models.
This situation also allows Nvidia to increase their profit margins significantly, capitalizing on the disparity between demand and the media frenzy surrounding them.
DeepSeek serves as a prime example of how out of touch mainstream media can be.
All DeepSeek did was replicate Chat GPT.
Training models requires substantial computing power. The panic surrounding Nvidia and other semiconductor companies is quite amusing; the demand for computing power is skyrocketing!
The gap between the reality of the AI mega-trend and the narrow focus of mainstream media is staggering! It's astonishingly out of touch! Just as out of touch as Cramer was when he declared META was done at $100, or when he thought Chat GPT would obliterate Google at $88.
Stock prices fluctuate between being overvalued and undervalued. While we have metrics like EGF and PE ratios to assess valuation, indicating that Nvidia is currently inexpensive, this doesn't guarantee it won't drop further. However, it is generally wiser to buy stocks when they are cheap rather than when they are costly.
The greater the deviation from the high then the greater the BUYING OPPORTUNITY being presented for the very best leading companies.
The key takeaway is that the deeper Nvidia falls during its corrections, the more advantageous it could be.
Those who are experiencing anxiety during these declines may find themselves selling at a loss, or for a marginal profit possibly around previous highs, while the stock has the potential to rise to $228 and beyond.
The potential for growth is significant; the $228 Fibonacci extension may not represent the peak. Attempting to predict a top for Nvidia could be misguided. Once it reaches $228, Nvidia might maintain a valuation similar to its current $130 level.


Quantum's SMCI Trading Levels 5/1/25Really don't understand this stock but retail really loves it. Seems like they want to push this to 36 for a possible run up into earnings before possibly dumping.
Nvidia : Should I be worried?Looking closely at Nvidia NASDAQ:NVDA , we can see that since March, the price has gravitated back to the Point of Control (POC) on the volume profile. From there, we’ve seen a solid reaction — up around 33%, after Nvidia had previously taken a sharp hit from its recent top.
In my view, it’s very possible that Wave 4 is now complete. It’s been a very complex, sideways consolidation, but that’s typical behavior for a fourth wave. Zoom out, and the bigger picture looks a lot cleaner — this whole range doesn’t seem nearly as messy on the higher timeframes.
That said, I’m not fully bullish yet. For me, $122 is the key level. Only once we break and hold above $122, I’ll shift into a more confidently bullish stance. Until then, it’s still possible we revisit the $80–$85 range, maybe even sweep the previous low. It doesn’t have to happen, but structurally, it’s still on the table.
Given the broader uncertainty — macroeconomic pressure, U.S.–China tensions, regulatory noise — I’m staying cautious. For now, I’m mainly focused on this from an 8-hour chart perspective. Until we get that confirmation above $122, I’m not rushing into any aggressive positions.

Nicest setup I’ve seen in a while-Not complicated; why make it?Tesla with perfect technically sound pattern
Five or six things coming together, including a perfect tag of the breakout line, a perfect tag of the long-term uptrend line a Bollinger band crash perfect tag of the Fibonacci .62
It’s like a perfect set up
Not very complicated; why make it complicated?

Confessions from the Desk: Nvidia is Up, I Am NotIt’s Friday, the sun is shining, and Nvidia is up. Unfortunately, I am not.
Nvidia sits smugly at $137.19, while my $140 call is officially DOA—dead on arrival, with no chance of resuscitation. I’d like to say I’m surprised, but at this point, it feels like the market is just personally messing with me.
To add insult to injury, my carefully curated basket of stocks has been bouncing around like a drunk day trader on margin. One minute, I think I’m up; the next, I’m refreshing my portfolio like a gambler waiting for a miracle. Spoiler alert: the miracle never comes.
Meanwhile, Nvidia has been making big boy moves—cutting its stake in Arm Holdings, taking a bite out of China’s WeRide, and ghosting Serve Robotics and SoundHound AI like a bad Tinder date. The result? Stocks are moving, headlines are flashing, and somewhere in a penthouse office, a hedge fund manager is smirking at my pain.
Let’s break it down:
Nvidia dumps 44% of Arm Holdings – Apparently, even they have commitment issues.
Exited Serve Robotics & SoundHound AI – Serve was rolling along nicely until, well... it wasn’t. SoundHound AI got the boot, too, and its shares fell 25%. Ouch.
Pumped 1.7 million shares into WeRide – WeRide stock shot up 76%. That’s cool, but guess who doesn’t own WeRide? This guy.
Also bet on AI cloud firm Nebius – Stock rose 8%. Lovely. Again, not in my portfolio.
Now, as Nvidia makes its AI master moves, I sit here staring at my screen, watching Serve Robotics—one of my few February winners—go completely sideways. That’s right, folks. Nvidia’s got a plan, but my portfolio? It’s just vibing.
But hey, it’s Friday, the sun is out, and at least I don’t own SoundHound AI. Small wins, right?
Happy Friday
