BTC vs. Gold similar sigularityThe daily bars from gold in the 1970s are similar to the weekly btc chart 2025.
Let´s see whats happpend after the actual gold run dropped and the money is turning back in digital gold btc.
Amazing times ahead.
Commodities

BTC/USDT | Next targets (READ THE CAPTION)After reaching 97,924 around 2 weeks ago, BTCUSDT has been dropping gradually, reaching as low as 86,074 and is now being traded at 88,200 after failing to go through the IFVG. I expect BTCUSDT to retest the IFVG.
Current targets for BTCUSDT: 88,250, 89,000, 89750 and 90,500.

Riding the XAUUSD Gold MONSTER Trade | What’s Next?In this video, we continue managing our XAUUSD Gold MONSTER trade 🥇💪. We’ve been seeing consistent success with every position we’ve opened recently 📈, and we break down our potential next move. Price is printing clear higher highs and higher lows on the 30-minute chart ⏱️📊, and we’re looking to capitalize on the next swing high and retracement.

AGQ projects to $405 SILVER 2X ETFYet to breakout from this W pattern.
What Is the W Pattern?
The W Pattern is a bullish harmonic pattern found on most stock charts at some point in time. Think of the letter “W” and imagine what this pattern might look like. It is characteristic of a bounce and retest of a key support area, commonly referred to as a double-bottom formation.
When this pattern forms on a chart, it usually indicates a trend reversal. Between the two bottoms, there is a level of resistance about halfway between the two tops. As a result, this is key, as it indicates a retest of the bottom support before rising higher into the newly formed uptrend.
Now you see it.
What do you think of this chart pattern and price targets?

Silver Inflation AdjustedHow much is the market willing to pay in real (inflation-adjusted) terms?
Roughly 20 times its historical real average ($3), which puts silver around $60 inflation-adjusted.
That means silver can still double from here—and do it faster than most expect.
Would I hold the entire position to those levels? No.
Would I let a small runner ride using house money? Yes.
Here are other Valuation metrics I have posted for your review.
That’s how you participate in upside without turning a trade into a belief system
If you enjoy the work: 👉 Drop a solid comment. Let’s push it to 6,000 and keep building a community grounded in raw truth, not hype.

USOIL M30 | Bullish Bounce Off Pullback SupportMomentum: Bullish
Price is currently above the ichimoku cloud.
Buy entry: 61.202
- Pullback support
- 61.8% Fib retracement
Stop Loss: 60.900
- Swing low support
Take Profit: 61.660
- Swing high resistance
High Risk Investment Warning
Stratos Markets Limited (fxcm.com/uk), Stratos Europe Ltd (fxcm.com/eu):
CFDs are complex instruments and come with a high risk of losing money rapidly due to leverage. 69% of retail investor accounts lose money when trading CFDs with this provider. You should consider whether you understand how CFDs work and whether you can afford to take the high risk of losing your money.
Stratos Global LLC (fxcm.com/en): Losses can exceed deposits.
Please be advised that the information presented on TradingView is provided to FXCM (‘Company’, ‘we’) by a third-party provider (‘TFA Global Pte Ltd’). Please be reminded that you are solely responsible for the trading decisions on your account. Any information and/or content is intended entirely for research, educational and informational purposes only and does not constitute investment or consultation advice or investment strategy. The information is not tailored to the investment needs of any specific person and therefore does not involve a consideration of any of the investment objectives, financial situation or needs of any viewer that may receive it. Past performance is not a reliable indicator of future results. Actual results may differ materially from those anticipated in forward-looking or past performance statements. We assume no liability as to the accuracy or completeness of any of the information and/or content provided herein and the Company cannot be held responsible for any omission, mistake nor for any loss or damage including without limitation to any loss of profit which may arise from reliance on any information supplied by TFA Global Pte Ltd.
Stratos Trading Pty. Limited (fxcm.com/au):
Trading FX/CFDs carries significant risks. FXCM AU (AFSL 309763), please read the Financial Services Guide, Product Disclosure Statement, Target Market Determination and Terms of Business at fxcm.com/au

Bullish bounce off?WTI Oil (XTI/USD) is falling towards the pivot, which has been identified as an overlap support and could bounce to the swing high resistance.
Pivot: 58.72
1st Support: 56.92
1st Resistance: 62.33
The opinions given above constitute general market commentary and do not constitute the opinion or advice of IC Markets or any form of personal or investment advice.
Any opinions, news, research, analyses, prices, other information, or links to third-party sites contained on this website are provided on an "as-is" basis, are intended to be informative only, and are not advice, a recommendation, research, a record of our trading prices, an offer of, or solicitation for, a transaction in any financial instrument and thus should not be treated as such. The information provided does not involve any specific investment objectives, financial situation, or needs of any specific person who may receive it. Please be aware that past performance is not a reliable indicator of future performance and/or results. Past performance or forward-looking scenarios based upon the reasonable beliefs of the third-party provider are not a guarantee of future performance. Actual results may differ materially from those anticipated in forward-looking or past performance statements. IC Markets makes no representation or warranty and assumes no liability as to the accuracy or completeness of the information provided, nor any loss arising from any investment based on a recommendation, forecast, or any information supplied by any third party

Silver Bells, Silver Bells, Silver all the way...Silver Bells, Silver Bells
Silver all the way
Oh what fun it is to ride
"in a One Horse" open sleigh
Silver Bells, Silver Bells
Silver all the way
Oh what fun it is to ride
"in a One Horse" open sleigh
Dashing through the snow
"In a One Horse" open sleigh
Over the hills we go
Laughing all the way
Bells on Bobtails ring
Making spirits bright
What fun it is to ride and sing
A Silver song tonight...
Happy Silver New Year!

ETHUSD (3H chart pattern ).ETHUSD (3H chart pattern ).
structure-based take.
What the chart shows
Strong impulsive drop → then a bearish descending channel (flag)
Price is below the Ichimoku cloud → bearish bias
Me’ve marked a breakdown attempt near the lower channel
This looks like a bear flag continuation, not a reversal
🎯 Downside Targets
🎯 Target 1 (near-term)
≈ 2,880 – 2,850
Recent reaction lows
First liquidity/support zone
Good partial profit area
🎯 Target 2 (main target)
≈ 2,700 – 2,680
Measured move of the flag (pole → breakdown)
Strong horizontal support
Matches my marked “target point” area
🎯 Target 3 (extension, if momentum is strong)
≈ 2,600
Previous demand zone
Psychological level
❌ Invalidation
If price breaks and holds above ~3,000–3,020
Or cleanly reclaims the channel + cloud → bearish setup fails
Summary
TP1: 2,880–2,850
TP2: 2,700–2,680
TP3: 2,600 (optional extension)
If my want, I can:
Tighten this into a scalp vs swing plan
Help with stop-loss placement
Or flip it and give bullish targets if it breaks up 📈

Follow the Fib LinesThese fib lines have been pretty reliable so far. We'd need a few significant pullbacks to reach $600. Be careful!

Gold Short Analysis – Bullish Trend & TradeGold remains bullish but corrective on the 1H chart, trading within a rising channel. Price has reacted from the 4960-4980 demand zone and is attempting to hold above the trendline support. As long as this zone holds the overall structure favors continuation higher though a brief pullback or consolidation is still possible before the next leg up.
Trade Plan:
Buy Zone: 4980 – 4960
Buy Trigger: Bullish rejection from the buy zone or a strong 1H/4H close above 5100
Targets: 5,100 → 5,165 → 5,210
Invalidation: Sustained break and close below 4,940
Fundamentally gold is supported by geopolitical uncertainty expectations of a more accommodative Fed stance and ongoing pressure on the US dollar and real yields. Any risk-off sentiment or weaker US data can further fuel upside while only a sharp USD rebound or hawkish surprises may slow the bullish momentum.
Note
Please risk management in trading is a Key so use your money accordingly. If you like the idea then please like and boost. Thank you and Good Luck!

Short on Silver CFDTVC:SILVER
Short on Silver
Technicals:
- oscillators like RSI and other on weekly and monthly timeframes are in extreme overbought territory, signaling an imminent need for a correction.
- large institutional players (Smart Money) typically begin taking profits at peaks, and the current environment presents an ideal window for this.
- price neared 3.618 on fibo (120$ per OZ), whereas asset prices rarely breakout this level.
- target 0.382 on fibo
- scenario invalidated if two bars close above 122.00
Fundamentals:
- the massive influx of retail investors and extreme market hype often precede a "flush out" of positions and a sharp collapse.
- commodity has shown anomalous growth, gaining about 150% in 2025 and another 40% in the first weeks of 2026; however, no rally can last forever.
- high asset prices will trigger an increase in secondary market supply (scrap/recycling), which will ultimately lead to a cooling of demand and price suppression.
⚠️ Signal - Sell ⬇️
✅ Entry Point - 112.75
🛑 SL - 122.34
🤑 TP - 84.62
⚙️ Risk/Reward - 1 : 3.2 👌
⌛️ Timeframe - 3 months 🗓
Good Luck! ☺️

Nat Gas: At The Moon - $6.. Now Next Stop $7?! NYMEX:NG1! NYMEX:NGG2026 Well it's been 4 days since my last post,
In my previous post I put forward a target of $6 for the prompt month NG contract . Now that we've blown through that target with a strong weekend open, the next question is where do we go from these historic Winter 2026 highs?? Many NG bears, would argue everything is already priced in, and there's no more gas left in the tank. However, if you look back a year from now, you'll realize we're finally at the bullish levels that were the BASE CASE for what we thought the supply & demand picture would like for 2026. This means we are finally at the expected value that markets had anticipated, 12 months ago, not that we are OVERVALUED.
Now BEARS are supposed be hibernating during the winter, but for some the recent historic rally has caused them to come out of hibernation. Well... there's a reason bears try to sleep through the winter.... it's because you don't chase penny's... when there's dollars to be made!! Right now you should only be taking tactical & quick shorts. This rally still has room to run, and you don't want to step in front of this Bull Train!!
From my charts & fundamental insights, I believe our next target for a session close will be $6.55 then $6.99, and that the February 2026 contract will expire above $6.
Looking at the charts for the front month, you can clearly see an upward directional channel that's now been established. The 30 minute ichi cloud has been providing upward support for NG. The 30min ichi wave targets are lower than the 1hour ichi cloud, and at first if you're looking at the lower time frame, it might seem that the near term movement is to the downside, below the lower upward channel support line & the next wave targets take us lower.
Howeverrrrrrr, if you look at the 1hour ichi, you can clearly see a support cloud above the upward channels bottom support. The next wave targets on the hourly seem to imply, that we can reach $6.55 to $6.65, and if those targets are smashed through next resistance is at $6.99 at the top of the upward channel.
The one hope for Bears, that may lead to consolidation & accumulation at or below the $6 level, before another move higher past $6.30 : "..analysts said potential reductions in LNG exports and pipeline deliveries to Mexico could help offset some of the tightening.
“Another potential wrinkle is how much LNG exports may decline as a result of Fern,” said Pat Rau, NGI’s senior vice president of research and analysis. “Back during Winter Storm Uri, LNG exports fell as well. That meant the overall supply/demand picture wasn’t just lost supply, there was some curtailed demand to help balance things a bit.””-NGI
Now, taking the above quote into consideration... I know you must be skeptical of a continuation of this breakout, but please refer to my previous post of why this rally had legs to begin with to take out the $6 level. But to reach the $7 level, I'll provide a few more quotes below, of why this historic Winter Freeze will keep the bull train going strong down the tracks.
A few fundamental insights on why the cold weather in the U.S. has been an ignition switch for NG prices for the weekend open, quotes provided from industry news source Natural Gas Intelligence:
“I think this storm has all the elements to make it a major risk on the level of Elliott and Uri,” said NGI’s Dan Spangler, senior director of analytics. “There’s going to be widespread cold in nearly all major producing areas, so there will definitely be a freeze-off impact.”
"Wood Mackenzie said Friday that average U.S. natural gas production month-to-date is down to 109.2 Bcf/d, “reflecting the impact of supply-related outages.” The consultancy’s freeze-off projections for the final two weeks of January jumped 9.5 Bcf on Thursday to 138.8 Bcf. That would be an all-time high if realized, breaking the 118.7 Bcf record set in February 2021 when Uri hit.”
"When Uri struck in mid-February 2021, LNG feed gas flows slowed to a trickle. Deliveries fell 87% to 1.3 Bcf/d from above 10 Bcf/d at the start of the month, Wood Mackenzie data show."
“Prices still took off back then, of course,” Rau said, “but the impact may have been even worse if LNG hadn’t served as a demand destruction vehicle to help counter some of the lost production.”
"Even so, Fern may not stress the Texas power grid to the same degree as Uri, according to RBN Energy LLC analyst John Abeln.
The expected zone of extreme cold during Fern “does not extend as far south across Texas” as it did during Uri, Abeln said, and the storm is forecast to move through the state much more quickly. Temperatures in Dallas are expected to rise above freezing by Tuesday, compared with a much longer stretch below freezing during Uri.
“The sustained deep freeze that exhausted storage and led to equipment failures is likely to be much less severe this time around,” Abeln said.
If deep snow materializes, frigid temperatures linger and production freeze-offs mount, February natural gas “could rally to the $7.500 area” in a highly bullish scenario, Yawger added.
Exceptional storage withdrawals are in the cards as well, with most analysts now looking for a pull far north of 300 Bcf for the last week of the month.
“The chatter around the natural gas space is a storage draw of over 350 Bcf or greater,” Yawger said. “There have only ever been four draws of 300 Bcf or greater in the history” of federal storage data.

XAUUSD 1H (OANDA): Bull TrendXAUUSD 1H (OANDA): Bull Trend, But Price Is Trapped Under a Weak High – Expect a Sweep or a Deeper Rotation
Gold remains in a strong 1H uptrend overall, but the latest price action is flashing a key short-term warning: the market is consolidating under a marked weak high after a sharp push up. On your chart, the top box shows repeated reactions, multiple CHoCH prints inside the range, and a clear liquidity structure (equal highs/equal lows) that often precedes either:
a liquidity sweep above the weak high to trap breakout buyers, then a selloff, or
a clean breakout with acceptance that continues the bullish trend.
This is a classic “decision zone” where you should trade the edges, not the middle.
Market Structure and Price Behavior
Macro bias (1H): still bullish (the staircase advance with BOS legs is intact).
Current phase: distribution-like consolidation near the highs.
Key observation: the market is “advertising” the weak high. Weak highs are frequently swept before the real move happens.
If price fails to hold the current top-range support, the next move is likely a rotation into the nearest demand bands marked on the chart.
Key Resistance and Support Levels (From the Chart)
Resistance
5,090–5,105: current supply lid / top-range pressure area.
Weak High zone: the marked weak high above the range (primary liquidity target).
5,120: next major upside magnet if a breakout is accepted.
Support
5,060–5,040: immediate pullback support (reaction zone after the sell spike).
5,000–4,980: psychological + structural support (key intraday defense).
4,920–4,900: first highlighted demand band (strong reaction zone if breakdown confirms).
4,820–4,800: second demand band (deeper pullback target).
4,660–4,620: broader base support (trend would weaken significantly if price returns here).
Fibonacci Roadmap (Best Dip-Buy Zones)
Anchor Fibonacci from the latest impulse swing low (around the last major push before the top consolidation) to the recent high:
0.382 typically aligns near the first pullback pocket (often around the 5,040–5,000 region here).
0.5 aligns with the next demand band (commonly around 4,920–4,900).
0.618 often overlaps deeper demand (around 4,820–4,800).
This creates a clean hierarchy:
Hold above 5,000 = shallow correction, trend continuation remains favored.
Lose 5,000 = rotation risk increases toward 4,920 and potentially 4,820.
EMA and RSI Filters (Quick Confirmation Rules)
EMA (use EMA20 and EMA50 on 1H)
Bullish continuation: price holds above EMA20 and EMA20 stays above EMA50.
Distribution warning: repeated 1H closes below EMA20 while trapped under resistance often leads to a flush.
RSI (14)
Bull control: RSI holds above 50 during consolidation.
Breakout strength: RSI pushes above 60 with a 1H close above resistance.
Breakdown risk: RSI slips below 45 while price loses the range floor.
Trading Plan (Clear Entry, SL, TP)
Scenario 1: Buy Breakout Only With Acceptance (Continuation Setup)
Trigger
1H candle closes above the range top (above the current supply lid) and the next candle does not instantly reject.
Entry
Buy on a retest of the broken level (range top becomes support).
Stop loss
SL below the retest swing low (or below the range top if you want a tighter invalidation).
Take profit
TP1: retest of the weak high zone
TP2: extension toward 5,120 if momentum remains strong (trail with EMA20)
Best practice
Avoid buying a single wick above the range. Acceptance matters more than the spike.
Scenario 2: Liquidity Sweep Above Weak High Then Sell (High-Probability Reversal Pattern)
Trigger
Price spikes above the weak high but closes back inside the range with a strong rejection candle.
Entry
Sell after the rejection close, ideally on a lower-timeframe pullback toward the sweep zone.
Stop loss
SL above the sweep high.
Take profit
TP1: 5,060–5,040
TP2: 5,000–4,980
TP3: 4,920–4,900 if 5,000 breaks with confirmation
This aligns closely with the projected path drawn on your chart.
Scenario 3: Sell Breakdown of Range Support (Rotation Into Demand)
Trigger
1H close below the range floor (the lower boundary of the top box) and retest fails.
Entry
Sell the retest rejection.
Stop loss
SL back inside the range.
Take profit
TP1: 5,000–4,980
TP2: 4,920–4,900 demand band
TP3: 4,820–4,800 if selling pressure expands
Scenario 4: Buy the Dip at Demand (Safer Trend-Continuation Approach)
Trigger
Price reaches a marked demand band and prints rejection (strong lower wick, engulfing, or impulsive reclaim).
Entry zones
First buy zone: 5,000–4,980
Second buy zone: 4,920–4,900
Deep buy zone: 4,820–4,800
Stop loss
Place SL below the demand band low (avoid placing it too tight; gold often hunts stops around round numbers).
Take profit
TP1: back to 5,040–5,060
TP2: range top / weak high zone
Execution Notes (Avoid the Chop)
Do not trade the middle of the range. The range is designed to trap both sides.
The best decisions happen at:
the range top / weak high (sweep or breakout)
the range floor (breakdown confirmation)
the demand bands (structured dip buys)
Summary
XAUUSD 1H is still bullish structurally, but the current consolidation under a weak high increases the probability of a liquidity sweep and a rotation lower before continuation. The highest-quality setups are:
buy only after breakout acceptance,
sell a confirmed weak-high sweep,
or wait to buy the dip at 5,000–4,980 and the demand bands at 4,920–4,900 / 4,820–4,800.

WTI CrudeVolatility has been moderate with occasional swings tied to macro headlines (e.g., inventory data and geopolitical cues), but no persistent trend acceleration. Range contraction has defined much of the recent sessions.
WTI pricing has been influenced by:
Geopolitical risk repricing, including geopolitical headlines that caused short-term spikes and retracements.
U.S. crude inventory builds and supply concerns, exerting downward pressures at times.
Mixed supply/demand signals and market focus on physical fundamentals ahead of major inventory reports have kept traders cautious.
Over this ten-day window, WTI has failed to sustain a strong directional trend, instead trading within a structurally narrow band. The market remains range-oriented.
Like & Share...

Gold ATH Squeeze — Watch the Demand ReclaimGold is trading around 5,074 after a strong impulse into the ATH band (~5,110). What matters here is structure: price is no longer trending cleanly it’s rotating between the ATH ceiling and a clearly defined demand shelf (~5,000–5,020). That’s not weakness by default. This is exactly how markets behave before the next expansion: they shake liquidity inside a box, punish late chasers, then choose direction. upside path to ~5,199 is plausible, but it’s not “guaranteed.” The market must confirm by holding demand and reclaiming ATH.
ATH / supply cap: ~5,110 → Break + hold above = continuation signal.
Demand zone (must hold): ~5,000–5,020 → Lose this = bullish plan paused / deeper retrace opens.
EMA98 (trend support): ~4,943 → Next magnet if demand fails.
Lower demand: ~4,900–4,920 → Final “buyers must show up” zone for trend to stay healthy.
Trade plan (rule-based)
✅ Bull continuation (only after confirmation)
Trigger: Price holds 5,000–5,020 and then reclaims 5,110 with a clean close/acceptance.
Entry idea: On the reclaim retest (ATH flips to support).
Targets:
T1: 5,110 → quick scale if momentum stalls
T2: 5,199 (your projected next target)
Invalidation: Sustained acceptance back under 5,000.
⚠️ Pullback scenario (if demand breaks)
Trigger: Breakdown below 5,000 + failed reclaim (bearish retest).
Downside magnets:
EMA98 ~4,943
4,900–4,920 demand
Execution note: if you’re long-biased, this is where you stop predicting and start waiting for a real reclaim signal again.
Bottom line
This is a high-probability setup zone, not a certainty.
Above 5,110 = expansion mode (5,199 in play). Below 5,000 = pullback mode (EMA98 / lower demand).

XAUUSD (Gold) – 30M Ascending Structure & Breakout WatchPrice is trading in an ascending channel, holding above the EMA and rising trendline. Market is currently testing a key resistance zone, where a breakout could open upside targets, while rejection may lead to a pullback toward support.
Key Levels:
Resistance: 4985 – 5000
Support: 4890 – 4905
Upside Target: 5050 – 5070
Bullish bias remains valid above the trendline. Wait for a confirmed breakout or pullback reaction before entries. Risk management is essential.

GBPUSD: consolidation at 1.37🛠 Technical Analysis: On the H1 chart, GBPUSD remains bullish after a strong impulse move and is now compressing beneath the marked resistance zone around 1.37000. Price is holding inside a rising structure, with the steep trend channel still intact and suggesting continuation if buyers defend the pullbacks. The moving averages are angled higher and sit below price, reinforcing the upward bias. A clean push above the resistance area opens the way toward the next upside target, while a drop back below the consolidation base would signal a deeper retracement into the nearest support zone.
———————————————
❗️ Trade Parameters (BUY)
———————————————
➡️ Entry Point: 1.36872
🎯 Take Profit: 1.37532
🔴 Stop Loss: 1.36438
⚠️ Disclaimer: This is a potential trade idea based on current analysis; market conditions and price direction are subject to change based on news factors and volatility.

DeGRAM | GOLD is testing the $5110📊 Technical Analysis
● XAU/USD remains inside a rising channel but shows exhaustion after a strong impulsive leg into the 5,110 resistance, where price failed to hold above the upper boundary.
● The highlighted gap near the channel midline and a bearish rejection signal increased pullback risk toward the rising support zone at 4,970–4,950.
💡 Fundamental Analysis
● Sustained USD strength and elevated US bond yields reduce demand for non-yielding assets, supporting a short-term corrective move in gold.
✨ Summary
● Price is overstretched at channel resistance.
● A corrective decline toward 4,970–4,950 is favored while below 5,110.
-------------------
Share your opinion in the comments and support the idea with a like. Thanks for your support!

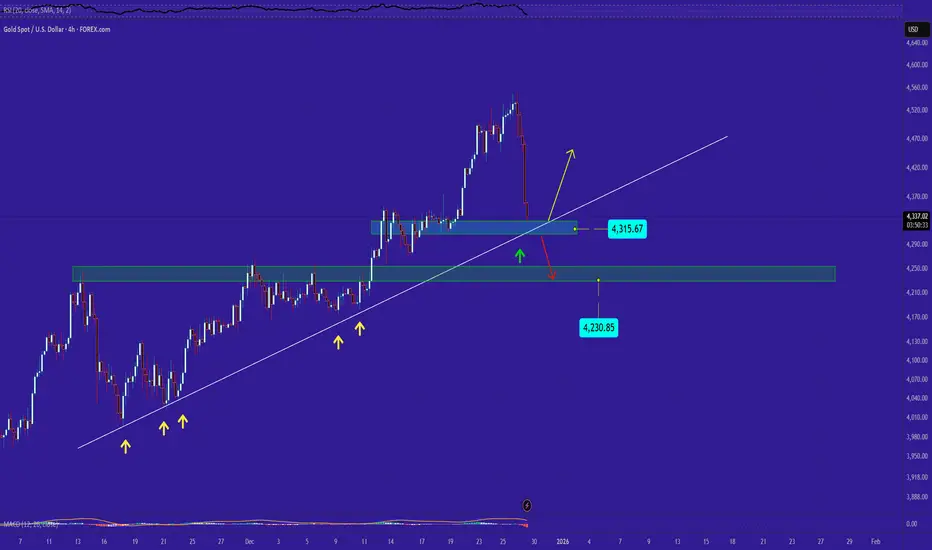
GOLD's SituationFor this drop, we can consider two support levels: one dynamic and one static. I’m hoping the dynamic support line can stop the decline. If not, and the dynamic support is broken, the price may fall down to around 4230.
Alert for Crypto vs Silver Swing TradeCrypto and Silver are popular within individual swing traders.
Sell crypto buy silver was a good move. I think it is time to swing back.
Sell silver and buy crypto. No leverage, not yet!

I am now Long PUTS IN SLV and Silver 2027 lateThe wave structure is now complete as into the cycle high and fib relationship The US$ is about to Bottom in wave B low we should then see a huge rally in DXY and a sharp decline in all metals and the sp 500 is in wave c up in wave 5 of the diagonal 5th wave all coming into the 5 spirals due 2/9 event best of trades WAVETIMER

XAG/USD: Assessing Distribution Phase and Potential Trendline BrSilver (XAG/USD) ki halia price action 15-minute timeframe par aik mazzboot "Ascending Channel" ke andar trade karne ke baad ab aik critical junction par khari hai. Price ne channel ki oopri satah (resistance) se mazzboot rejection li hai, jo ke market mein buyers ki thakawat (exhaustion) ko zahir karti hai. Hum ab aik "Distribution Phase" dekh rahe hain jahan sellers control dobara haasil karne ki koshish mein hain.
Key Technical Observations:
Channel Exhaustion: Price action ne channel ki upper boundary ko multiple times test kiya hai lekin wahan hold karne mein nakam rahi hai. Ye aik classic sign hai ke market ab ooper jane ke liye mazeed liquidity dhoond rahi hai.
Structure Shift: Black path se wazeh hota hai ke hum aik "Lower High" formation ki tawaqqo kar rahe hain. Agar price channel ki lower trendline ko decisively break karti hai, to ye market structure ka bullish se bearish mein tabdeeli (Change of Character) ka signal hoga.
Liquidity Targets: Niche ki taraf hamara pehla target 106.000 ka level hai, jo aik intermediate base hai. Agar bearish momentum barkaraar rehta hai, to price mazeed niche 102.500 ke major support area tak gir sakti hai taaki purani liquidity ko clear kiya ja sakay.
Risk Parameters: Ye bearish view tab tak valid hai jab tak Silver 112.500 ke halia peak ke niche trade kar raha hai. Is level se ooper ki closing is setup ko invalidate kar degi aur trend continuation ka ishara degi.
