XAUUSD: Bullish Push to 4333?As the previous analysis worked exactly as predicted, FX:XAUUSD is eyeing a bullish continuation on the 4-hour chart , with price forming higher lows along an upward trendline, converging with a potential entry zone that could fuel upside momentum if buyers hold amid recent volatility. This setup indicates a rally opportunity post-correction, targeting higher resistance levels with approximately 1:3 risk-reward.🔥
Entry between 4245–4255 for a long position. Target at 4333 . Set a stop loss at a close below the upward trendline or below 4230, yielding a risk-reward ratio of approximately 1:3 . Monitor for confirmation via a bullish candle close above entry with rising volume, leveraging gold's channel dynamics.🌟
Fundamentally , gold is consolidating around $4,278 in mid-December 2025, with key USD events this week potentially influencing direction through inflation and employment data. On December 16 at 8:30 AM ET, the Employment Situation report (including Non-Farm Payrolls with consensus 119K and Unemployment Rate at 4.4%) could weaken the USD if softer-than-expected, boosting gold's appeal. December 17 features Retail Sales at 8:30 AM ET, where strong consumer spending might support USD but misses could favor gold. On December 18 at 8:30 AM ET, CPI (forecast 324.9) and Core Inflation Rate YoY (forecast 3%) are critical; cooler readings may signal Fed easing, pressuring USD lower. Also on December 18, Jobless Claims at 8:30 AM ET and Fed Balance Sheet at 4:30 PM ET could add volatility. December 19 brings Personal Income and Outlays at 8:30 AM ET, including PCE inflation, the Fed's preferred gauge—soft data here might further undermine USD strength. 💡
📝 Trade Setup
🎯 Entry (Long):
4245 – 4255
(Entries in this zone are valid with proper risk & capital management.)
🎯 Target:
• 4333
❌ Stop Loss:
• Close below the upward trendline
or
• Hard invalidation below 4230
⚖️ Risk-to-Reward:
• ~ 1:3
💡 Your view?
Will AUDCAD reject this resistance for a clean pullback toward 0.90745 — or will CAD weakness invalidate the setup and push price higher? 👇
Commodities

WTI Crude Oil Consolidates at Key Support, Ukraine in FocusWTI Crude Oil is trading near a significant horizontal support level around $55 amidst hopes of a Ukraine peace deal. Price action is currently consolidating, and several technical indicators provide insight into the market’s tone:
Moving Averages: The shorter-term moving average (blue) remains below the longer-term moving average (red), reflecting a broader bearish bias. However, recent candles suggest sideways movement, hinting at potential stabilization.
MACD: The MACD lines are converging, and the histogram is shrinking, signaling that bearish momentum is weakening. This could precede a trend shift if confirmed by price action.
RSI: The RSI sits near the neutral zone around 50, indicating neither overbought nor oversold conditions. This reinforces the consolidation narrative rather than a strong directional trend.
Key Observation: Holding above the support zone is critical for WTI. A decisive break below could extend the bearish structure, while a rebound supported by improving MACD signals might suggest the start of a recovery phase.
-MW

GBP/JPY |GBPJPY Likely to Fill Liquidity Gap Before Another DropBy analyzing the #GBPJPY chart on the 4 hour timeframe, we can see that price is currently trading around 207.47. The recent sharp drop created a large liquidity gap, and I expect this zone to be filled soon before a bigger downside move starts.
The key supply zone sits between 208.13 and 208.57. Make sure to watch how price reacts to this area. All other important zones and levels are already marked on the chart.
Please support me with your likes and comments to motivate me to share more analysis with you and share your opinion about the possible trend of this chart with me !
Best Regards , Arman Shaban

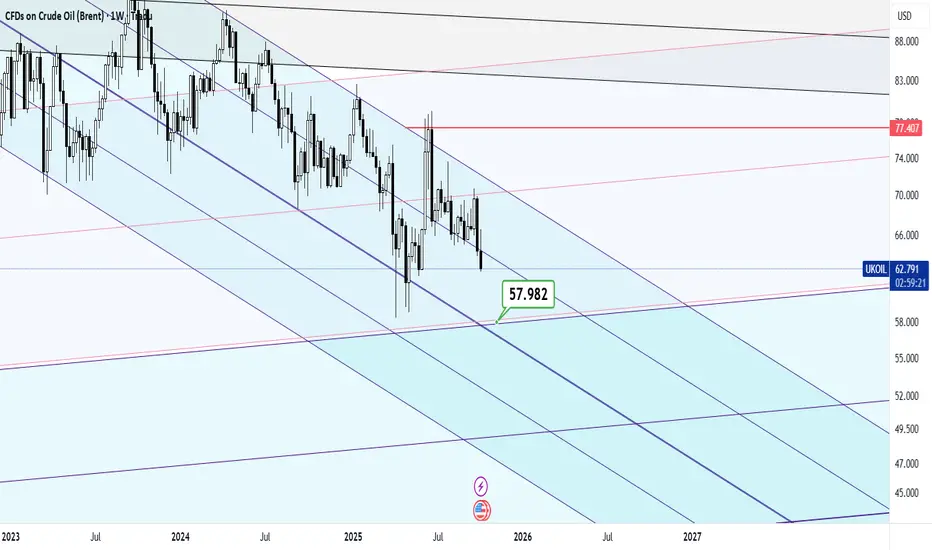
Zayed Al-Wasafi's excessive interest in targeting a price of $58Whatever we see from oil in the short term is considered a unique buying opportunity for astronomical and unprecedented goals in history, but for now we should think about the immediate goal!
Good luck
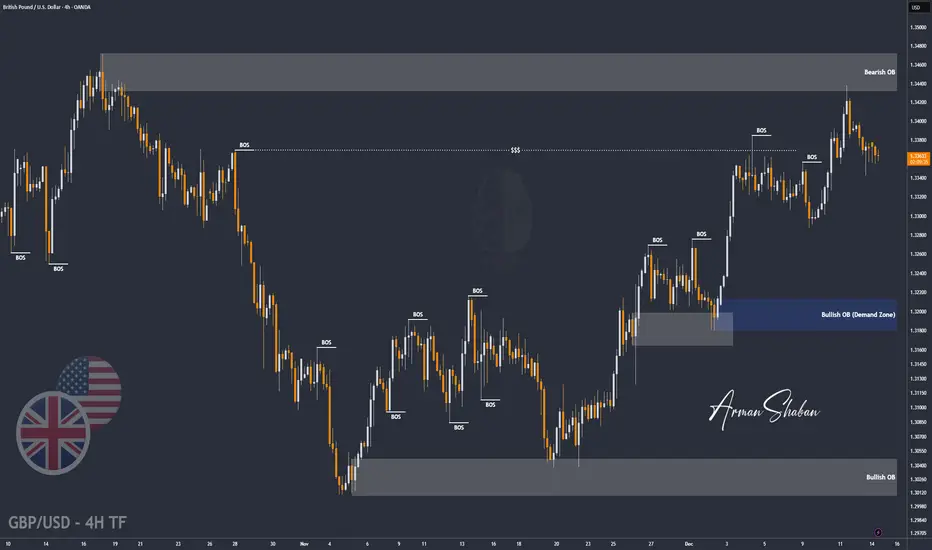
GBP/USD | Testing Supply Zone and Setting Up for Possible Drop!By analyzing the #GBPUSD chart on the 4 hour timeframe, we can see that after the initial drop, price bounced and pushed back into the 1.344 supply zone. Once it hit that level, strong selling pressure kicked in and GBPUSD dropped to 1.334. Right now the pair is trading around 1.336.
If price can hold below 1.33790, we can expect a deeper decline. If it fails to stay below that level, we may first see a pullback toward 1.340 before any major drop happens.
Please support me with your likes and comments to motivate me to share more analysis with you and share your opinion about the possible trend of this chart with me !
Best Regards , Arman Shaban
SILVER Is Very Bearish! Short!
Take a look at our analysis for SILVER.
Time Frame: 1h
Current Trend: Bearish
Sentiment: Overbought (based on 7-period RSI)
Forecast: Bearish
The market is on a crucial zone of supply 6,339.4.
The above-mentioned technicals clearly indicate the dominance of sellers on the market. I recommend shorting the instrument, aiming at 6,221.8 level.
P.S
We determine oversold/overbought condition with RSI indicator.
When it drops below 30 - the market is considered to be oversold.
When it bounces above 70 - the market is considered to be overbought.
Like and subscribe and comment my ideas if you enjoy them!


CAD/JPY – H4 Analysis ...CAD/JPY – H4 Analysis (As per My chart)
Market Structure
Overall trend was bullish, price respected the ascending trendline + Ichimoku cloud.
Price has formed a clear Double Top near the highs.
Recent candles show breakdown below momentum, signaling a bearish correction.
---
📉 Sell Scenario
Sell Zone: 112.30 – 112.80
🎯 Targets
Target 1: 109.50
Target 2: 106.50
---
❌ Invalidation
A strong H4 close above 113.80 will invalidate the bearish setup.
---
📌 Summary
Pattern: Double Top
Bias: SELL
Expectation: Price to move down toward lower demand zones

XAGUSD (Silver) 1H chart patterns...XAGUSD (Silver) – Target Levels (Based on my Chart)
From the image, price is moving inside an ascending (bullish) channel and is currently near the upper zone / high point of the market. The marked arrows show a possible correction.
🎯 Downside Target Levels
If price gets rejected from the upper channel:
1. First Target: 57.00 – 56.80
Mid / lower support zone of the channel
Likely first pullback area
2. Second Target: 51.50 – 51.00
Major demand & strong support
Channel bottom / deeper correction target
📌 Key Notes
Overall trend is bullish, but price looks overextended
Shorts are valid only after rejection / confirmation
If price breaks and holds above the upper channel, then correction targets are invalid
If my want, tell me:
Buy or Sell setup?
Scalping or Swing trade?
Timeframe (1H, 4H, Daily)?

GBP/JPY – H2 Analysis..GBP/JPY – H2 Analysis (According to My chart)
Market Structure
Price was in a strong uptrend, moving above the trendline and Ichimoku cloud.
Recently price broke below the ascending trendline and entered cloud resistance.
This shows a bearish correction / trend weakness.
---
📉 Sell Scenario (As per My markings)
Sell Zone: 207.50 – 208.20
🎯 Targets
Target 1: 205.50
Target 2: 203.50
---
❌ Invalidation
A strong H2 close above 208.80 will invalidate the sell setup.
---
📌 Summary
Previous Trend: Bullish
Current Bias: Bearish correction
Expectation: Price to drop toward lower demand zones

USD/JPY – H4 Analysis...USD/JPY – H4 Analysis (As per my chart)
Market Structure
Price has broken below the ascending trendline.
Trading below the Ichimoku cloud, showing bearish control.
Recent pullbacks are weak → continuation to the downside is likely.
---
📉 Sell Scenario
Sell Zone: 154.80 – 155.60
🎯 Targets
Target 1: 152.00
Target 2: 149.50
---
❌ Invalidation
A strong H4 close above 156.80 will invalidate this bearish setup.
---
📌 Summary
Trend Shift: Bullish → Bearish
Bias: SELL
Expectation: Continuation toward lower demand zones

XAU/USD (Gold) – H2 Analysis...XAU/USD (Gold) – H2 Analysis (According to my chart)
Market Structure
Overall trend is bullish, but price is currently facing strong resistance / supply zone at the top.
Price has shown rejection from the supply area and is moving back toward the Ichimoku cloud support.
This indicates a bearish correction within the larger uptrend.
---
📉 Sell Scenario (As marked on My chart)
Sell Zone: 4310 – 4340
🎯 Targets
Target 1: 4265 – 4270
Target 2: 4160 – 4180
---
❌ Invalidation
A strong close above 4360 will invalidate this sell setup.
---
📌 Summary
Trend: Bullish (higher timeframe)
Current Move: Bearish correction
Expectation: Price to drop toward marked demand zones before next continuation

XAU/USD | Gold Fills the FVG and Prepares for the Next Move!By analyzing the #Gold chart on the 4 hour timeframe, we can see that after pushing up to $4353, price corrected sharply and dropped to $4257. This decline created a large liquidity void, and today gold completely filled that FVG with a strong bullish move, reaching as high as $4350.
Right now gold is trading around $4328 and I expect some short term correction from this area. But the bigger picture is still bullish and once this pullback is done, I expect gold to continue higher toward $4380 and then $4400. This analysis will be updated soon.
Please support me with your likes and comments to motivate me to share more analysis with you and share your opinion about the possible trend of this chart with me !
Best Regards , Arman Shaban

GOLD - Retest of key support ahead of newsFX:XAUUSD is falling during the Asian session, retreating from $4,350 — its highest level since late October — amid optimism over a peace agreement between Russia and Ukraine and ahead of US employment data.
Trump's statements about the approaching peace agreement are reducing demand for safe-haven assets. The probability of a Fed rate cut in January is about 77%, with two easing measures expected in 2026. Expectations of a dovish Fed chair appointment continue to put pressure on the dollar.
• Today, October NFP data will be released, which may confirm the weakening of the labor market
• On Thursday, US inflation data will be released
The current decline looks like a correction and profit-taking. The uptrend remains intact unless employment data exceeds expectations. Any further decline could be seen as a buying opportunity
Resistance levels: 4292, 4317
Support levels: 4265, 4255
If the news is positive, which will only reinforce expectations of an aggressive rate cut, gold's growth after retesting key support may continue. Otherwise, the correction may continue. However, the 4265-4255 area plays an important role and needs to be monitored.
Best regards, R. Linda!

Gold Reload Zone at 4,245 as USD Weakens!!Hey Traders,
In today’s trading session, we are monitoring XAUUSD for a potential buying opportunity around the 4,245 zone. Gold remains in a well-defined uptrend and is currently undergoing a healthy corrective phase, pulling back toward the 4,245 support area, which aligns with the broader trend structure.
Technical context:
The bullish structure remains intact, with price respecting higher highs and higher lows. This retracement toward trend support offers a potential continuation setup within the prevailing uptrend.
Macro & Dollar backdrop:
The US Dollar remains under pressure following the recent 25bps Fed rate cut, alongside signs of cooling US labor market data. With balance sheet expansion resuming and markets increasingly sensitive to incoming employment figures, the risk remains skewed toward further USD weakness. Any additional deterioration in labor data could accelerate expectations for another rate cut, reinforcing the bearish Dollar narrative.
Gold correlation:
A softer USD environment continues to support Gold via its negative correlation with the Dollar, keeping the upside bias intact as long as trend support holds.
Watching price behavior closely around 4,245 for confirmation of renewed buying interest.
Trade safe,
Joe

Bearish Scenario - USOILHello traders,
the USOIL has reached the support level (56.802 – 56.332).
Let’s look for a bearish scenario :
If the market breaks and closes below this support ,
we could see a bearish continuation.
🎯 TARGET: 54.000

EUR/USD | Challenging the FVG! (READ THE CAPTION)Good afternoon folks.
As you can see, EURUSD managed to break away from the supply zone, only to be rejected by the high of the FVG at 1.17950.
Currently, EURUSD is being traded below the lower half of FVG zone, and it is struggling to break through it.
At the moment, I expect EURUSD to be completely rejected by the FVG, dropping below the low of the FVG at 1.17760 and try again later. A drop to the high of the supply zone at 1.17590 is possible.
Watch closely as EURUSD tries to challenge the FVG.

XAUUSD 📊 GOLD UPDATE — Key Levels in Focus! 🔥
Gold is reacting from a significant zone, and current structure suggests a possible move toward the upside if price holds above support. Market reaction near these levels will define the next direction.
📌 Trade Levels:
• 🔓 Entry: 4277
• ❌ Stop Loss: 4244
• 🎯 Target: 4301
Price behavior near resistance will be important — confirmation and risk management matter.
💬 What’s your bias from here — continuation or pullback?
👍 Like & comment to support the idea and share your perspective.
⚠️ Disclaimer: This analysis reflects personal market observation and is shared for informational purposes only.

Precious metals lead the way: silver, platinum, and palladium!On December 2, FreshForex analysts had already highlighted the high potential of the metals market — and the market quickly confirmed this scenario with a sharp rise in prices: silver (XAGUSD) +12.89%, platinum (XPTUSD) +9.03%, and palladium (XPDUSD) +8.75% . Our metals forecasts not only played out — this segment confidently outperformed many other asset classes. Investors are moving away from the dollar and government bonds into real assets amid expectations of U.S. rate cuts. Prices are also being fueled by news of supply deficits and rising industrial demand for these metals. Against this backdrop, interest in precious metals is growing among both retail and large institutional investors.
Growth Drivers:
Silver (XAGUSD) is rising due to a supply shortage : demand from the solar energy sector and electronics is increasing, while inventories are declining. For investors, silver is also a more affordable alternative to gold .
Palladium (XPDUSD) is supported by limited supply and geopolitical risks : the market depends heavily on Russia and South Africa, while demand for palladium in automotive catalysts and electronics remains strong. As a result, even rumors of sanctions or export restrictions can sharply push prices higher.
Platinum (XPTUSD) is gaining value amid mining disruptions in South Africa , which remains a key global supplier. At the same time, demand from industry and hydrogen-related projects keeps the market tight, meaning any news from the mining sector is quickly reflected in prices.
If a dovish Fed policy and a weak dollar persist, interest in precious metals as a “hedge against currency devaluation” is likely to remain high. Silver receives an additional boost from the “green” agenda — the development of solar energy and electric vehicles, where it is used in virtually every component.
Platinum and palladium continue to depend on a limited number of supplier countries, making any disruptions in mining or logistics powerful price triggers. In this environment, even minor news about production cuts or new restrictions can spark another wave of growth. As long as the market sees a supply deficit and no quick way to significantly increase output, the bullish scenario retains strong potential.
FreshForex analysts note that in the coming months, the performance of silver, platinum, and palladium will largely depend on the Fed’s rate-cut trajectory, the pace of the global “green” transition, and mining-related news from key regions — primarily South Africa and Russia. Investors are advised to maintain strict risk management and closely monitor the macroeconomic calendar.

Gold 1H – NFP in Control: 4355 Cap or 4260 Hold?🟡 XAUUSD – Intraday Smart Money Plan | by Ryan_TitanTrader (16/12)
📈 Market Context
Gold is trading inside a high-volatility liquidity environment as markets digest the NFP Preview: Rate Path Divergence & Implications for DXY and Gold.
With the upcoming U.S. labor data set to shape expectations for the Fed’s 2026 rate path, USD flows remain unstable. Any surprise in employment or wage components could trigger sharp repricing in rate-cut expectations, directly impacting gold through DXY volatility.
In this context, institutions are unlikely to commit direction early. Instead, liquidity engineering and stop-hunts around key premium/discount zones are favored ahead of true displacement.
🔎 Technical Framework – Smart Money Structure (1H)
Current Phase: Post-expansion, now rotating inside a rising channel and pausing near equilibrium
Key Idea: Expect a liquidity sweep into premium (4353–4355) or discount (4262–4260) before the next impulsive move
Structural Notes:
• Prior BOS confirms bullish higher-timeframe context
• Recent pullback signals profit-taking, not full reversal
• Equal highs above 4350 and sell-side liquidity below 4260 are clearly exposed
Liquidity Zones & Triggers:
• 🔴 SELL GOLD 4353 – 4355 | SL 4363
• 🟢 BUY GOLD 4262 – 4260 | SL 4272
Institutional Flow Expectation:
sweep → MSS / CHoCH → BOS → displacement → FVG / OB retest → expansion
🎯 Execution Rules (matching your exact zones)
🔴 SELL GOLD 4353 – 4355 | SL 4363
Rules:
✔ Liquidity sweep above recent highs into premium
✔ Bearish MSS / CHoCH on M5–M15
✔ Downside BOS with strong bearish displacement
✔ Entry via bearish FVG refill or refined supply OB
Targets:
1. 4325
2. 4300
3. 4285 – extension if momentum accelerates
🟢 BUY GOLD 4262 – 4260 | SL 4272
Rules:
✔ Liquidity grab below equal lows / channel support
✔ Bullish MSS / CHoCH confirms demand takeover
✔ Upside BOS with impulsive displacement
✔ Entry via bullish FVG fill or demand OB retest
Targets:
1. 4280
2. 4310
3. 4350 – extension if USD weakens post-data
⚠️ Risk Notes
• NFP-related positioning can cause false breaks — wait for structure, not the first spike
• Avoid trades without clear MSS + BOS confirmation
• Expect spreads and volatility to expand during U.S. sessions
• Reduce risk if entering close to news releases
📍 Summary
Today’s gold narrative is driven by NFP-led rate path uncertainty:
• A sweep into 4355 may invite bearish structure back toward 4300–4285
or
• A liquidity grab near 4260 could reload bullish flow toward 4310–4350
Let structure confirm — Smart Money reacts, retail anticipates. ⚡️
📌 Follow @Ryan_TitanTrader for daily Smart Money gold breakdowns.

OIL (WTI) | Bearish Below 57.41 Amid Oversupply RisksOIL (WTI) – Technical Overview
Oil prices are inching higher, but upside remains limited as markets weigh Ukraine peace negotiations and growing oversupply concerns.
Diplomatic pressure from the U.S. to secure a Russia–Ukraine peace agreement by year-end could lead to a future easing of sanctions, a development that would likely increase global supply.
At the same time, OPEC+ and non-OPEC producers continue to raise output despite weak demand growth, keeping both major benchmarks near their lowest levels since late October.
Technical Analysis
WTI crude maintains a bearish momentum while trading below 57.41, with downside targets at:
→ 56.38 → 54.40 (continuation if 56.38 breaks)
A deeper decline becomes likely if sellers push below the 56.38 support zone.
Bullish recovery requires stability above 57.41, with confirmation coming from a 4H candle close.
If this happens, price may extend upward toward: → 58.05 → 58.70
The 57.41 level remains the key pivot separating bearish continuation from bullish correction.
Pivot Line: 57.41
Support: 56.40 · 54.40
Resistance: 58.05 · 58.70

taking a trade on gold if it respects the bISI and the order blo1. Understand the Concepts:
BISI (Break of Structure, Internal Structure, and Institutional Order Flow):
Break of Structure (BOS): This refers to a change in market direction. For example, when a market makes a new high or low, signaling a change in trend.
Internal Structure: This involves analyzing market structure within a trend. For example, the market might make higher highs and higher lows in an uptrend or lower highs and lower lows in a downtrend.
Institutional Order Flow: This focuses on understanding the movement that big institutions are likely creating in the market. You look for patterns of accumulation or distribution where price is likely to reverse based on institutional buying and selling.
Order Block: An order block is a price area where institutions have placed large buy or sell orders, causing a significant market move. These are often seen as areas where price might reverse or continue after a pullback.
2. Setting Up the Trade:
Step 1: Identify the Break of Structure (BOS)
Check if the market has broken a significant structure point (either a high or low), indicating a possible trend reversal or continuation.
For gold, look for recent highs and lows that have been breached.
Step 2: Locate Internal Structure
In the context of an uptrend, gold might make higher highs and higher lows.
In the context of a downtrend, look for lower highs and lower lows.
Identify areas where the price has been consolidating or retracing within the trend, as these are important spots for potential breakouts.
Step 3: Check for Institutional Order Flow
Look for areas on the chart where there has been a significant move, followed by consolidation. This is often indicative of institutional order flow.
An order block could be seen as a consolidation zone, followed by a large price movement away from it. If price retraces back to this area, it might act as support (in an uptrend) or resistance (in a downtrend).
Step 4: Look for the Order Block
Identify key order blocks. These are typically found at major turning points in the market or after a strong price move.
If price retraces back to the order block area, and it aligns with the BISI criteria, it could provide a potential entry point.
3. Confirming the Trade:
Once you've identified a BOS, an internal structure in alignment with the trend, and a valid order block, you can look for a confirmation to enter the trade.
Candlestick patterns or volume analysis could provide additional confirmation, such as a bullish engulfing or a pin bar at the order block.
If you're trading a reversal, look for signs of exhaustion (such as divergence) at the order block area.
4. Trade Execution and Management:
Entry: Enter the trade when price respects the order block and confirms the break of structure.
Stop Loss: Place your stop loss slightly below (in case of an uptrend) or above (in case of a downtrend) the order block area, depending on your risk tolerance.
Take Profit: Set your take profit at a logical target, such as the next swing high/low, a key level of support/resistance, or a risk-to-reward ratio that suits your strategy.

Gold Near ATH & PRZ — Is This the Top?As I expected , Gold( OANDA:XAUUSD ), after its pullback to the symmetrical triangle, has risen toward its target.
Now, the question arises: given that Gold is near its all-time highs, is it still sensible to take long positions, or should we consider short positions instead?
Gold is moving close to its All-Time High(ATH=$4,381) and the Potential Reversal Zone(PRZ) , also nearing the target of the Symmetrical Triangle Pattern.
From an Elliott Wave perspective, it seems that Gold is in the process of completing microwave 5 of the main wave 5. One indication of this is the presence of negative Regular Divergence (RD-) between the two corresponding peaks.
I expect that Gold will experience a downward correction and potentially drop to around $4,263, with significant support lines in place. Should those support lines be broken, we could anticipate even further declines.
What are your thoughts? Do you believe Gold will reach new all-time highs, or are we looking at a correction ahead?
First Target: $4,263
Second Target: Support lines
Stop Loss(SL): $4,433
Points may shift as the market evolves
💡 Please respect each other's opinions and express agreement or disagreement politely.
📌 Gold Analyze (XAUUSD), 4-hour time frame.
🛑 Always set a Stop Loss(SL) for every position you open.
✅ This is just my idea; I’d love to see your thoughts too!
🔥 If you find it helpful, please BOOST this post and share it with your friends.
