OXY (Occidental Petroleum) - Weekly - Accumulation DetectedOXY doesn’t look like a trend right now. It looks like a compressed spring - quiet, coiled, and waiting for release.
1) What Accumulate is showing (free tool only)
On the weekly timeframe, TrendGo Accumulate is detecting a clear accumulation phase .
This tells us the market has entered a zone where, historically, position building matters more than short-term noise.
A key detail: Institutional Volume remains LOW.
That’s important. This is not a euphoric, headline-driven move - it’s a quiet phase , where strong moves often start after most participants lose interest.
2) Price structure: compression and decision zones
Price has spent a long time moving sideways in a tight consolidation range.
This kind of structure usually does three things:
• drains patience,
• shakes out weak positioning,
• sets the stage for a decisive expansion.
Key weekly levels to monitor:
• Support / defense zone: around $38.50
→ If this level fails, the accumulation thesis weakens.
• Mid-range reaction level: around $48.50
→ Acts as a recurring balance point inside the range.
• Critical breakout level: around $56.50
→ Above this level, the market stops being a range and starts attempting a trend transition.
3) How to interpret this (no guessing)
This is not a buy signal. It’s context.
• While price remains compressed → treat OXY as a tracked setup, not a forced trade.
• A weekly break and hold above $56.50 would be the first real confirmation that accumulation is resolving into a higher-volatility move.
• Rejection from resistance does not invalidate accumulation — it simply means the process is still ongoing and patience is required.
Bottom line
OXY is in a classic “quiet before the move” phase.
Accumulate confirms accumulation, price is compressed, and volatility is being stored rather than released.
The real question is not if the range breaks — but when , and in which direction.
Question for you:
Do you prefer to track setups before they become obvious - or only once the breakout is already behind you?
Compressionpattern

How to PCCE+FBD – Decoding Expansion/Exhaustion & Reversal zones🧭 PCCE + False Breakout Detector – Decoding Expansion, Exhaustion & Reversal Zones
How It Worked on the Chart
In this BTC/USDT 15-minute chart, the indicator detected several Price Coil Compression & Expansion (PCCE ) phases and confirmed false breakouts with visual clarity:
• Green vertical zones represent bullish expansion bursts — price coils tightly, then breaks upward with volume confirmation.
→ These often appear after sideways congestion, signaling early trend ignition.
• Red vertical zones mark b earish expansion bursts — price expands downward after compression, usually following distribution-like setups.
→ Notice how each burst frequently aligns with a decisive trend move.
• The “Burst↑ / Burst↓” labels highlight valid expansions confirmed by momentum and volume thrust conditions, showing continuation opportunities.
However, the true power lies in the False Breakout Detection System — the small “X”-shaped bullish (green) or bearish (red) crosses that appear at potential exhaustion points.
🔍 Interpreting the False Breakout Marks
The bullish “X” and bearish “X” crosses represent trap zones or deceptive breakouts that failed to sustain momentum beyond the coil’s boundary.
• Bearish X (Red) : Price attempted to break higher but was rejected, often marking a short-term top.
→ Can be used as a signal to exit long trades or prepare for short entries once confirmation candle closes below.
• Bullish X (Green) : Price dipped below the compression base but quickly re-entered, showing rejection of lower prices.
→ Indicates a failed breakdown, usable as an early long setup or exit from short positions.
🎯 How Traders Can Use It
1. For Entry Confirmation:
• Wait for a Burst↑ or Burst↓ label after a compression phase.
• Enter in the direction of the expansion, confirming with volume or candle momentum.
2. For Exit or Reversal Spotting:
• Use the False Breakout crosses as smart exit markers.
→ If you are long and a red “X” appears near the top, consider partial profit or tighten stops.
→ If short and a green “X” appears near the bottom, expect possible short covering.
3. For Reversal Trading:
• Combine “Burst” direction with the opposite false breakout mark.
Example: After a Burst↓ (bearish move), if a bullish X appears, it suggests exhaustion — a reversal or pullback may begin
💡 Practical Takeaway
The PCCE + False Breakout Detector effectively blends volatility compression theory with trap pattern logic, letting traders:
• Spot pre-move compression zones ,
• Identify false breakouts and momentum traps , and
• Time exits or reversals with visual precision.
This makes it a dual-purpose tool — both a trend-continuation detector and a reversal warning system — ideal for intraday and swing traders across all markets.

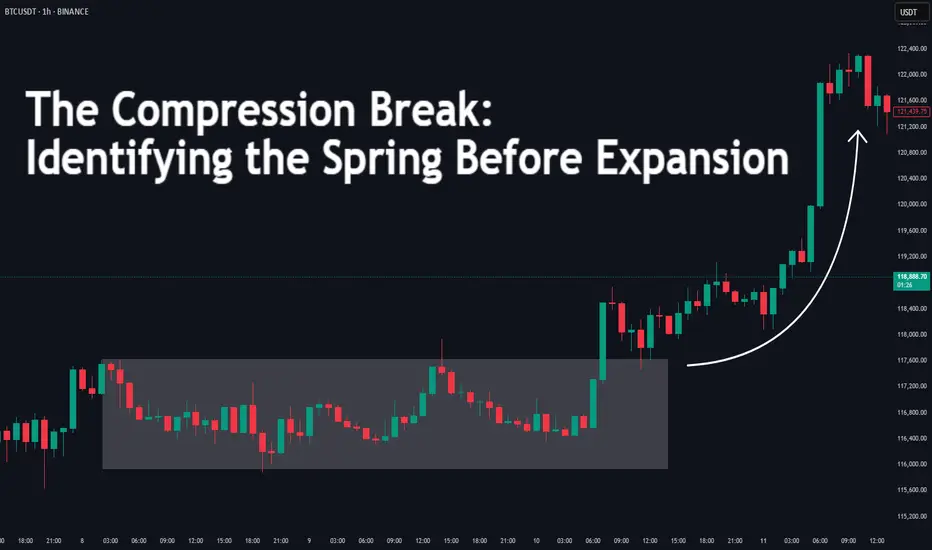
The Compression Break: Identifying the Spring Before ExpansionDifficulty: 🐳🐳🐳🐋 (Intermediate)
This article is for traders who want to recognize and trade explosive moves that form after periods of tight price compression. Perfect for those familiar with structure, volume, and volatility concepts.
🔵 INTRODUCTION
Price doesn’t move in a straight line — it breathes. It expands when there’s imbalance, and it compresses when the market is building energy. The most powerful moves often start with a compression phase — a tight, controlled price range — before a sudden breakout.
Learning to spot these “springs” before they snap can give you trades with excellent risk/reward ratios and clear invalidation points.
🔵 WHAT IS COMPRESSION?
Compression occurs when price volatility shrinks, and each swing becomes smaller than the last. It looks like price is being “squeezed” between converging support and resistance levels.
Common causes of compression:
Liquidity build-up before a major session open
Market waiting for a news release or key event
Institutional positioning before a drive
The tighter the range, the bigger the potential release.
🔵 WHY IT MATTERS
Compression is important because:
It reveals where the market is balanced and undecided
It creates a high-energy environment — a small push can trigger big moves
It offers tight stop-loss placement and clear breakout targets
Think of it like a coiled spring: the more it’s compressed, the more explosive the release.
🔵 HOW TO IDENTIFY COMPRESSION
1️⃣ Price Action Clues
Consecutive smaller candles with overlapping ranges
Lower highs + higher lows (triangle formation)
Reduced wick size in the final stages before breakout
2️⃣ Volume Clues
Declining volume during the squeeze
Sudden volume spike as breakout begins
3️⃣ Volatility Clues
ATR (Average True Range) dropping to local lows
Bollinger Bands narrowing (optional)
🔵 TRADING THE COMPRESSION BREAK
Step 1: Define the Box
Mark the high and low of the compression range. This will be your breakout reference.
Step 2: Wait for Volume Confirmation
Avoid jumping in on the first tick outside the box. Wait for a volume surge or strong close beyond the boundary.
Step 3: Trade in the Breakout Direction
Entry: After confirmed breakout close
Stop Loss: Inside the compression range
Target: Equal to the height of the compression box or previous swing high/low
🔵 EXAMPLE SCENARIO
Price compresses for more then 10 bars into a tight range
Volume steadily declines → ATR hits a local low
A big body bullish candle breaks above range high with 2× average volume
Entry at breakout close, stop inside range, target = box height projected upward or 1:2 RR
🔵 ADVANCED TIPS
Align with higher timeframe trend for higher probability
Watch for false breakouts (liquidity sweeps) before real move
Combine with order blocks or VWAP to refine entries
Use session timing — many compression breaks happen at market opens
🔵 CONCLUSION
Compression is the market’s way of loading a trade with potential energy. When you spot it, you’re seeing the buildup before the burst. Trade it with patience, volume confirmation, and proper structure, and it can become one of your highest-probability setups.
Have you traded compression breaks before? Share your best example in the comments!
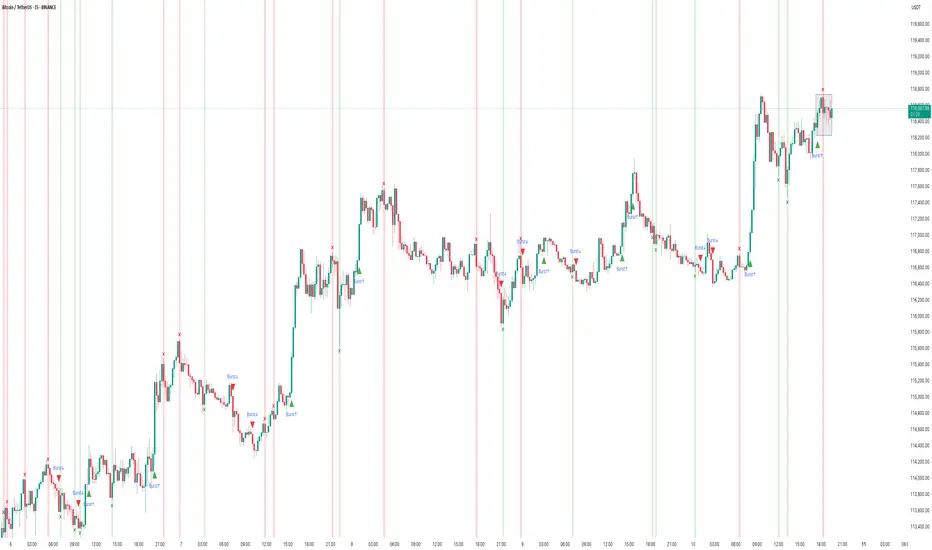
How the PCCE + False Breakout Detector Performed in BTCChart: BTC/USDT (15m – BINANCE)
Tool Used: PCCE + False Breakout Detector
Type: Educational – How to interpret breakout and trap detection.
🟢 What the Indicator Does:
The PCCE + False Breakout Detector blends two core functions:
1. Price Coil Compression & Expansion (PCCE): Finds tight volatility compression zones and signals when price bursts out with strength (Burst↑ or Burst↓).
2. False Breakout Detection: Flags bull and bear traps when breakout moves fail to hold beyond recent swing levels.
This pairing gives a setup phase (compression), a confirmation phase (burst), and a risk filter (trap detection).
✅ Recent Performance Highlights:
📈 Early Session:
• Several Burst↑ and Burst↓ signals emerged during small compression ranges.
• A Burst↑ around 06:00 marked the start of a steady climb, confirming breakout alignment with volume/trend filters.
📉 Mid Session:
• A Burst↓ appeared, but price quickly reversed upward.
• The reversal was flagged as a bear trap (green ❌), warning traders of a failed breakdown.
📈 Late Session Rally:
• Around 15:00, a compression zone formed before a strong upward move.
• The breakout printed a Burst↑ and continued into a multi-hundred-dollar rally.
• Shortly after, a bull trap (red ❌) was flagged at the top — price stalled and pulled back within minutes.
🔍 Interpretation:
• Burst↑/↓ = Entry cues from high-probability volatility expansions.
• ❌ markers = Real-time warnings that a breakout may fail, helping avoid false momentum plays.
• Combined Effect : Captures early move potential while filtering risky breakouts.
⸻
📚 How to Apply in Trading:
1. Mark coil zones and prepare for potential expansion.
2. Confirm breakouts with Burst signals and, optionally, trend/volume filters.
3. Heed trap markers — they often precede reversals or consolidation.
4. Pair with higher-timeframe analysis for trend bias.
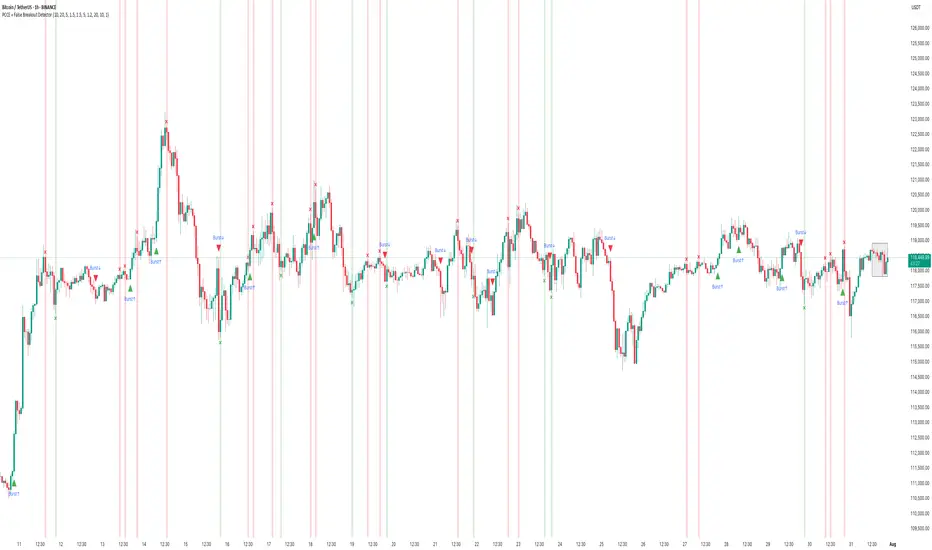
How to Use the PCCE + False Breakout DetectorHow to Use the PCCE + False Breakout Detector to Catch Trap Zones in BTC
Chart: BTC/USDT (1H)
Tool Used: PCCE + False Breakout Detector
Type: Educational – How to identify false breakouts and anticipate trend shifts.
⸻
🧠 What the Indicator Does:
The PCCE + False Breakout Detector is designed to identify breakouts from coiling ranges and filter out trap moves that often fool traders.
🔹 Burst↑ / Burst↓: Valid breakout from a price coil with volume and trend alignment
🔻 Red X: Marks a bull trap — breakout failed and price reversed lower
🟢 Green X: Marks a bear trap — breakdown failed and price reversed higher
By flagging where breakout structure fails, the indicator helps traders avoid false entries and position early for reversals.
⸻
✅ Recent Performance Highlights (BTCUSDT 1H):
📈 From July 13–31:
• Burst↑ on July 13 led to a clean uptrend (+$1,500 gain)
• Red X on July 16 called a failed breakout — price dropped hard
• Green X on July 16 caught the bear trap — price reversed immediately
• Burst↓ on July 21 triggered a sharp decline, validating breakdown
• Red X on July 30 spotted the bull trap just before price reversed down
📉 Even in sideways ranges, Red/Green Xs signaled when the move lacked conviction, allowing traders to wait instead of chasing noise.
⸻
🔍 Current Interpretation:
• BTC is trading inside a choppy structure after a recent Burst↑ and Red X combo.
• The X mark zone (gray box) warns of instability — bulls attempted a breakout but failed.
• If price continues to stay below the Red X high → likely retracement ahead.
• If we see a Green X + rally soon → potential reversal setup in progress.
⸻
📚 How-To Use the Indicator:
1. Burst Signals (Breakouts)
🔸 Use these to enter when coil compression breaks with volume
🔸 Works best when aligned with EMA trend and breakout body
2. Red / Green X (False Breakout Detector)
❌ Red X: Price spiked above resistance but lacked follow-through → trap
✅ Green X: Price dipped below support but got bought → trap
3. Confirm with Price Context
🔄 Look for reaction candles after X marks
📏 Set tighter stops — traps often reverse fast
🔔 Combine with your S/R zones or order block theory
⸻
🧠 Final Thoughts:
The PCCE + False Breakout Detector isn’t just about spotting momentum — it’s about reading intent vs. failure in price action.
BTC’s current structure shows signs of indecision. Trust the Xs to tell you whether the move has legs — or is just another trap.
🎯 Learn to trade the trap, not fall into it.
nvda long confirmationnvda corrected in 4 hours or the correction fails to break the last low at 115. big support in 1d for more than 2 years.
breakage from the top of the compression zone

Ethereum Let's go for Ethereum $4000 or Ethereum $3500!!?
what do you think?
We have HH and HL on the chart so far; In other words, we do not have confirmation for a downward trend (((currently))). The resistance range that we had on the price area of $3943 has also been completely consumed.
As the resistance areas are consumed, the way to continue the upward trend is opened.
Now, on the price chart, a compression movement has been formed in the 30-minute time frame; Provided that the price range of $3,628 is maintained, there is a high possibility that we will get out of this compression from above.
But we have to be careful, the possibility of getting out of this compression from the bottom is not small. Especially since currently 68% of Ethereum holders are in profit.

Solid Small Caps for EarningsAnyone finding interesting setups in small caps this earnings season?
These often have more reliable patterns for swing trading. Since they are largely under the radar of the retail crowd, institutional patterns can be clearer.
NASDAQ:CERE is an example of a stock coming up in TechniTrader scans today. It has 88% institutional holdings. A compression pattern is developing. HFTs have been in it recently, possibly due to intermittent accumulation. The strengthening of the sideways action is particularly visible with the RSI indicator.
Dark Pool accumulation tends to cause controlled sideways patterns like this, a key ingredient for what we call Relational Technical Analysis at TechniTrader.
Because this has had a swing-style run out of the last compression pattern at a low in this longer trading range, a swing trade could be considered on the breakout, either above today's high or above the last resistance level for a more conservative entry. (Green lines on the chart) My target would be 31, but of course I'd be watching for exit signals or an extreme pattern to take profits early. Stop loss at the red line on the chart.
A more aggressive trader could look at an entry ahead of the close today if pro trader patterns emerge in the last 15 minutes with an exit shortly after the open if a run or gap up develops for an EOD to FOD trade.
Happy Trading!
Guest author: Mele Ainuu, Senior Technical Analyst, Student Support @ TechniTrader
CLong

SNXUSDTHello dear friends
✔️ The long-term downtrend line has been broken.
At the same time, we have a positive RSI divergence in the daily time frame.
✔️ The support range ($1,523) is well maintained.
❕ If the resistance range of $3.6, which is a very important area, is completely consumed, the situation will become very attractive for us.
Considering that LL has not been formed on the downward trend, if a higher high is formed in the lower time frame, it can be a short-term confirmation.
What do you think?

BTCUSD potential short setup and alternativeBitcoin currently trading within a compressed pattern while clearly making new lower highs and lower lows.
Might have a high probability if the lower band breaks that bitcoin will look up the 25k range before finding some upward liquidity again.

EURUSDHello friends
On the daily chart , we have a kind of tight movement, the positive divergence of the RSI can be a kind of signal for the price to exit from the upper side, from this compression.
Provided that the current price trend is above the range of $1.02244, the possibility of the continuation of the upward trend up to the yellow range ($1.13871) will be strengthened.
What do you think?

MANAUSDTHello friends
On the four-hour time frame, we have a harmonic pattern combined with tight price movement. If the current trend is above the orange range ($0.6994), there is a high probability of forming an upward trend similar to the drawn scenario.
Don't forget the damage limit!
What do you think?

XAUUSDHello my dear friends
We have a kind of intensive movement in the daily time frame along with the positive divergence of the RSI!!!
If the current trend is above the $1,736,915 range, the possibility to break out of this compression from above will be strengthened for us.
We are happy to hear your comments

AMD: Compression PatternCompressions patterns are an important one to watch for in sideways action like a bottom formation. These form as buyers gain dominance over sellers. I'd like a tighter consolidation to develop at the current resistance for lower risk for entry on the breakout.

Gold Spot / U.S Dollar 1D looks bearishThe pair is currently bearish and hopefully, it will go down to get some profits

AUDCAD looks bearish1. HTF: Broke above a downward trend, retesting support but could not break it. We are the HTF Support Zone also marked on the chart
2. LTF: We are currently on the SUPPLY ZONE, we should have a sell outlook

$BTCUSD UpdateI entered my second position on BTC just below $45,000. I am holding with a bullish bias.
I have been asked to share some analysis recently and an update on my thoughts as to what the price is doing following some resistance at $60,000 and support at $48,000.
I have carried out some extensive testing on this instrument against other currencies and I have also tested this compression channel on 4 of the currency pairs I trade it on which include EURUSD, AUDUSD, NZDUSD & USDJPY.
All have great results.
This happens to be the strategy I have used on both of my long-term BTC entries which you can read about and watch elsewhere.
With this particular compression channel, I have found that there is a 77% chance of extending beyond the initial high (compared to a 71% chance of retesting the initial high on my other currency pairs).
I have also found that before the extension there is a higher probability of an initial decline before the rally.
Anyone looking to trade this market could look to set a buy stop to catch the breakout. If you take this approach, you have to have a position for the stop loss which I have found to decline on average 20% of the initial high before carrying on upwards.
OR
Wait for the decline then get in at a better price. The downside to this is missing the move. (This is always my approach as I would rather have less risk)
Either way, I'm confident in my long-term position following my last position of 657% ROI.
Next level of resistance I am predicting is - $65,000
I believe we will see $100,000 by the end of this year.

BTCUSD | PREDICTION ON WHEN THE BULL RUN WILL COMMENCE Morning Traders,
As we saw yesterday we were too early to the run to the 50k level and consequentially the 1.5tr market cap.
I have marked out and illustrated how i see price action playing out, I will be watching structure to determine how we progress.
The Illustration suggest we will get a compression on volatility which leads to an expansionary move to the upside.
How I will determine if this is the case, I will be watching for fractal nature.
overall still macro bullish for now.
what's your thoughts guys, agree disagree?

Compression FormingA Compression pattern is forming with an upward bounce. upward sentiment is building.

Compression looks to be shortAnalyzing a horizontal compression pattern to determine future movement.
Looking at MACD and Volume to support prediction. MACD indicates a possible downward bounce and Volume is lowering into the weekend as expected but over the course of the week volume has lessened intensity.
All three of these combined trends are suggesting support is weakening and over the next week i suspect the EURUSD pair to be short, retouching previous lows.


GBPUSD SND Compression + QM Chart Pattern : SHORT OppurtunityTF: 4H
price climbing in a compression/zigzag mode. approaching the supply area.
clearing all the SND zones while doing the climbing.
Pro to Shorts at the last SND Zone.
TAYOR
RISK: 3%.
keep your SL small and risk tight.

AUDUSD prepare to SELL! Just an idea!Now we have the potential to make SELL actions. where AUDUSD as we have seen, is currently experiencing a compression pattern. Where we also have a valid and still fresh supply area. you can place pending orders at the level that has been prepared in the picture.
Happy transactions, and don't forget to enjoy preparing for the Christmas and New Year holidays.
Best Regards,
Don_Hawkish
