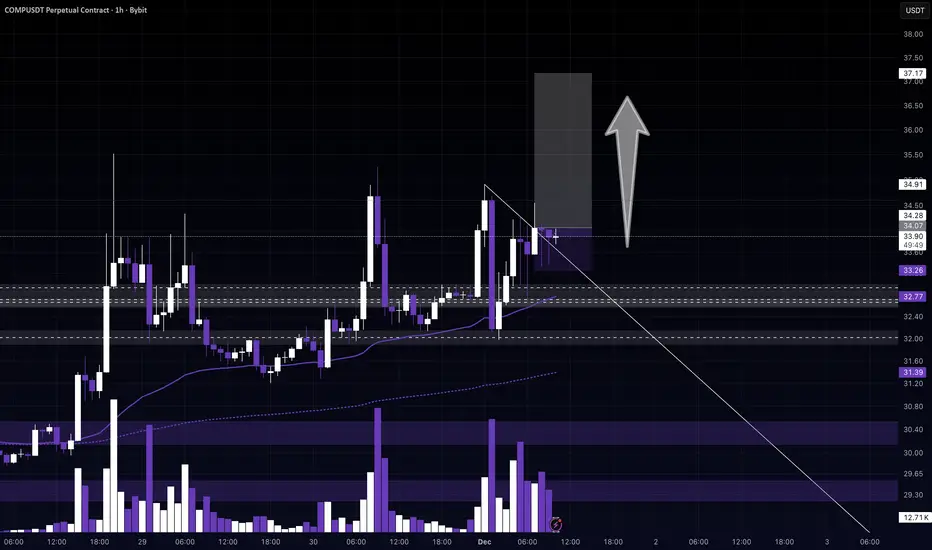
COMP/USDT: +250% Macro Expansion SetupCompound ( NYSE:COMP ) is displaying major multi-month accumulation characteristics as price action builds a massive rounding bottom above the **$22.50 – $24.50** primary demand block. With sell-side volume steadily abating and dynamic lower-timeframe support holding firm above major EMAs, market structure points toward sustained institutional absorption. A high-volume H4 candle close above the primary pivot clears overhead dynamic supply, unlocking a multi-leg short squeeze toward macro high-vo
COMPUSDT
COMPUSDT Forming Upward MomentumCOMPUSDT is showing renewed strength on the daily timeframe as buyers step up right at the core demand block. Following a sharp corrective dip back into this horizontal base, the market rejected lower levels almost immediately, leaving behind a clear reaction wick. That quick refusal to break down signals that the pullback has likely run its course and sellers are running dry. With price action holding firm above this structural pivot, the current projection maps out an upside extension of rough
COMP Has Lost a Key Support Level (4H)COMP appears to have completed a bullish ABC pattern and is now potentially entering a bearish phase, possibly Wave D of a larger corrective structure.
As shown on the chart, price is currently trading below an important Flip Zone, which could now act as resistance. If COMP pulls back toward this zone, we will be watching for potential selling opportunities and looking for a suitable entry to join the expected downward move.
The target levels are marked on the chart, and if bearish momentum co
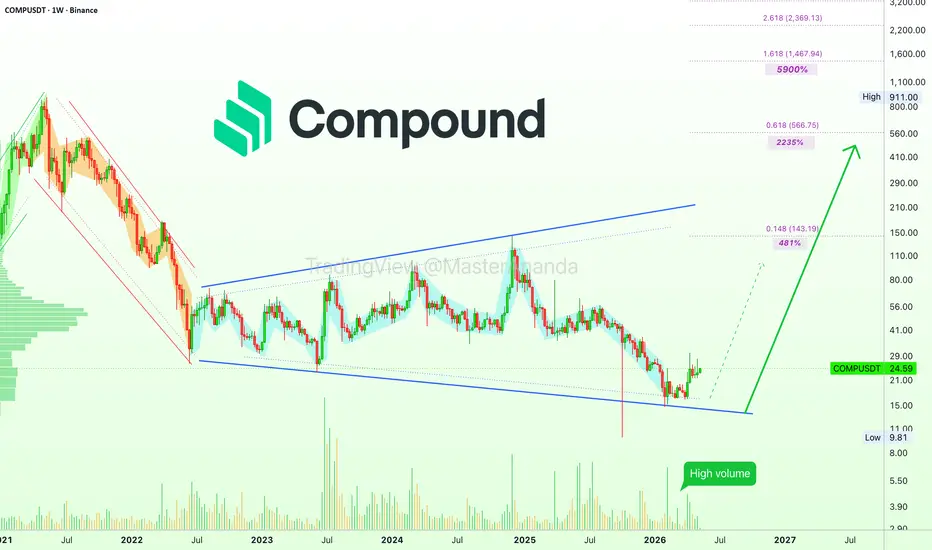
Compound: Bottom complete vs the 2026 Cryptocurrency bull-marketCan COMPUSDT grow 9,000%? Very doubtful, this is beyond a new all-time high, it is beyond the chart structure and cycle projections, I don't think it possible.
For COMPUSDT to produce 9,770% total growth from current prices, around $24, it would need to rise all the way to $2,369. Now, don't get me wrong, it is always possible and many Cryptocurrencies have been known to grow this much during a strong bullish period, it is just not do-able here based on the chart.
A most reasonable target is $
COMPUSDT Forming Bullish MomentumCOMPUSDT is forming a clear bullish momentum pattern, a classic bullish reversal signal that often indicates an upcoming breakout. The price has been consolidating within a narrowing range, suggesting that selling pressure is weakening while buyers are beginning to regain control. With consistent volume confirming accumulation at lower levels, the setup hints at a potential bullish breakout soon. The projected move could lead to an impressive gain of around 30% to 40% once the price breaks above
#COMPUSDT #3D (Binance) Falling wedge breakout and retest [LONG]Compound regained 50MA support and is pulling back to it, seems likely to resume bullish towards 200MA resistance next.
⚡️⚡️ #COMP/USDT ⚡️⚡️
Exchanges: Binance Futures
Signal Type: Regular (Long)
Leverage: Isolated (2.0X)
Amount: 5.1%
Entry Targets:
1) 22.66
Take-Profit Targets:
1) 35.99
Stop Targets:
1) 15.98
Published By: @Zblaba
CRYPTOCAP:COMP BINANCE:COMPUSDT.P #3D #Compound #DeFi compound.finance
Risk/Reward= 1:2.0
Expected Profit= +117.7%
Possible Loss= -59.0%
Estimated Duration
COMP — Trapped in a Descending Channel, Breakout Incoming?📊 Technical Analysis
💵 Coin: NYSE:COMP / USDT
⌛ Time Frame: 3D
📉 Pattern: Descending Channel
📍 Current Price: ~$17.89
---
📐 DESCENDING CHANNEL
NYSE:COMP remains within a Descending Channel that has been developing since the major high around $120+.
🔴 The Upper Trendline has acted as dynamic resistance and has repeatedly limited bullish recovery attempts.
🟡 The Lower Trendline acts as dynamic support and defines the lower boundary of the channel.
🟢 The Middle Trendline can be used as a
COMP is at risk of initiating a deep drop! (8H)COMP is currently retesting previously broken trendlines and a flipped resistance zone, which is now acting as a key decision area for price action.
In fact, COMP appears to be attempting to complete wave E of a larger corrective structure, suggesting that the final leg of the pattern may still be in progress before a potential continuation to the downside.
The highlighted red zone represents a high-probability entry area for a short position, where bearish reactions are expected if price conf
COMP Under Pressure | Is a Crash Coming? (8H)From the point where we placed the green arrow on the chart, a triangle pattern appears to be forming. We are currently in wave D of this triangle. Wave 1 and wave 2 have already been completed, and we now expect wave 3, meaning wave C of wave D, to develop soon.
The supply zone could provide a potential short entry opportunity.
Targets are marked on the chart. Move to breakeven at the first target.
A daily candle close above the invalidation level would invalidate this scenario.
If you have
Compound: 480% First · Resistance is about to breakSince mid April resistance is being challenged on this chart based on the weekly timeframe. COMPUSDT is trying to move higher, without success so far, yet, the chart conditions continue to improve.
Buyers are being rejected at resistance but there are no new lows. Five weeks with the same barrier still active but we continue with a green market and chart. COMPUSDT is ready to move higher.
Long-term growth shows huge potential available for this trading pair. But we have to start somewhere, and
COMP/USDT — Descending Trendline, Breakout or Rejection?On the 3D timeframe, COMP/USDT remains in a strong downtrend structure, clearly defined by a descending trendline (yellow line). Price continues to form lower highs and lower lows, indicating sustained selling pressure in the mid- to long-term.
Currently, price is testing a key decision zone:
Trendline resistance
Horizontal resistance around 24.5 USDT
This area will likely determine the next major move.
---
📉 Structure & Pattern
🔻 Descending Trendline (Downtrend Structure)
A consistent
COMPUSDT Forming Bullish MomentumCOMPUSDT is currently forming a clear bullish momentum pattern, a classic wave structure that often signals an upcoming breakout. The price has been consolidating within a narrowing range, indicating that selling pressure is gradually weakening while buyers are beginning to regain control. With consistent volume supporting accumulation at lower levels, the setup suggests a strong potential for a bullish breakout in the near term.
If the price breaks above the wedge resistance, the projected mov
Compound · Early bullish action & long-term growthGood afternoon my fellow Cryptocurrency trader, I hope you are having a wonderful day.
›› Is the current move real or fake?
›› Are we witnessing the start of a new cycle, a new bullish period or a bull-trap, which one is it?
›› How to know if this move promises higher prices or if the results will be the same as before?
Great questions, let's ask the chart.
Compound has been bearish for years, when it comes to the broader market cycle and chart structure —since May 2021.
Compound has been
Bears are in control of COMP price action (8H)Price has reacted to a supply zone and then broke below the bullish trendline to the downside. We also have a bearish ICH structure on the chart, and the candle that touched the supply was rejected immediately with a wick. Based on this, it is expected that COMP may move toward lower levels.
Two clear entry points have been marked for DCA entries.
Targets are marked on the chart, and at the first target you should move to break even.
A daily candle close above the invalidation level will inval
Compound tuns hyper-bullish · Big vs small · PP: 150% - 333%This is the most bullish Compound has been since April 2025. The bottom being clearly revealed through price action and trading volume.
Price action: Higher lows since October 2025. Very strong bullishness recently with six consecutive days closing green. A broken down-trendline coupled with a decisive move above EMA55 daily confirms we are ready for a bullish wave.
Trading volume: Buyers clearly have the upper-hand when we consider the volume indicator. The VRVP also supports growth back to b
Compound trades at bargain prices: 3,365% potential with 5XWe are going to be looking at COMPUSDT (Compound) up-close. Just one candle is needed to confirm a bullish wave coming up next. It is a series of events but yesterday's candle coupled with today gives the full confirmation.
The low happened 6-Feb. followed by a strong reaction, the first bullish signal. This move, mid-Feb, gets corrected through a retrace that ends 8-March. On the 11 we get a full green candle and yesterday the action turns red.
Today, COMPUSDT turns bullish again with the ses
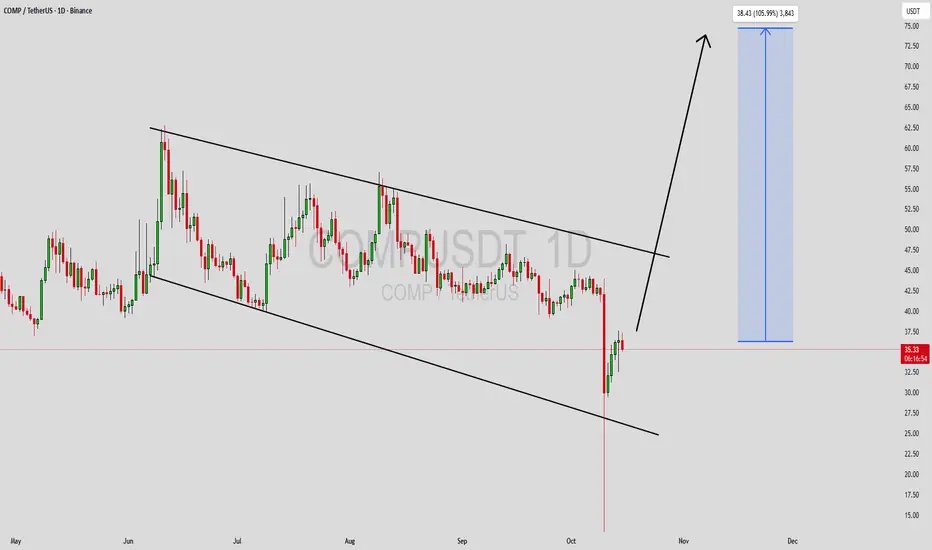
COMPUSDT Forming Falling wedgeCOMPUSDT is forming a clear falling wedge pattern, a classic bullish reversal signal that often indicates an upcoming breakout. The price has been consolidating within a narrowing range, suggesting that selling pressure is weakening while buyers are beginning to regain control. With consistent volume confirming accumulation at lower levels, the setup hints at a potential bullish breakout soon. The projected move could lead to an impressive gain of around 90% to 100% once the price breaks above t
Compound bear market ends with a high volume bullish breakoutThis week COMPUSDT is moving but this is not your usual week, it is the best week since December 2024...
Good afternoon my fellow Cryptocurrency trader, I hope you are having a wonderful day.
›› Is the current move real or fake?
›› Are we witnessing the start of a new cycle, a new bullish period or a bull-trap, which one is it?
›› How to know if this move promises higher prices or if the results will be the same as before?
Great questions, let's ask the chart.
Compound has been bearish for
COMP Analysis (4H)It seems that wave E of the corrective diamond pattern has completed, and COMP is about to enter the bullish wave F of this pattern. If the price reaches our entry points, we can enter the position using DCA.
The targets are marked on the chart.
A daily candle closing below the invalidation level will invalidate this analysis.
For risk management, please don't forget stop loss and capital management
When we reach the first target, save some profit and then change the stop to entry
Comment if
COMPUSDT – Up Move?Alright guys, we had a major liquidation party this morning —
half the market got slapped, carpets pulled, stop-losses harvested… the usual crypto breakfast.
But COMPUSDT?
This thing is holding like a champion.
Barely flinched.
Didn’t panic.
Didn’t cry.
Just stood there like:
“Is that all you got?”
What do I expect?
A potential Bitcoin bounce today, and if BTC decides to stop being dramatic for 5 minutes, COMPUSDT could easily catch a nice follow-up pump.
BUT —
(there’s always a ‘but’ in cryp
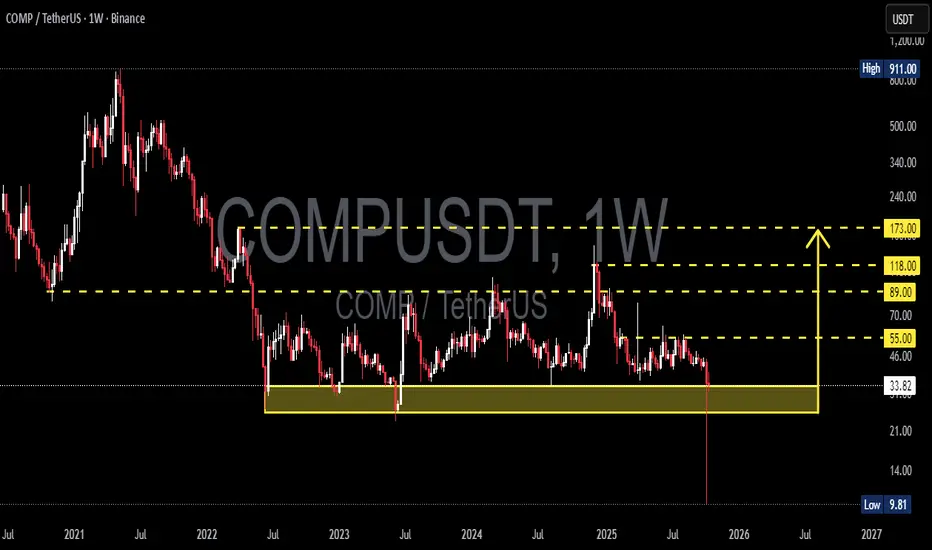
COMP/USDT — Final Accumulation Zone Before the Next Macro Move?
“History doesn’t repeat, but it often rhymes — COMP returns to the same accumulation box that launched previous rallies.”
For more than two years, COMP has been trading inside a wide multi-year range, and price has once again reached the major accumulation zone at 33.5 – 25.5 USDT (yellow block).
This area has acted as a strong demand base since 2022 — every touch within this zone has historically triggered sharp rebounds.
Now, COMP is back at the exact same level — and the market is asking o
COMPUSDT Forming Falling WedgeCOMPUSDT is showing a strong falling wedge pattern, which often signals a potential bullish reversal in the market. After a period of sustained downward pressure, the price action is now consolidating within a narrowing range, indicating weakening selling pressure and growing buyer confidence. The good trading volume further confirms this pattern, hinting that a breakout may be on the horizon. If the resistance trendline breaks decisively, COMPUSDT could experience a powerful surge of 90% to 100