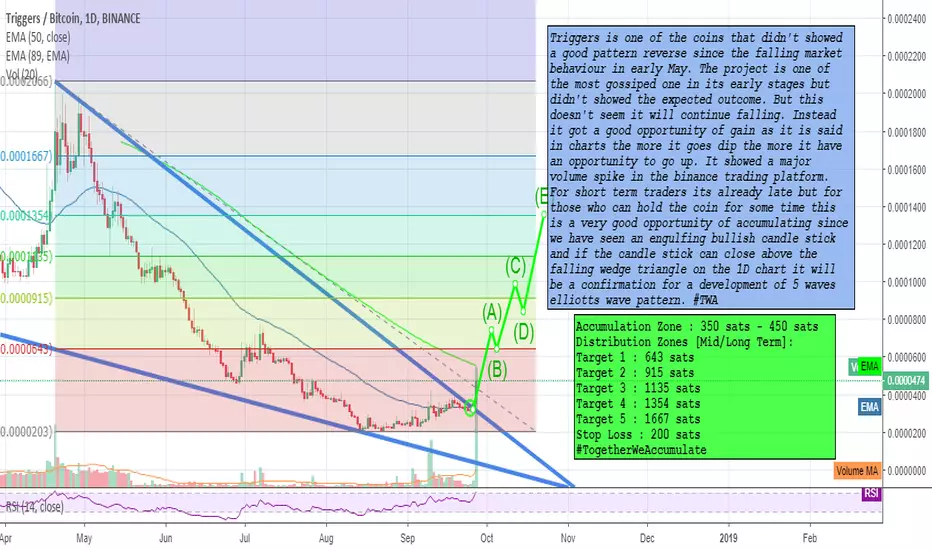
Trig +135% profitsTriggers is one of the coins that didn't showed a good pattern reverse since the falling market behaviour in early May. The project is one of the most gossiped one in its early stages but didn't showed the expected outcome. But this doesn't seem it will continue falling. Instead it got a good opportunity of gain as it is said in charts the more it goes dip the more it have an opportunity to go up. It showed a major volume spike in the binance trading platform. For short term traders its already late but for those who can hold the coin for some time this is a very good opportunity of accumulating since we have seen an engulfing bullish candle stick and if the candle stick can close above the falling wedge triangle on the 1D chart it will be a confirmation for a development of 5 waves elliotts wave pattern.
Accumulation Zone : 350 sats - 450 sats
Distribution Zones :
Target 1 : 643 sats
Target 2 : 915 sats
Target 3 : 1135 sats
Target 4 : 1354 sats
Target 5 : 1667 sats
Stop Loss : 200 sats
Good Luck.
Legal disclaimer:
Information on this channel is our team's analyst's "opinion" based on data available at this point in time. These opinions are not recommendations to buy or sell securities/commodities and cryptocurrencies. Trading and investing is a risk and you should not rely on this data to make any financial decisions. You must consult a financial advisory licensed by regulatory agencies in your legal jurisdiction. All information stated here and in our reports don't guarantee any possible profits or losses. Please do consider to do your own due diligence and research when making any kind of a transaction with financial implications.
With Regards. TeamTWA.
Confirmation
GBP/USD Short Setup- Breakout of parallel channel
- Confluence: 61.8 fibonacci level rejection on H4 which happens to be my H4 resistance level (1.3210)
- EMAs crossover with price action below supporting bearish bias
- Bearish sentiment on sterling with uncertainty looming over brexit
- Price seems to be heading back towards the 1.3000 psychological level
- 60 pips target with 30 pips stop

Bitcoin Analysis Looking Forward 10 Days1. Introduction
2. Elliott Wave Count
3. Correction
4. Conclusion
1. Introduction
The problem with Elliott Wave Theory is it's extreme subjectivity. Finding an exact wave count & forecast is extremely difficult; E.W.'s are subject to error when projecting targets considering there are several different places they can eventually end. If by chance you have mastered the count as a trader you watch for the typical ending point but the move is always affected by a number of factors including volume, strength, and black swan events.
In my trading career I have stayed away from using E.W.'s as a signal indicator, I typically do not rely on them for trades but lately I have been working on a way to confirm the strength & length of a wave that I will not be explaining today as it is lengthy. But, I will at some point in the near future be putting everything I am doing on E.W.'s into one single indicator & system for public sale. Until then, my analysis will factor the system in but not rely on it nor be explained. Again, Elliott Wave Theory is still subjective even with a low strike rate confirmation system.
Keep in mind when using E.W.'s you must be fluid in your projection and capable of admitting you were wrong on certain variations and adjust accordingly. Also, never stop using your basic trading and analysis rules just because a wave conflicts with other data.
2. Elliott Wave Count
Using the 4 hour to get an expanded view of our larger time frame moves we completed a intermediate 5 wave push as labeled. There is a larger wave taking place simultaneously that peaked impulse 3 at the same point of the intermediate wave endpoint labeled (5). Logically, this is a reversal point for those impulses and a corrective wave must be looked at.
3. Correction
Based on E.W., rules the larger E.W. move has a landing place for wave 4 shown on the chart in the bluish box on the right. However, as mentioned above E.W.'s can have multiple landing points, shown there is a typical wave 4 end point based on E.W. rules. There are extended waves that can be confirmed thru logical assumptions and confirmation of other factors which I will get into.
Looking at the intermediate wave that finished its 5 wave sequence, I've examined the major support levels & other factors on multiple time frames and concluded that the corrective wave shown (A)(B)(C) is the most logical path being shown.
Indicator Confirmation
Our first pause was directly above the 38.20% fibonacci retrace point. (Fib levels are not an exact science either FYI) What I am looking for here is for the RSI & Stochastic to cool down and reveal chop action for a while within the yellow box shown then break down to the yellow box below completing corrective wave (A).
The Guppy Multiple Moving Averages (GMMA) needs to correlate with price action and pull itself out of oversold conditions also. The sideways/chop action will do so & offer a bit of relief there before continuing downward.
Taking a look at our volume indicators and more particularly the On Balance Volume, we see a heavy decrease in buying from that dip.
On the O.B.V., sitting at the horizontal line in yellow we can trace past price action and see that price levels were not maintained at this O.B.V. level. The logical place to assume the end of wave (A) is past price levels at this point on the O.B.V. which ranges in the lowest yellow box shown where wave (A) ends.
The horizontal blue line on the O.B.V. indicator is where I speculatively see the corrective wave ending due to the peak of the prior O.B.V. range.
Corrective wave (B) is difficult to map out accurately. That I am leaving fluid as price action develops and wave A ends.
Wave (C) took some convincing for me to place. I typically like to see a retrace point at 61.80% on the fibonacci for a satisfied correction. Matching that with the larger typical wave 4 ending point I see corrective wave 4 being a slightly extended wave with both wave 4 and the (A)(B)(C) finding an end point in the green box at the bottom.
This end point would line up with E.W. rules, but also is verified through the Volume Profile (Right side) value area and prior consolidation range.
4. Conclusion
Elliott Wave Theory is exactly that, a theory. Not absolute or undeniable.
As with all trading strategies and indicators nothing is absolute. However, technical analysis requires you to take all data present and confirm it through multiple data sets and inputs. As I begin to explore more ways to do analysis in my trading career I find something every few years that allows me to fine tune and expand my accuracy with my analysis.
I believe there is a method that is rarely used to place E.W.'s correctly. That being said, they are still subjective no matter the accuracy of placement with E.W.'s when following their data-set rules. It also requires a lot of focus and analysis to properly identify and accurately project the moves that doesn't always play out due to their subjective nature & complexity, not to mention any unpredictable events that may occur.
As with any setup, there is a proper way to trade. None of the trade opportunities are detailed in this, there is more to trading than just seeing entries and exits and placing orders without considering proper entry and other factors including E.W.'s subjective nature. As the price action continues I will try my best to update publically the trades I am taking and the proper entry, stop loss, and take profit for each swing.
If this plays as I have detailed and support holds, then I have several visible factors I have been searching for to confirm the bottom of our bear market and the beginning of a bull market. I will update those in a later post that is more detailed on the overview of our correction cycle.
Thank you for reading and please be sure to click like on this analysis. Thank You!
This is not financial advice, this is simply my personal analysis of the current conditions.

WAITING FOR A REVERSAL TRIGGER ON EURAUDEURAUD hit my target on the corrective structure break and is trading at the previous high. This indicates a strong possibility of a reversal soon.
Contact me via direct message for further analysis
Cheers
Linton

DIA Confirms Resistance Breakthrough -- Market BULLISHAs stated in a previous post regarding AMZN's breakthrough, it is necessary for the price to display a confirmation movement in order to be qualified as bullish.
Looking at the circled area, it is very evident that this confirmation was made today as DIA bounced off of the previous resistance directing itself back upwards.
It will take a week or two for a steady support curve to be established, but I would certainly expect bullish activity for quite some time.
(Given that no major political plays come into perspective.

Swing Key Levels USOIL 03/09/2018The USOIL just hit a supply level from the higher time frame (weekly).
I prefer to wait for a confirmation in order to take a sell position. the support
Below is my confirmation zone, if the price will break that level it indicates the price
Tends to reach the support below and even the demand at the bottom.
If that happens I'll look for P"A setup for sell, my first target will be the support below,
And the final target is the demand at the bottom.

USD/JPY - Confirmed BreakdownAs a continuation of the previous USD/JPY idea, we have our breakdown now and the short time is now. Let's watch the price action progress over the next few days.
Entry point and Stop level indicated on the chart at time of idea creation. Profit target will be taken discretionarily (no set target) according to how price can go.
Stay tuned!

USDJPY 4H Buy ConfirmationProfit Generator
Income Trend Signals
USDJPY on the 4H timeframe has just started a new uptrend, currently we have received the BUY signal that we are after.
Heavy buying momentum.
High potential BUY opportunity.
-CoderX Studio

BTC UPDATE: Massive IHS incoming?Good evening! A while ago I posted a chart stating I thought the Inverse Head and shoulder pattern is likely to fail. Well, I think I MAY have been wrong! That massive green candle is getting us closer to validation and the target. There has been some talk about an even larger one in play so I took a look. From what I see, it is definitely valid so far. If we continue this bullish strength and high volume on the pushes, it MAY play out. You could consider it a complex head and shoulders (almost has two heads.) Please see the notes created for key indicators that the pattern is valid.
Remember, IHS or HS, the pattern is NOT confirmed or valid until the right shoulder completes with good volume and closes a candle above the neckline. If this is the case, it could send us all the way above 9k, right at the Fib noted.
If that were the case, I imagine FOMO might kick in hard and we will test 10k again.


Augur VS Bitcoin Long-Term Uptrend ContinuationYesterday Augur has formed a double bottom near btc 0.0046. This is the 78.6% Fibonacci retracement level which has been rejected previously, back on the 29th of May. But yesterday, REP/BTC not only rejected Fib support but also the 8/1 Gann Fan trendline.
Today Augur started to move up sharply, but in order to confirm the uptrend, price has to break and close above the downtrend trendline as well as the 200 Moving Average. In this case the probability of an uptrend will grow substantially which could attract a lot of buyers, thus sending price much higher.
At the same time it is important to watch btc 0.0046 area, as break and close below might invalidate bullish outlook and send Augur back to btc 0.0034 support area.

EURAUD Short Confirmed and Developing MomentumEURAUD Short is confirmed. Correction is nearing end but can last another hour or so but should be seeing another momentum push downwards towards our first target shortly. 2nd target is a potential but if reached will happen over several larger corrections.

higher low/higher high triggered need 1 additional higher lowWe have achieved the followup higher high after the higher low I mentioned in the last idea. It seems like btc is content on maintaining its fractal of 2014's behavior for now. We still want one additional confirmation higher low to hand control over to the bulls but I bought back in at 5890 as soon as I saw that higher low...not typically what I would normally do I would usually wait for at least a higher high before I jumped back in but it was my confidence in the fact that things were continuing to play out like 2014's bear market did that gave me the confidence we would be going up first. Keep in mind just one follow up lower low can be enough to hand the reigns back over to the bears which is why its so important to get that additional higher low after the current higher high. for the bulls I look for a higher low/higher high and then 1 more follow up higher low for confirmation of a trendshift. For the bears since they have gravity working in their favor I usually only wait for just the first lower high/lower low and don't wait for the follow up lower low. Hopefully if this price action maintains its close fractal similarities with 2014 we can make it to 9.7k or so within the next month before we see any further significant downtrend...Anything is possible though so we will have to wait and see and be prepared for all possible outcomes. Even though I'm listing this as long I won't be surprised if we soon enter a small correction, I'm just thinking it is likely that correction will form an additional higher low and continue the uptrend...hence the long. As always this is not financial advice...make your own decisions and good luck with whatever you decide.

#USDCHF go long if price move over 0.98889 as we can see in 1 hour time frame macd and rsi exactly moving toward each other and also channel break out strategy also confirming that. but i suggest wait till price cross the first resistance and toward upside then go long and wait to see what pair will face in second resistance...

Clams Facing Massive SupportToday CLAMS has reached 11 months low, hitting $2.27 level. This is the key support level for CLAM/USD, that has been rejected for at least 4 consecutive times during the past year. During that year price has moved in cycles, producing up and down waves.
If this cycle will continue the next wave could be starting shortly and confirmation of that could be the break above the descending channel.
At this stage price could either start to consolidate, move slightly lower, potentially to test $2 psychological support, or start a sharp rise. But it is certainly an interesting timing for CLAMS, and if support are will hold and price will stay above the $2, price might go up towards the previous support level at $13 area.

CADJPYBased on what price is doing, we see the market moving in a bullish direction with a constant rejection of level 84.000 confirms the bullish movement.

XAUUSDBearish trendline has been broken and the following day has closed bullish, this confirms bullish movement.
Will be entering with caution.. Risk Management will be applied

Confirmation Zone USDJPY 22/05/18After the recent uptrend, i prefer to look for the reversal opportunity.
If the price will breakout the confirmation zone it's a sign of changing momentum,
It is also a sign that the price tends to reach the demand below and maybe the one at
The bottom, In that case, I'll look for P"A setup for sell position, my first target will be
The demand below and the final target is the demand at the bottom.

Gold/Usd Long term Trend Line being Respected on a Daily and 4 hour time frame.
Retested the 1283 price and kept rejecting.
currently playing in test the price of 1293.
expect the Rally to continue, Next target of 1302 area.
if achieved we will see prices return to the 1320 and then higher.

Bitcoin... Bearish Outlook Still, Educational Analysis Inside.Again for all the Bulls out there, I applaud you for the optimism but CONFIRMATION is CONFIRMATION. My confirmation of this bearish trend reversal is the Daily Ichimoku cloud break. (Senkou Span B or Lead 2 seen below)
Daily (below) with Ichimoku, 50 & 200 MA.
As can be seen we rest on the Senkou Span A (Lead 1) which has also wicked off of the Base Line in pink. (Kijun-sen)
Volume is less then convincing on the Daily and the more we test this area the more we are likely to break below . There are no Volume divergences showing on the daily and the sell off generally matches on smaller time frames. The only way we pick up into the cloud is if the Chaikin Money Flow and On Balance Volume ( See past posts by me for tutorials on how to use them ) show a heavy increase matching the prior rallies into the daily Kumo. It is entirely possible but Technical Analysis requires you to use the data in front of you. Watch for a Chaikin Money Flow and On Balance Volume increase on the 4 hour and above to spot a daily increase early.
The 12 Hour below shows a Bearish TK cross on the Ichi that happened around 41 hours ago. The daily 50 & 200 Moving averages crossed Bearish March 30th on the daily. The 12 Hour has crossed back and forth but are beginning to merge closer yet again for a bearish move. However these are extremely lagging in relation to Bitcoin's movement and I expect a drop to transpire before that takes place as usual.
The 6 Hour below shows us a semi formed Bearish continuation pattern, Volume has had a slight uptick but needs more to pull out. The Stochastic and Relative Strength Index still have some room to drop.
The 4 Hour below. One thing I have noted personally is we wicked off the 4 Hour Conversion line (Tenkan-sen) in orange when the market became semi overbought. I say overbought because there was no real volume to match the slight rally. (Perfect spot if you were watching to set a short position.)
On the Hourly below everything generally matches as far as divergences go, The Stochastic shows a slight variance but nothing noteworthy. Buy pressure is picking up on the Chaikin Money Flow so I do see it entirely possible that we touch the top of our triangle which sets up a entry for a short.
Conclusion
I base my entries and trends off of confirmation, many traders take one indicator and use that as their confirmation, my ultimate confirmation as mentioned above is the daily Senkou Span B or Lead 2 break. From there we have very little stopping us.
BITSTAMP:BTCUSD
I am looking for a break down from our current price of $8,270 to $8,150 and then down to stronger support at $8,000. We sit right at a key level that needs to hold, once those targets are reached I will reassess my current positions and see if there are any short term Bullish movements. Until then I remain Bearish and if we break down below above mentioned support then I expect a retest of $6,500 fairly quick.
Since I have been riding this position for a bit my take profit is set at the top of the triangle at $8375 in case we break bullish. ALWAYS USE STOPS AND TAKE PROFIT ORDERS.
Slap a like and follow on this for me even if you don't agree. :)

GDOW: Global Dow Step UpGDOW Global Dow (USD) Step Up
The Dow Global has made a similar pattern to the Dow itself with a double bottom at 2970,
the second bottom picking up the longer term parallel. Since then it's got itself trapped
within the same triangle formation we see on the Dow, still using the lower parallel as
ultimate support on down-side tests.Whilst it continues to do so the longer term trend
remains in tact.
This index has behaved in text-book fashion as the great rally progresses, with each
decline being arrested by the previous high, and moving North in a series of steady steps.
The next big test comes on the next touch of the falling dynamic (which defines the upper
boundary of the triangle formation).
At some point soon this challenge will arrive - even if it gets rejected again one more time
this rejection is likely to be the last and should be short lived if we do see it happen first.
Once it does so it should rally with all world markets to 3109 and consolidate there awhile.
A break above 3110 would in turn be the next near term bull signal for world markets in
general, opening the way for a rally back to the ATH at 3322.
This has, so far at least, been a very reliable confirming back-up signal for other major
markets across the globe.
When it breaks higher it's therefore the confirming signal to get long of your local market too.
We're looking at a 10% average rally across all major stock markets when it triggers.
Yours might do even better ...
Be lucky.

Swing analysis USDCAD 30/04/18After the recent uptrend, I prefer to wait for reversal signal,
First thing I'm waiting for is to see the support zone breaking,
If that happens I'll look for P"A setup of sell position, my first target
Will be the demand below and the final target will be the demand at
The bottom, the one at the bottom is also a great level of buy position.

Confirmation Level NZDUSD 25/04/18After the recent downtrend in NZDUSD, I'll prefer to wait for reversal
Opportunity, the first signal for the price to change his momentum is
The confirmation zone, if the price will break this resistance above it
Indicates the price change his momentum and now tends to reach the
Supply at the top, if that happens I'll look for P"A setup for buy position,
My final target will be the supply at the top.
