Long/Buy AUD/USDQuick and simple analysis. Wait for rejection of the support before going long. Multiple rejections will indicate a reversal and an uptrend.
If support breaks and then retested-close out position. Keep stop loss at 30 pips below support.
Confluence

USDJPY channel break with interesting targets...Last week gave a break to the downside of an ascending channel on this pair. we also took out (and pulled back) an ascending Trendline in the process.
What i like about this setup is that the fib ext targets sir right on the low of the previous rally.
Fridays daily close also presented a bearish engulfing candle.
We can see the MACD gave a clear indication that the channel was weakening.
I will be looking for shorts on this pair the coming week - The potential pull-back area is not "set in stone", just a reference. As above, i will be looking for confirmation to short this pair.

USD/MXN Confluence AnalysisWe have a Confluence of Four Types of Support in the 20.80 - 20.90 area which indicates that we may have a lot of Buyers in this area. This alsoo means there could be a lot of Unfilled Buy Orders in this area. The next Demand Level of Buyers is at the Horizontal Support. This area has been tested only once, so it is a fresh buying level.
The price has been in a Descending Channel for sometime now, so we are looking to buy at the bottom of the Channel.
The Green Circle is the Confluence of Support and the best place to buy.
A Quasimodo Fakeout Pattern as formed as well on the Chart with two Equal Highs, S1 and S2. As usual, we expect the price to fill the Void and trap a lot of Traders.
A Strong 61.8% Fibonacci Level on the Weekly Timeframe also adds more confirmation to our Setup.
We have a High Probability Setup for a nice Buy Trade!!
As usual we enter with a tight stop loss to reduce our risk, in case the market reverses and changes direction. Don't forget to use good risk management too. Cheers!!

Cable Confluence On Support Creates Great Long Opportunity!All info can be found on the chart. DMs are open!

Long on Pullback | Strong Zone of Confluence-Descending TL breakout confirmed, retest expected
-Respectable ascending TL
-0.618 fib retracement
-Previous S&R area
-MA50 momentum shift early indication

AUDCHF Long on Pullback-Descending TL breakout, retest and further upside expected
-Previous resistance now acting as support
-0.5 fib retracement
-Respectable ascending TL
-MA50 supporting the bullish momentum

Long on Pullback-Respectable ascending TL, retest and continuation expected
-Secondary descending TL breakout
-0.618 fib retracement
-Previous are of S&R
-MA50 & MA100 momentum shift early indications

EURJPY Short on Pullback Following the previous breakout of the ascending wedge, market confirmed its momentum shift to the downside and we will be looking to enter shorts on a pullback to retest the previous area of S&R in confluence to the 0.618 fib retracement and the 50MA as indicated on the chart.

Short on Pullback-Respectable descending TL
-Ascending TL breakout, retest expected
-0.618 Fib retracement
-Previous support now acting as resistance
-MA50 shifting momentum to the downside

Long on Pullback Setup-Respectable ascending TL, retest expected
-0.618 fib retracement
-Previous resistance now acting as support
-MA50 supporting bullish momentum

Long on Pullback SetupLooking to enter longs on:
-Back of the broken descending TL
-0.5 Fib retracement
-Previous area of S&R
EURUSD | PERSPECTIVE FOR THE NEW WEEKRunning 90pips in the opposite direction of my last speculation; The euro surged to a new high against the dollar on Friday and looked to close above a key level that could signal further gains amid optimism about stimulus and President Trump’s recovery.
Tendency: Uptrend (Bullish)
Structure: Trendline | Breakout | Supply & Demand
Observation: i. Bullish Trendline on the chart guides price from below through Key level @ $1.17500 to close above last week.
ii. Looking forward to a correction followed by a trend continuation.
Trading plan: BUY confirmation with a minimum potential profit of 400 pips.
Risk/Reward: 1:5
Potential Duration: 4 to 10 days
NB: This speculation can be considered to make decisions on lower timeframes.
Watch this space for updates as price action is been monitored.
Risk Disclaimer:
Margin trading in the foreign exchange market (including foreign exchange trading, CFDs, etc.) has a high risk and is not suitable for all investors. The content of this speculation (including all data) is organized and published by me for the sole purpose of education and assistance in making independent investment decisions. All information herein is for your reference only and I take no responsibility.
You are hereby advised to carefully consider your investment experience, financial situation, investment objective, risk tolerance level, and consult your independent financial adviser as to the suitability of your situation prior to making any investment.
I do not guarantee its accuracy and is not liable for any loss or damage which may result directly or indirectly from such content or the receipt of any instruction or notification therewith.
Past performance is not necessarily indicative of future results.

Pullback Setup for Monday | Long Opportunity on TL Retest-Descending TL breakout, retest expected
-0.618 fib retracement
-Previous resistance now acting as support
-MA50 bullish momentum shift

Short on Pullback-Corrective structure breakout, expecting retest on the back of the ascending TL
-0.618 fib retracement
-Previous support now acting as resistance
-MA50 supporting bearish momentum

ZECUSD Fibonacci Level 0.382 Price Level 70.36644460ZECUSD Fibonacci Level 0.382 Price Level 70.36644460

EUR/GBP Quick AnalysisThis pair has formed a "Falling Wedge" Pattern. The retracement move has been continued for about 3 weeks now. Now, Buyers should be preparing to take control again.
We have a Fresh Demand Zone at the 0.9000 area which should contain some Unfilled Buy Orders.
The Market created a Fakeout pattern to trap Buyers at the FakeOut Zone line. The fake support at S1 and S2. All Supply and Demand Traders know that every Gap must be filled. Now if you look at the Chart, you can see that the Price has now gone to fill the Void.
We have a Very Strong Confluence of Support at the 0.9015 - 0.9040 Area (Five Types of Support)
Strong Horizontal Support
Trendline Support (Bottom of the Falling Wedge)
38.2% Fibonacci Support Level (On the Daily Chart)
Pivot Point Support 2 (S2)
61.8% Fibonacci Support Level (H4 Chart) at 0.9030
The Trading Environment is a Trending Market.
We also have an Harmonic Pattern that has been formed on this H4 Chart. The Harmonic Pattern formed is the Bearish Crab. This Pattern is also telling us to buy at 0.9033. More Confirmation!!
Five Types of Support and an Harmonic Pattern!!
We have a High Probability Setup for a nice Buy Trade!!
As usual we enter with a tight stop loss to reduce our risk, in case the market reverses and changes direction. Don't forget to use good risk management too. Cheers!!

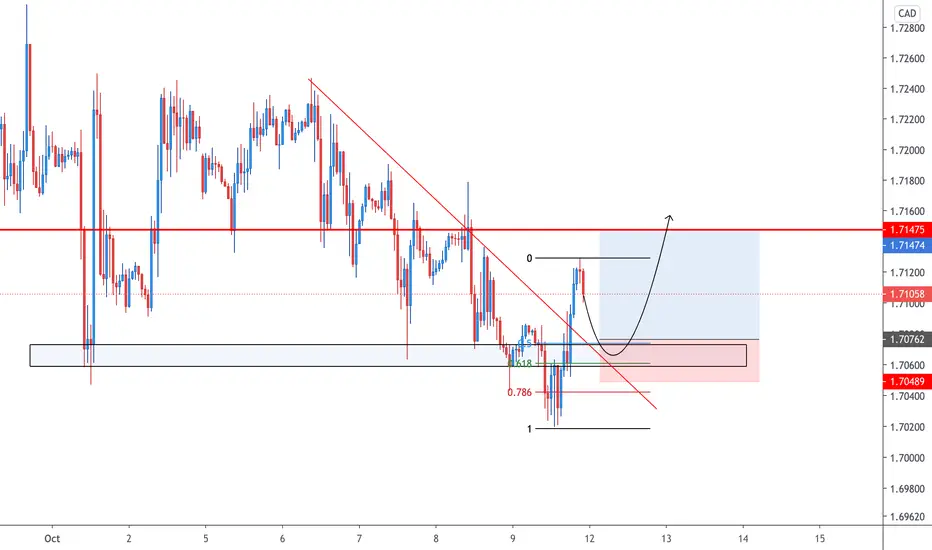
Very Nice Set Up On USD CADAs you should know by now we like our key levels with confluence.
So what we see here... trend line plus confluence so we go long.
Been smashing it every week. Hit me up x

EUR/AUD Quick AnalysisThis pair is in a Downtrend forming a Bearish Expanding Channel. The Uptrend has ended long time ago and now Sellers are in control of the this pair.
The next Demand Level of Buyers is at the Horizontal Support. This area has been tested only once, so it is a fresh buying level.
We also have a very Strong Confluence of Support in the Green Circle which means there could be a lot of Unfilled Buy Orders in this area.
Strong Confluence of Support (Five Types of Support):
61.8% Fibonacci Support Level on H4 Chart
61.8% Fibonacci Support Level on H1 Chart
Trendline Support (Bottom of Channel)
Strong Horizontal Support
Pivot Point Support 2 (S2)
We should prepare to buy when price gets to our Buy Area (The Green Circle in the Chart).

EURUSD Intraday Buy Oct 1EURUSD is continuing it's move higher and has recently broken above resistance and retested as support. Price is above the 14 EMA.
Risk 20 Reward 30 pips. Entry 9am.
I am not a financial advisor. This is not financial advice. This is for educational purposes only.

EURUSD just hit this weeks high 1.17400 (Idea)I drew this up last night thinking it would happen during the london session. But after today's confluence of the bullish day trade reached it's pivot point was the exact same Weekly Bearish Omptimal trade entry.
Todays Bull trade, entry at 1.6940 was the 62% retracement around 8:30 A.M. Eastern time. That same fibonacci's pivot point meets the the 70.5 percent retracement from last weeks swing high and low.
Todays Bull trade
The Zone I drew Up last night
Confluence of Both Fib Levels
In the main window is the weekly bearish trade. You still have time to enter.

EUR/GBP market setupPrice has extensively fallen into the -27.3% fib region where we are currently seeing some candlestick rejections. We could see some retracement into the targeted region, likely into the 0.9100 psych level.
risk/reward ratio is tight

EURUSD: Fakeout or Breakout?Daily Time Frame: Price had broken below 1.17500 key psychological support with strong bearish pressure. If bears are back in this market, we can anticipate price coming down further. Look for pullbacks to 1.17000-1.17500 for potential selling opportunities. Due to the uncertainty of market fluidity, risk management is highly recommended.

EURGBP: Testing Support!4hr Time Frame: Reading price we can see that EURGBP is testing at .91000 psychological support in confluence with a double bottom formation. If price manages to hold above and show signs of bullish rejection, we can then look for potential long opportunities. However, if price breaks support look to reevaluate price action. Due to the uncertainty of market fluidity, risk management is highly recommended.
