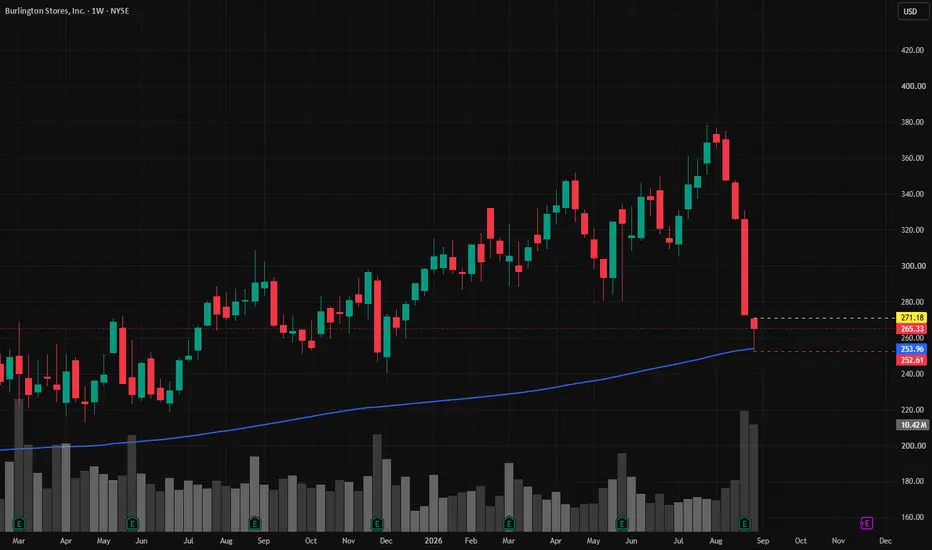
BURL | Continued stock growth- Timeframe: Weekly
- Trade type: Buy stop order
- Price: 271.18
- Take Profit: Open
- Stop Loss: 252.61 (-6.90 %)
Idea: Long on a breakout above last week's high - bullish momentum continuation.
Entry: Buy stop above last week’s high.
Stop-loss: Below the low of the same candle.
If the weekly candle closes below this level, the trade is invalidated.
Take Profit: Trailing stop following the lows of new weekly candles.
Consumerdiscretionary
AMC | The time to go long has come- Timeframe: Weekly
- Trade type: Buy stop order
- Price: 2.78
- Take Profit: Open
- Stop Loss: 2.54 (-8.60 %)
Idea: Long on a breakout above last week's high - bullish momentum continuation.
Entry: Buy stop above last week’s high.
Stop-loss: Below the low of the same candle.
If the weekly candle closes below this level, the trade is invalidated.
Take Profit: Trailing stop following the lows of new weekly candles.
VSXY | Continued stock growth- Timeframe: Weekly
- Trade type: Buy stop order
- Price: 89.98
- Take Profit: Open
- Stop Loss: 83.18 (-7.60 %)
Idea: Long on a breakout above last week's high - bullish momentum continuation.
Entry: Buy stop above last week’s high.
Stop-loss: Below the low of the same candle.
If the weekly candle closes below this level, the trade is invalidated.
BROS | Continued stock growth- Timeframe: Weekly
- Trade type: Buy stop order
- Price: 52.00
- Take Profit: Open
- Stop Loss: 48.07 (-7.60 %)
Idea: Long on a breakout above last week's high - bullish momentum continuation.
Entry: Buy stop above last week’s high.
Stop-loss: Below the low of the same candle.
XLY Breakout Front Run Swing TradeXLY continues to trade in a range below ATHs. With NASDAQ:AMZN as a primary driver for potential continued bullish momentum.
Stop is below higher pivot low
T1 is new ATHs
T2 is 139
T3 is 156
Final target is 197
This is a long term swing trade and will be managed accordingly
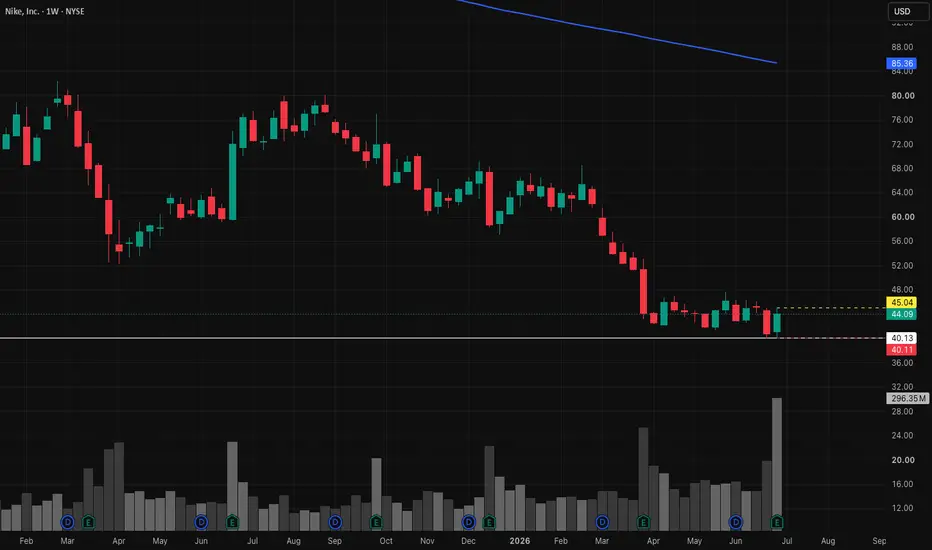
NKE | The time to go long has come- Timeframe: Weekly
- Trade type: Buy stop order
- Price: 45.04
- Take Profit: Open
- Stop Loss: 40.11 (-10.90 %)
Idea: Long on a breakout above last week's high - bullish momentum continuation.
Entry: Buy stop above last week’s high.
Stop-loss: Below the low of the same candle.
If the weekly candle closes below this level, the trade is invalidated.
Take Profit: Trailing stop following the lows of new weekly candles.
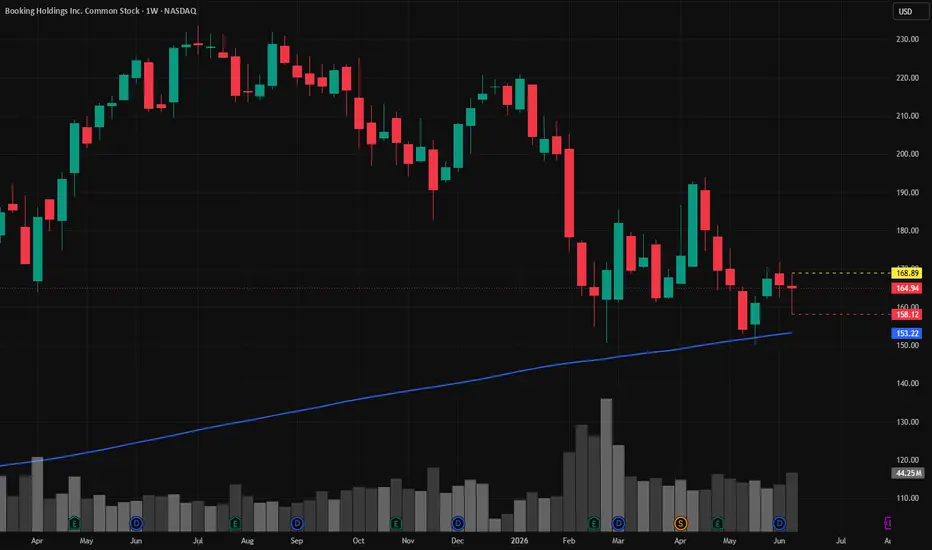
BKNG | June, 2026 | The time to go long has come- Timeframe: Weekly
- Trade type: Buy stop order
- Price: 168.89
- Take Profit: Open
- Stop Loss: 158.12 (-6.40 %)
Idea: Long on a breakout above last week's high — bullish momentum continuation.
Entry: Buy stop above last week’s high.
Stop-loss: Below the low of the same candle.
If the weekly candle closes below this level, the trade is invalidated.
Take Profit: Trailing stop following the lows of new weekly candles.
Feel free to like and share your thoughts in the comments! ❤️
Potential outside week and bullish potential for CBOEntry conditions:
(i) higher share price for ASX:CBO above the level of the potential outside week noted on 15th May (i.e.: above the level of $4.18).
Stop loss for the trade would be:
(i) below the low of the outside week on 13th May (i.e.: below $3.63), should the trade activate.
DECK: Symmetrical Triangle & Double Bottom Breakout Eyed Above $Macro Picture & Market Structure
Deckers Outdoor Corporation (DECK) is showing an incredibly clean market structure right now, sitting in a prime location for a high-reward swing trade. After a period of consolidation, the price action is compressing into a well-defined symmetrical triangle, right at a critical inflection point.
Technical Catalysts
The Double Bottom ("W" Pattern): Looking at the chart, a clear double bottom has formed. We have successfully broken out of the "W" neckline, signa
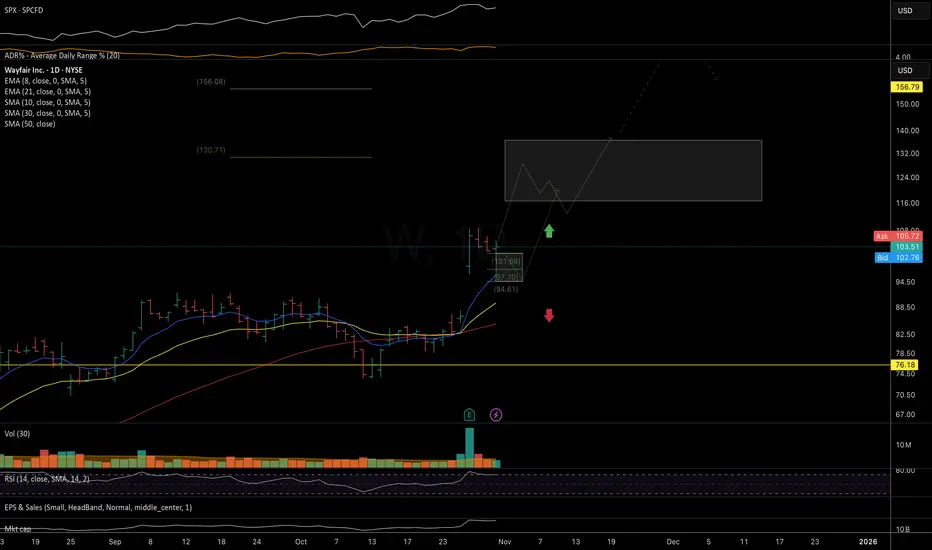
W: watching for upside momentum to continue Strong uptrend linearity with three days of low-volume sideways drift following the recent gap-up move.
As long as price holds above the 100–94 local support zone, I’m looking for upside momentum to continue toward the next potential resistance levels at 116–130–140, with a possible extension into the 185+ region.
Chart:
Chart (Macro view):
Daily Consolidation Potential Reboundsince the weekly reversal in favor of bears for AMEX:MJ etf and cannabis stocks, the daily bounce has turned back downward, and is approaching recent multi week lows.
this set of oscilatiry trend regularity indicators show when there is potential for retracement in the opposite direction should these levels hold.
GPRO goes to earnings LONGFrom the 2H chart GPrRO is in early reversal two days before earnings
sitting at a bottom on the POC line of the volume profile. The MAC profile
shows a line cross under a small histogram. Right now momentum is subtle
and sluggish but could accelerate quickly in the approach to that earnings
report. Based on the chart, I will target the July 18th pivot high and set the
stop-loss under that POC line.
Ford Motor Company (F) - Multi Pattern AnalysisCompany: Ford Motor Company
Ticker: F
Exchange: NYSE
Sector: Consumer Discretionary
Introduction:
Today's technical analysis takes a look at Ford Motor Company (F), a prominent player in the Consumer Discretionary sector, listed on the NYSE. A complex formation is unfolding on the weekly chart where a long-term Head and Shoulders pattern encounters a shorter-term Descending Triangle. This unusual setup, featuring a recent breakaway gap, may suggest a bullish trend reversal.
Head and Should
$IWM Outlook 05/30 - 06/02 @capgainsgroupAs the S&P 500 and the NASDAQ rally into the green for the year, the Russell 2000 (aka the small cap index) has lagged behind and is barely green at +1.03% YTD for 2023. One of the reasons why this index hasn’t been doing well can be attributed to the index’s 15.18% allocation in the Finance Sector. Failing regional banks such as Silicon Valley Bank ( NASDAQ:SIVB ) and Signature Bank ( OTC:SBNY ) haven’t helped the index much.
Investors who would like to play the Russell 2000 should pay attenti
bed bath and from beyond the graveits no secret that if a company has a lot of brick and mortar stores in closed down, or dying malls and shopping centers that said company has taken a hit over the past decade. BBBY is not an exception, and its a matter of time before the party is over for this bounce. im looking at the adaptive moving strategy to get a better picture of trend regularity in an outlying move. ive highlighted the conditions that are ideal on the left. the breakout that led to this upswing started there. ive marked
BShort
WANT | Consumer Discretionary | BullishThe Advisor employs a replication strategy. The fund generally invests substantially all, but at least 95%, of its total assets in the securities comprising the index. The index includes securities of companies from the following industries: retail; hotels, restaurants and leisure; textiles, apparel and luxury goods; household durables; automobiles; auto components; distributors; leisure products; and diversified consumer services. It is non-diversified.