HnL GUFresh HnL level on GU with DXY bearish reversal in mind, SL flexed to 15 pips to count for volatility
Contains image

Nifty Analysis EOD – November 26, 2025 – Wednesday🟢 Nifty Analysis EOD – November 26, 2025 – Wednesday 🔴
The “Greenest Day”: Open = Low and a One-Sided Rally Towards ATH.
🗞 Nifty Summary
Responding strongly to positive news and global market cues, the Nifty started with the formation of Open = Low (25,842.95) and launched a relentless, one-sided rally toward the 26200 level. Many traders were expecting a dip at resistance, but this slow, steady, and strong northern run kept pushing upward.
After a long period, all indices traded firmly in the green. The index closed powerfully at 26,205.30, adding a massive +320.50 points (+1.24%).
The sheer magnitude and structure of the move—a full-body bullish candle—raises the key questions: Was this heavy short covering on the first day of the new expiry, or genuine fresh institutional long positioning? The move has been stunning, and the Nifty is now right on the doorstep of the All-Time High (ATH).
🛡 5 Min Intraday Chart with Levels
🛡 Intraday Walk
The Open = Low condition immediately signaled aggressive buying and zero morning hesitation. The rally consumed all previous resistance levels from the past two days with minimal effort.
This strongly imbalanced market structure created a challenging trading day for those expecting a retracement. The steady climb, driven by strong volumes, suggests high conviction behind the move. The focus now shifts entirely to the imminent challenge of the All-Time High at 26277.
📉 Daily Time Frame Chart with Intraday Levels
🕯 Daily Candle Breakdown
Open: 25,842.95
High: 26,215.15
Low: 25,842.95
Close: 26,205.30
Change: +320.50 (+1.24%)
🏗️ Structure Breakdown
Type: Strong Bullish candle (Marubozu).
Range (High–Low): ≈ 372 points — high volatility and decisive trend strength.
Body: ≈ 362 points — reflecting powerful upside momentum with strong institutional buying.
Upper Wick: ≈ 10 points — buyers held control till the very end, minimal profit booking near the close.
Lower Wick: ≈ 0 points — the market never traded below the open (Open = Low), indicating aggressive, non-stop buying from the first minute.
📚 Interpretation
This is a textbook signal of extreme bullish conviction. The Marubozu-like structure completely engulfs several previous days’ candles, negating the recent bearish retracement and confirming the continuation of the primary trend. The focus now is on follow-through; a move of this strength often precedes an immediate challenge of the next major objective.
🕯 Candle Type
Marubozu Bullish Candle
🛡 5 Min Intraday Chart
⚔️ Gladiator Strategy Update
ATR: 210.90
IB Range: 195.5 → Big
Market Structure: ImBalanced
Trade Highlights:
09:45 Long Trade - Target Hit (R:R 1:2.94)
Trade Summary: Given the powerful one-sided nature of the move, the strategy quickly identified the bullish imbalance and captured the core directional move with a high R:R long trade, performing perfectly in a trending market.
🧱 Support & Resistance Levels
Resistance Zones:
26220 (Immediate Resistance)
26277 (All-Time High / Key Hurdle)
Support Zones:
26104 (Previous Strong Resistance, now first support)
26030
25985
25930 ~ 25920
🧠 Final Thoughts
“Frozen by the move? Now, plan for the ATH breach.”
The market has cleared all immediate resistance and is poised to challenge the All-Time High (26277). Given the strength of today’s close, the bias for Thursday is strongly bullish.
We must watch for an immediate follow-through above 26220. If the market fails to breach the ATH (26277) on the first attempt, a minor dip back to the 26104 support would be healthy before the next attempt.
✏️ Disclaimer
This is just my personal viewpoint. Always consult your financial advisor before taking any action.

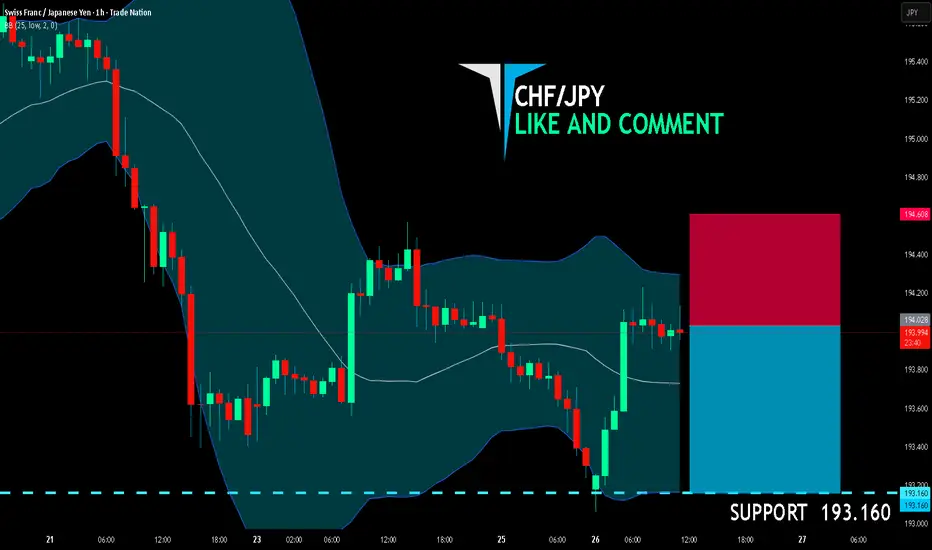
CHF/JPY SHORT FROM RESISTANCE
CHF/JPY SIGNAL
Trade Direction: short
Entry Level: 194.028
Target Level: 193.160
Stop Loss: 194.608
RISK PROFILE
Risk level: medium
Suggested risk: 1%
Timeframe: 1h
Disclosure: I am part of Trade Nation's Influencer program and receive a monthly fee for using their TradingView charts in my analysis.
✅LIKE AND COMMENT MY IDEAS✅
XAUUSD - Bulls Still Stepping In at Demand… Watching the Retest!Gold remains overall bullish, holding firmly above the major support zone around $4,000–$4,050. This entire red area has been acting as a strong demand zone for weeks, with price bouncing from it multiple times, a clear sign that buyers are defending this level aggressively.
📈XAUUSD is also respecting the rising trendline , forming a clean higher-low structure. As long as Gold remains above both the trendline and the support zone, the bullish outlook stays intact. I will be looking for long setups on the next retest of this confluence area.
🏹If buyers step in again, the next move could push toward the previous highs near $4,385. But if price breaks below the support zone and the trendline, the bullish structure would weaken and open the door for a deeper correction.
For now, this zone is the key. Will Gold bounce again… or finally break through support? 🤔
⚠️ Disclaimer: This is not financial advice. Always do your own research and manage risk properly.
📚 Stick to your trading plan regarding entries, risk, and management.
Good luck! 🍀
All Strategies Are Good; If Managed Properly!
~Richard Nasr

NZD/JPY BEARS WILL DOMINATE THE MARKET|SHORT
Hello, Friends!
We are now examining the NZD/JPY pair and we can see that the pair is going up locally while also being in a uptrend on the 1W TF. But there is also a powerful signal from the BB upper band being nearby, indicating that the pair is overbought so we can go short from the resistance line above and a target at 88.001 level.
Disclosure: I am part of Trade Nation's Influencer program and receive a monthly fee for using their TradingView charts in my analysis.
✅LIKE AND COMMENT MY IDEAS✅

CAD/JPY SENDS CLEAR BEARISH SIGNALS|SHORT
Hello, Friends!
The BB upper band is nearby so CAD-JPY is in the overbought territory. Thus, despite the uptrend on the 1W timeframe I think that we will see a bearish reaction from the resistance line above and a move down towards the target at around 109.581.
Disclosure: I am part of Trade Nation's Influencer program and receive a monthly fee for using their TradingView charts in my analysis.
✅LIKE AND COMMENT MY IDEAS✅

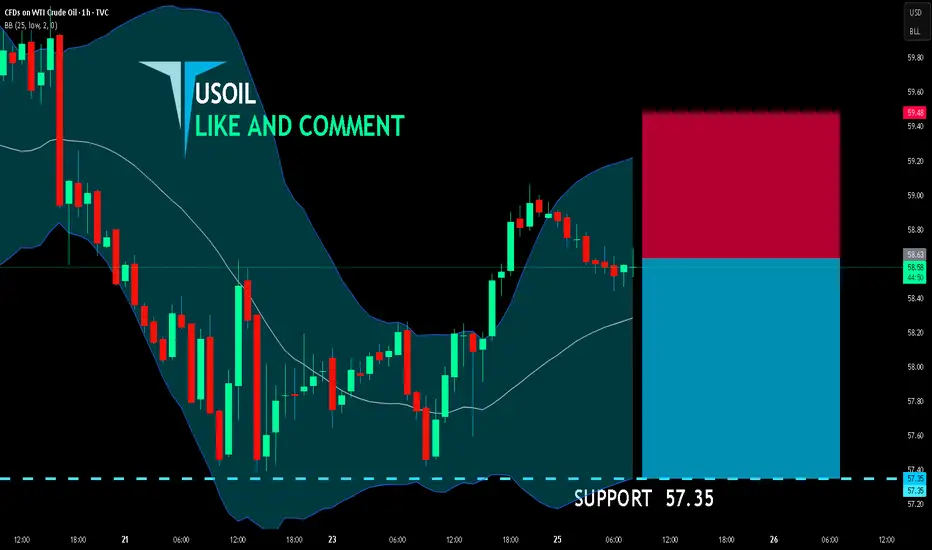
USOIL BEARS ARE GAINING STRENGTH|SHORT
USOIL SIGNAL
Trade Direction: short
Entry Level: 58.63
Target Level: 57.35
Stop Loss: 59.48
RISK PROFILE
Risk level: medium
Suggested risk: 1%
Timeframe: 1h
Disclosure: I am part of Trade Nation's Influencer program and receive a monthly fee for using their TradingView charts in my analysis.
✅LIKE AND COMMENT MY IDEAS✅
NZDCHF: Bearish Move From Trend Line 🇳🇿🇨🇭
On a today's live stream, we discussed a trading setup on NZDCHF.
There is a high chance that the pair will retrace from a solid falling
trend line on a daily time frame.
Goal - 0.456
❤️Please, support my work with like, thank you!❤️
I am part of Trade Nation's Influencer program and receive a monthly fee for using their TradingView charts in my analysis.

TradeCityPro | ATOMUSDT Preparing for a Potential Drop👋 Welcome to TradeCityPro!
Let’s dive into the analysis of ATOM, one of the older coins in the crypto market, which is currently sitting on a very critical support level — essentially its last major support zone.
🌐 Bitcoin Overview
Before we begin, let me remind you once again that at your request, we’ve moved the Bitcoin analysis section to a dedicated daily report — allowing us to analyze Bitcoin’s trend, dominance, and overall market sentiment in greater depth each day.
In the higher timeframes, due to the recent heavy declines across the market, ATOM previously fell all the way to nearly $0, experiencing an extremely steep drop and entering a long consolidation phase afterward.
Right now, price has once again reached the bottom of the range — the key support zone it has respected for a long time. This area, around $2.439, can be considered ATOM’s final line of defense.
🔻 Short Position
A break below 2.439 gives a clear trigger for a short position.
However, confirmation requires an increase in volume to validate the breakdown.
🔼 Long Position
Due to the strong bearish structure, taking a long position is not the preferred option at the moment.
But if price continues ranging and holds this support, a breakout above 2.568 can provide a valid long setup.

XAU/USD maintains bullish momentum–waiting for breakout at 4180🌍 Market Overview
Gold is currently trading around 4,170 USD, continuing its strong upward momentum.
Main drivers:
• USD weakness → money flowing into gold
• Falling bond yields
• Softer Fed expectations → higher demand for safe-haven assets
Gold continues to maintain a bullish structure, forming higher highs and higher lows.
________________________________________
📊 Technical Analysis
🔽 Key Support Zones
• 4148 – 4160 (new support after breakout)
• 4128 – 4135 (stronger support if deeper correction occurs)
🔍 Holding above 4148 is crucial to maintain the bullish trend.
🔼 Resistance Zones
• 4180 (near-term resistance – potential rejection)
• 4195 – 4200 (strong psychological resistance)
⚡ Current Momentum
• Price is above all short-term EMAs → BUYers are dominating
• Increasing volume → steady bullish pressure
• No clear reversal signals around 4164 yet
________________________________________
🔎 Outlook
Main trend: BULLISH
Scenarios:
• A pullback to 4148–4160 before rising would be ideal.
• A breakout above 4180 on H1 close → price may extend toward 4200.
• A break below 4148 → deeper correction toward 4135.
🎯 Trade Ideas
🔺 BUY XAU/USD – Trend-Following Setup
• Entry: 4151 – 4148
🎯 TP: 40 / 80 / 200 pips
🛑 SL: 4145
🔻 SELL XAU/USD – Counter-Trend (Only with rejection candles)
• Entry: 4195 – 4198
🎯 TP: 40 / 80 / 200 pips
🛑 SL: 4201

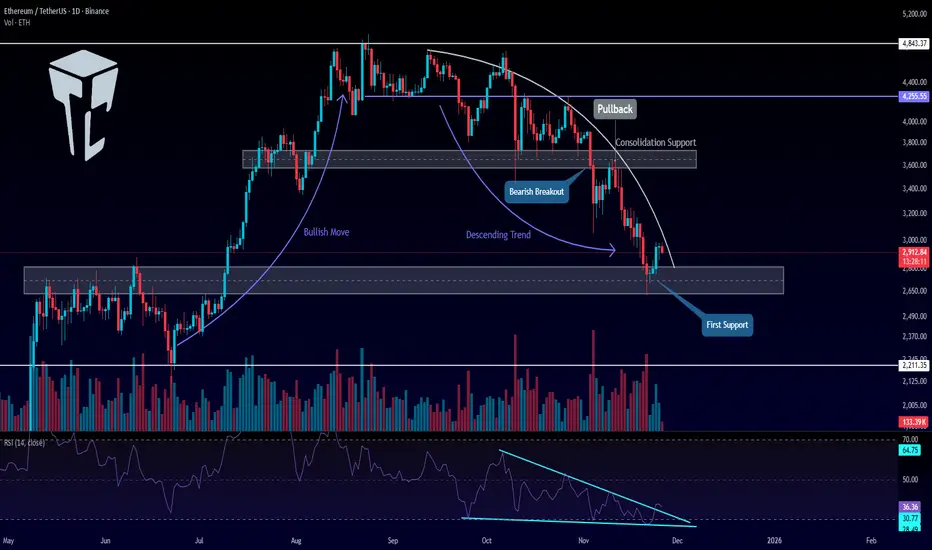
TradeCityPro | Ethereum Eyes Key Levels for Trend Reversal👋 Welcome to TradeCityPro!
Let’s dive into the Ethereum analysis, the queen of the market, ranked 2nd on CoinMarketCap with a $351 billion market cap, right after Bitcoin.
📅 Daily Timeframe
On the daily timeframe, after the upward movement Ethereum made, it reached the 4,843 resistance zone and then entered a consolidation phase.
✅ The bottom of this range was at 3,700, and the middle of the box was at 4,255, which the price reacted to.
🔔 After breaking the lower boundary of the box, the bullish trend Ethereum had came to an end, and a bearish trend with a curved trendline began.
⚖️ After a pullback to the 3,700 zone, a downward move took place, reaching the next support zone at 2,700, and now the price is reacting to the 2,700 zone.
💥 The RSI oscillator formed a descending triangle during this move, which contributed to the increasing bearish momentum in the market.
💡 Now, with the price reaching 2,700, the triangle has broken to the upside, and the bearish momentum has slowed down for now.
🎲 The confirmation of the new bullish momentum will come after breaking the curved trendline and forming a higher high and higher low above the 2,700 level.
📈 The main trigger for Ethereum's bullish trend will be stabilization above 3,700.
⚡️ If the 2,700 level breaks, the next support zone will be at 2,211.
💫 Personally, I’ll try to open a short position on Ethereum if the 2,700 level breaks.
🔼 For a long position, triggers can be found on lower timeframes, but for the main positions, we should wait for the price to form a higher high and higher low.
📝 Final Thoughts
Stay calm, trade wisely, and let's capture the market's best opportunities!
This analysis reflects our opinions and is not financial advice.
Share your thoughts in the comments, and don’t forget to share this analysis with your friends! ❤️
HH HL.HUBC
Closed at 219 (07-11-2025)
HH HL.
Bullish on Bigger tf.
Slight dip can be a buying opportunity;
(210 - 215 probably).
Upside it may show 230 - 240 initially.
But should not break 200 now.

SOLCRYPTOCAP:SOL is looking strong with support holding firmly. From the current level, the setup supports more than 200 percent in potential gains once momentum shifts. This is one of the cleanest support reactions on the chart right now.

XAUUSD Intraday Plan| Breakout Above 4142, Eyes on 4198 Next?Gold has finally broken above the 4142 resistance after a day of consolidation, showing renewed bullish strength. Price is now trading above both moving averages, with the MA50 crossing above the MA200.
If bullish momentum holds, we can expect a retest of 4198, and a clean break above that level would open the path toward 4232 next.
However, if price drops back below 4142, we may see a move back into the consolidation range. A confirmed break beneath that range would then open the door for a deeper pullback into the Support Zone.
📌Key levels to watch:
Resistance:
4198
4232
4274
Support:
4142
4098
4052
4016
3968
🔎Fundamental focus:
Today brings a cluster of important U.S. data releases — Unemployment Claims, Durable Goods Orders, and the Chicago PMI.

Lingrid | GOLD Complex Correction Short SetupOANDA:XAUUSD is testing the 4,150 resistance zone, where price might form a potential fake break. The move stalled right at confluence between the red long-term resistance trendline and the ceiling of the range, signaling possible buyer exhaustion. Price is now slipping back beneath the broken breakout level, suggesting that momentum is shifting back in favor of sellers as intraday structure loses strength.
If bearish pressure continues, TVC:GOLD is positioned to rotate toward 4,095, with the broader correction where the next liquidity cluster sits. As long as price remains capped under 4,160, the downside scenario remains dominant, especially with markets awaiting key USD-driven macro catalysts (PPI) that could strengthen the dollar and weigh further on gold.
➡️ Primary scenario: rejection holds → drop toward 4,095.
⚠️ Risk scenario: a clean breakout above channel flips momentum and opens room toward higher levels.
If this idea resonates with you or you have your own opinion, traders, hit the comments. I’m excited to read your thoughts!

NZDUSD: Time for Pullback 🇳🇿🇺🇸
NZDUSD looks too overbought after a formation
of a huge fair value gap.
I see a clear weakness of the buyers after
a test of a historic daily key level.
Expect a pullback at least to 0.5669
❤️Please, support my work with like, thank you!❤️
I am part of Trade Nation's Influencer program and receive a monthly fee for using their TradingView charts in my analysis.

Lingrid | USDJPY Potential Long After PullbackFX:USDJPY perfectly played out my previous trading idea . Market is pulling back into the 155.88–156.00 zone, aligning with the upward trendline. The recent drop forms a clean ABC corrective pattern, and price is stabilizing right at the structural demand area that previously launched a strong bullish impulse toward the highs. Buyers are defending the trendline, showing early signs of absorption after a controlled retracement.
If this support cluster holds, it is positioned for a continuation toward 157.90, which corresponds to the resistance band and the previous higher high. The broader structure remains bullish, backed by higher-low formation and the intact upward channel, while yen fundamentals continue to lean weak due to ongoing BoJ caution.
➡️ Primary scenario: bullish defense at 155.88 → move toward 157.90.
⚠️ Risk scenario: a decisive break below the trendline will lead to channel border retest.
If this idea resonates with you or you have your own opinion, traders, hit the comments. I’m excited to read your thoughts!

Hellena | EUR/USD (4H): SHORT to the MIN of wave "3" 1.14647.We continue to monitor the decline in downward momentum. In the last forecast the target was almost reached, but the correction turned out to be stronger than we thought, which does not cancel the forecast, but just gives us an opportunity to enter a short position once again quite favorably.
I expect that the small wave “b” is either over or almost over and the price is about to start its decline to the support area at 1.14647.
This movement should be a confirmation of the completion of the large correction (red) “ABC”.
Manage your capital correctly and competently! Only enter trades based on reliable patterns!

EURUSD: Bullish Correction or Trend Reversal? Key Zones BelowEURUSD Analysis – Wednesday, November 26
Welcome traders! 👋
I’m glad to have you here — we’re all learning and growing together in this amazing trading journey.
Let’s dive into today’s analysis on EURUSD 👇
As I mentioned before, the price has already broken the high of the range.
On the weekly timeframe, EURUSD remains bearish 📉.
However, on the daily timeframe, price is still bullish because the structure has broken a swing point and maintains upward momentum 📈.
On the 4-hour timeframe, price has created a Higher Low (HL) and Higher High (HH), confirming a short-term bullish trend.
This means we are primarily looking for POIs (Pro-Q levels) below for potential long setups.
Today, I am following two main scenarios:
Scenario 1
Price may first move up to tap the OB/OBS above, close to the Asia session high 🔼.
After grabbing liquidity, price could pull back toward the POI below, then continue upward with bullish momentum 🚀.
Scenario 2
Price may move down first toward the POI, sweeping liquidity under the Asia session low 🔽.
From there, price may reverse and continue upward in line with the bullish structure 📈.
We also have high-impact news today, so volatility may increase ⚠️.
Always remember: markets are never 100% predictable.
Use strong risk management and wait for clear confirmations before entering.
If you have any questions, drop a comment below 💬.
#EURUSD #Forex #ForexAnalysis #SmartMoneyConcepts #SMC #OrderBlocks #Liquidity #PriceAction #DayTrading #ForexTrader #TechnicalAnalysis #TradingView #FXTrading #MarketStructure #TraderCommunity #ForexSetups #ForexSignal #EUAnalysis

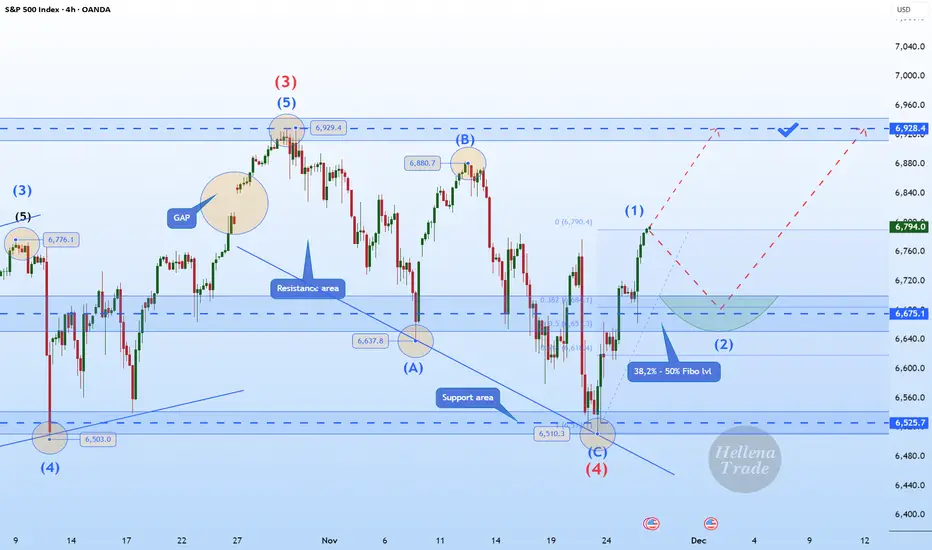
Hellena | SPX500 (4H): LONG to MAX of wave "3" of 6928.Colleagues, we continue the previous scenario of upward movement in the impulse “12345”.
I expect a small correction in the middle order wave “2” approximately to the area of 38.2%-50% Fibonacci levels (6675).
Then I expect a continuation of the upward movement to the maximum of the wave "3" of the higher order 6928.4.
It is possible that the first wave may be stretched, which may mean a correction-free movement to the target.
Fundamental Context.
Market sentiment remains cautiously bullish ahead of this week’s US data releases. Investors continue to price in a softer Fed policy path for 2026, which supports the equity market after the recent correction.
US Treasury yields remain under pressure, and the latest macro indicators — especially labor market cooling and weaker business activity components — reinforce expectations of an economic slowdown. This backdrop typically favors equity upside as markets look ahead to potential policy easing.
Manage your capital correctly and competently! Only enter trades based on reliable patterns!
Trends You Must Know1. Artificial Intelligence and Automation
Artificial Intelligence (AI) continues to dominate global technological advancements. AI-driven solutions are transforming industries ranging from healthcare to finance, logistics, and marketing. Machine learning algorithms can analyze massive datasets to provide insights, detect patterns, and automate decision-making. In business, AI-powered chatbots, virtual assistants, and predictive analytics tools are becoming indispensable for efficiency and customer engagement.
Automation extends beyond digital processes into physical systems. Robotics and smart manufacturing have revolutionized production lines, improving productivity while reducing human error. The growing adoption of AI in creative industries, like AI-generated content, design, and music, is redefining the boundaries of human-machine collaboration. For professionals, understanding AI trends and developing AI literacy has become crucial.
2. Green Technology and Energy Transition
Climate change concerns are accelerating the shift toward renewable energy and sustainable technologies. Governments and corporations are heavily investing in solar, wind, hydro, and hydrogen energy. Energy storage solutions, like next-generation batteries, are crucial for mitigating the intermittent nature of renewables.
Electric vehicles (EVs) are another hallmark of this trend. Automotive giants and startups alike are transitioning from internal combustion engines to fully electric fleets. Beyond transport, green technology extends to sustainable agriculture, water management, and circular economy models where waste is minimized, and resources are reused efficiently.
Companies that adopt sustainable practices often gain market credibility, attract investment, and comply with tightening environmental regulations. For consumers, supporting green products is both a personal choice and a statement on social responsibility.
3. Digital Currency and Blockchain Technology
Cryptocurrencies and blockchain technology have moved from speculative assets to core components of global finance. Central Bank Digital Currencies (CBDCs) are being explored by multiple countries as a means of faster, more secure, and transparent financial transactions. Cryptocurrencies, despite volatility, continue to influence global markets, especially in decentralized finance (DeFi) applications like lending, borrowing, and smart contracts.
Blockchain technology extends beyond finance. Supply chain management, healthcare records, intellectual property, and voting systems are being reimagined with decentralized, tamper-proof ledgers. Understanding blockchain trends is critical for businesses seeking security, transparency, and efficiency in a connected world.
4. Remote Work and the Future of Work
The COVID-19 pandemic permanently altered the work landscape. Remote work, hybrid offices, and digital nomadism are no longer temporary arrangements but standard practices in many sectors. Organizations are adopting digital collaboration tools, cloud platforms, and virtual meeting technologies to support distributed teams.
Alongside this, skills development is evolving. There’s a rising emphasis on digital literacy, adaptability, creativity, and emotional intelligence. AI and automation are also reshaping job roles, eliminating repetitive tasks while creating demand for high-level cognitive skills. Employees and organizations must continuously upskill to remain competitive.
5. Health and Wellness Revolution
The health and wellness industry is undergoing significant transformation. Personalized healthcare, driven by genomics, AI diagnostics, and wearable devices, is empowering individuals to monitor and manage their health proactively. Telemedicine has made healthcare accessible beyond traditional clinic walls, especially in remote areas.
Mental health awareness has gained unprecedented recognition. Companies are investing in employee well-being programs, and wellness apps offering meditation, sleep tracking, and stress management are booming. Nutrition, fitness, and preventive medicine are now integral to lifestyle choices, reflecting a global shift toward holistic health management.
6. Data Privacy and Cybersecurity
As digitalization increases, so does the threat of cyberattacks and data breaches. Consumers and regulators are demanding greater accountability for how personal information is collected, stored, and used. Laws like GDPR in Europe and similar regulations worldwide have raised the stakes for data privacy compliance.
Cybersecurity trends include AI-driven threat detection, zero-trust architectures, and blockchain-based security solutions. Organizations that fail to prioritize cybersecurity risk reputational damage, financial loss, and regulatory penalties. Being aware of these trends helps businesses and individuals protect sensitive information in an interconnected world.
7. Social Media Evolution and Content Consumption
Social media platforms continue to evolve, influencing communication, marketing, politics, and culture. Video content, short-form stories, and live streaming dominate user engagement. Platforms leveraging AI for personalized recommendations enhance content discoverability but also raise concerns about algorithmic biases and misinformation.
Influencer marketing, creator economies, and subscription-based content models are redefining digital entrepreneurship. Brands and individuals must adapt to constantly changing algorithms, user behaviors, and monetization models to stay relevant.
8. Global Economic Shifts and Geopolitics
The global economy is undergoing significant transformations. Emerging markets are growing faster than developed economies, creating new opportunities and risks. Currency fluctuations, trade wars, and supply chain disruptions highlight the importance of geopolitical awareness for businesses and investors.
The de-dollarization trend, with countries exploring alternatives to the US dollar for international trade, signals a possible shift in global financial dominance. Understanding macroeconomic trends, international relations, and regional power dynamics is vital for making informed business and investment decisions.
9. Education and Lifelong Learning
Education is no longer confined to classrooms. Online platforms, micro-credentials, and skill-based courses are democratizing learning worldwide. AI-driven personalized learning systems are improving engagement and outcomes, while virtual and augmented reality tools are making immersive education possible.
Lifelong learning is becoming a necessity rather than a choice. Rapid technological changes require individuals to continuously acquire new skills to remain employable and competitive. Understanding the evolving educational landscape is critical for students, professionals, and educators alike.
10. Cultural and Lifestyle Trends
Cultural shifts influence consumer behavior, workplace dynamics, and social interactions. Minimalism, conscious consumption, and the pursuit of experiences over material possessions are gaining traction. The global rise of diverse and inclusive representation in media, fashion, and corporate policies reflects a broader societal trend toward equity and awareness.
Travel, entertainment, and leisure industries are also evolving with digital experiences, augmented reality gaming, and metaverse explorations. Being aware of cultural and lifestyle trends helps businesses align their offerings with the values and expectations of modern consumers.
Conclusion
Staying ahead of trends is crucial for individuals, businesses, and governments in a world defined by rapid technological, economic, and cultural shifts. From AI and green technology to digital currencies, health innovations, and global economic transformations, these trends are reshaping how we live, work, and interact. Those who understand and adapt to these changes are more likely to thrive in a complex, interconnected future. Knowledge of trends isn’t just about keeping up—it’s about positioning oneself strategically in a world of constant evolution.

The Energy Transition Boom: A Global Shift in PowerDrivers of the Energy Transition Boom
Climate Change and Environmental Pressures
The primary driver of the energy transition is the urgent need to combat climate change. Rising global temperatures, extreme weather events, and the growing awareness of environmental degradation have compelled governments, corporations, and societies to rethink energy production and consumption. International agreements, notably the Paris Agreement of 2015, set ambitious goals for reducing carbon emissions, pushing nations to accelerate the adoption of renewable energy sources. The global push for net-zero emissions by 2050 has fueled unprecedented investment in clean technologies.
Technological Advancements
The boom in renewable energy has been facilitated by significant technological breakthroughs. The cost of solar photovoltaic (PV) panels has dropped by over 90% in the past decade, while wind turbine efficiency has increased dramatically. Advances in energy storage, particularly lithium-ion and emerging solid-state batteries, have mitigated the intermittency issues associated with renewable energy, making it a more reliable alternative to fossil fuels. Smart grids, digital energy management systems, and artificial intelligence in energy optimization are also enabling more efficient and resilient energy networks.
Economic Incentives and Investment Flows
Governments worldwide are offering tax incentives, subsidies, and regulatory support to promote renewable energy. Simultaneously, private capital is flooding into clean energy projects. Investment in renewable energy reached over $500 billion globally in recent years, encompassing solar, wind, battery storage, and green hydrogen projects. The economic logic is compelling: renewable energy has low operational costs, scalability, and long-term price stability compared to volatile fossil fuel markets.
Energy Security and Geopolitical Factors
The energy transition is also influenced by energy security considerations. Countries seeking to reduce dependence on imported oil and gas are increasingly investing in domestic renewable energy infrastructure. Geopolitical conflicts and energy price shocks have underscored the vulnerability of traditional fossil fuel supplies. This has reinforced the urgency of diversifying energy sources to ensure stable, resilient, and locally controlled energy systems.
Key Sectors Driving the Boom
Solar Energy
Solar energy is at the forefront of the energy transition. Utility-scale solar farms and distributed rooftop installations have proliferated globally. Countries such as China, India, the United States, and Germany are leading in installed solar capacity. The combination of declining panel costs, government incentives, and the push for decentralized energy production is driving massive adoption. Innovations such as floating solar farms, solar windows, and bifacial panels are expanding the potential applications of solar technology.
Wind Energy
Wind power, particularly offshore wind, is experiencing rapid growth. Offshore wind farms offer higher and more consistent wind speeds, enabling greater energy output. Technological improvements, including larger turbines and floating platforms, are opening new regions for wind development. Europe, China, and the U.S. are investing heavily in offshore wind, with gigawatt-scale projects now feasible. Wind energy not only contributes to carbon reduction but also creates significant employment opportunities in manufacturing, construction, and maintenance.
Energy Storage and Grid Modernization
As renewable energy generation increases, so does the need for effective energy storage solutions. Batteries, pumped hydro storage, and emerging hydrogen storage technologies are essential for balancing supply and demand. Smart grid technologies, which integrate distributed energy resources, real-time monitoring, and predictive analytics, ensure efficient energy distribution. These innovations are critical to making renewable energy reliable and commercially viable.
Electric Vehicles and Electrification
The transition extends beyond power generation. Transportation, responsible for a significant share of global emissions, is undergoing electrification. Electric vehicles (EVs), supported by extensive charging infrastructure, are transforming automotive markets. Global EV sales have surged, driven by declining battery costs, government incentives, and rising consumer awareness. Electrification is also occurring in industrial processes, heating, and building systems, further boosting electricity demand from clean sources.
Hydrogen and Emerging Technologies
Green hydrogen, produced via electrolysis using renewable energy, is emerging as a key solution for decarbonizing hard-to-electrify sectors such as heavy industry, shipping, and aviation. Investments in hydrogen infrastructure, fuel cells, and storage are growing rapidly. Other emerging technologies, including carbon capture and storage (CCS) and next-generation nuclear power (e.g., small modular reactors), complement renewable energy deployment, expanding the toolbox for a sustainable energy future.
Economic and Societal Impacts
Job Creation and Industrial Growth
The energy transition boom is generating millions of jobs worldwide. Manufacturing, installation, operations, and maintenance of renewable energy assets require skilled labor. Research and development in clean technologies are fostering innovation hubs and boosting high-tech sectors. Economies embracing the transition are positioning themselves as leaders in the next industrial revolution.
Energy Access and Equity
Renewable energy offers opportunities for energy access in remote and underserved regions. Decentralized solar and wind projects can provide reliable electricity to rural communities, reducing dependence on centralized fossil-fuel grids. This contributes to socioeconomic development, education, and improved quality of life.
Market Disruption and Investment Opportunities
Traditional energy markets are being disrupted as renewable energy costs continue to fall. Fossil fuel companies are adapting by diversifying portfolios into renewables, while investors are reallocating capital toward sustainable assets. Green bonds, carbon credits, and ESG-focused investments are reshaping global finance, making sustainability a key driver of economic growth.
Challenges and Considerations
Despite its promise, the energy transition boom faces several challenges:
Intermittency of Renewable Energy: Solar and wind are weather-dependent, necessitating robust storage and grid management solutions.
Resource Constraints: The production of batteries and renewable infrastructure requires critical minerals such as lithium, cobalt, and rare earth elements, creating supply chain challenges.
Policy and Regulatory Uncertainty: Inconsistent policies and subsidies can slow investment and deployment.
Social and Environmental Concerns: Large-scale renewable projects must navigate land use, ecological impacts, and community acceptance.
The Future Outlook
The energy transition boom is expected to accelerate in the coming decades. Analysts predict that renewables could supply more than 50% of global electricity by 2050, with electrification of transport and industry driving further demand. Digitalization, artificial intelligence, and blockchain technologies will enhance grid management, energy trading, and efficiency. Investment in hydrogen, carbon removal, and advanced nuclear will provide complementary solutions for a fully decarbonized energy system.
In conclusion, the energy transition boom represents a historic opportunity for humanity to redefine how we produce, distribute, and consume energy. It is driven by environmental imperatives, economic incentives, technological innovation, and societal demand for sustainable growth. While challenges remain, the momentum is undeniable. Countries, corporations, and individuals who embrace this transformation stand to benefit from cleaner energy, economic growth, job creation, and long-term resilience. The energy transition is not just a shift in power—it is a paradigm shift that promises to reshape our economies, societies, and planet for generations to come.

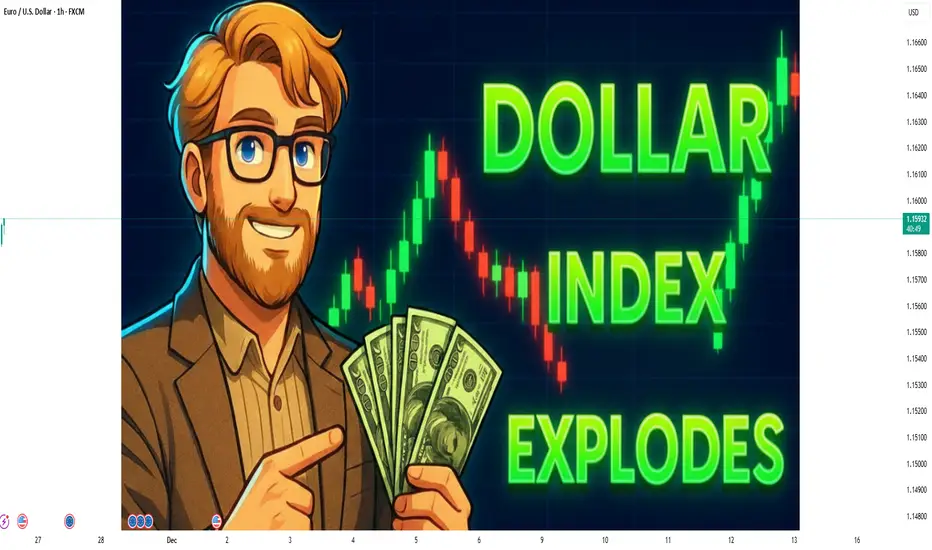
Dollar Index Explodes: Understanding the Surge in the US DollarUnderstanding the Dollar Index
The Dollar Index is a weighted geometric mean of the U.S. dollar against six major currencies: the euro (EUR), Japanese yen (JPY), British pound (GBP), Canadian dollar (CAD), Swedish krona (SEK), and Swiss franc (CHF). Among these, the euro has the largest weight, constituting approximately 57.6% of the index. This weighting means that movements in the euro-dollar exchange rate have the most significant impact on the DXY.
The index provides a snapshot of the dollar’s strength relative to its peers, serving as a critical benchmark for traders, central banks, and multinational corporations. A rising DXY indicates a stronger dollar, meaning the U.S. currency can buy more foreign currency. Conversely, a falling DXY signals a weakening dollar.
Factors Driving the Dollar Index Surge
Several key factors contribute to a sharp increase in the Dollar Index:
Interest Rate Differentials
The Federal Reserve (Fed) influences the strength of the dollar primarily through interest rate policy. When the Fed raises interest rates, U.S. assets become more attractive to global investors seeking higher returns. This demand for dollar-denominated assets pushes the currency higher. If other major central banks, such as the European Central Bank or Bank of Japan, maintain lower rates or implement quantitative easing, the interest rate differential magnifies the dollar’s appeal, fueling a surge in the DXY.
Economic Growth and Stability
Strong economic performance in the U.S. relative to other countries strengthens investor confidence in the dollar. GDP growth, low unemployment, and robust consumer spending signal a healthy economy, making the U.S. an attractive destination for global capital. When the U.S. economy outperforms its peers, the dollar tends to appreciate, reflecting investor preference for stability and growth.
Global Risk Sentiment
The dollar is often considered a “safe-haven” currency. During times of geopolitical uncertainty, financial market volatility, or economic crises, investors flock to the U.S. dollar as a secure store of value. Events such as geopolitical conflicts, global recessions, or financial market turbulence can trigger a rapid influx of capital into U.S. assets, driving the Dollar Index higher.
Trade Balances and Capital Flows
A country’s trade balance and capital flows influence currency value. While the U.S. runs a trade deficit, the inflow of foreign investment into U.S. assets can offset this, supporting the dollar. A surge in foreign purchases of U.S. Treasuries, corporate bonds, or equities increases demand for dollars, contributing to the appreciation of the currency.
Commodity Prices
Many global commodities, including oil and gold, are priced in U.S. dollars. A stronger dollar makes these commodities more expensive in other currencies, which can feed back into the demand for dollars. Conversely, falling commodity prices in local currency terms can reduce inflationary pressures in other economies, further enhancing the dollar’s appeal.
Monetary and Fiscal Policy Divergence
Differences in monetary and fiscal policies between the U.S. and other economies can accelerate dollar strength. Expansionary fiscal measures, such as government spending and tax cuts in the U.S., combined with tightening monetary policy (higher interest rates or reduced asset purchases), can boost domestic demand while attracting foreign capital. Meanwhile, stagnation or loose policy abroad can weaken foreign currencies relative to the dollar.
Implications of a Surging Dollar
A sharp rise in the Dollar Index has wide-ranging effects on global economies, financial markets, and trade:
Impact on Emerging Markets
Emerging market economies often borrow in dollars. A stronger dollar increases the local currency cost of servicing dollar-denominated debt, potentially leading to higher defaults or financial stress. Additionally, it can trigger capital outflows as investors move funds to dollar-denominated assets, creating liquidity constraints in these economies.
Global Trade Dynamics
A stronger dollar makes U.S. exports more expensive and imports cheaper. While this may reduce U.S. export competitiveness, it can benefit consumers through lower import costs. Conversely, countries with weaker currencies may see a decline in export competitiveness, potentially exacerbating trade imbalances.
Commodity Market Volatility
Since commodities are priced in dollars, a rising DXY can depress commodity prices. Countries reliant on commodity exports may face reduced revenues, while importers benefit from lower costs. For investors, this can impact portfolio allocation and market strategies, creating shifts across sectors like energy, metals, and agriculture.
Financial Market Repercussions
Equity markets may react negatively to a soaring dollar, particularly multinational corporations that earn significant revenue abroad. A stronger dollar reduces the local-currency value of foreign earnings, affecting earnings reports and stock valuations. Bond markets may experience shifts in yield spreads as capital flows respond to currency strength.
Inflation and Policy Challenges Abroad
A surging dollar can exacerbate inflationary pressures in countries with significant import reliance. Higher costs for imports and raw materials may force foreign central banks to tighten monetary policy, potentially slowing economic growth. This dynamic can create global financial fragmentation, with divergent policy cycles across economies.
Historical Context and Examples
Historically, the Dollar Index has experienced explosive periods during times of financial turbulence or aggressive U.S. monetary policy. For example, during the global financial crisis of 2008, the DXY surged as investors sought safety in U.S. assets. Similarly, in periods when the Fed implemented aggressive rate hikes while other central banks remained accommodative, the dollar strengthened rapidly, affecting global markets and trade.
Conclusion
A surging Dollar Index reflects the complex interplay of U.S. economic fundamentals, monetary policy, global risk sentiment, and capital flows. While a strong dollar benefits U.S. investors and consumers in some ways, it presents challenges for exporters, multinational corporations, emerging markets, and commodity-reliant economies. Understanding the factors driving the DXY and its broader implications is essential for policymakers, traders, and investors navigating a globally interconnected financial landscape.
In essence, when the dollar explodes, it signals not just a shift in exchange rates but a ripple effect through trade, capital markets, and economic strategies worldwide. Monitoring the Dollar Index is therefore crucial for anticipating trends, managing risks, and seizing opportunities in both domestic and international markets.