16,532% growth in just 37 days! A new star in the crypto world!MYX Finance: Understanding the Crypto Star that Soared Over 16,000%
BINANCE:MYXUSDT.P
In the fast-moving world of cryptocurrency, stories of incredible growth often capture our imagination. Recently, a new star has emerged, producing a truly breathtaking performance. In just 37 days, the MYX Finance token (MYX) experienced a massive price increase of over 16,532%. This kind of rocket launch makes everyone ask two simple questions: What is MYX Finance, and how did its price rise so fast?
This article is your guide to understanding this exciting story. We will explore what makes MYX Finance a special project in the crypto universe. Then, we will uncover the key reasons behind its recent, explosive growth. This is more than just a story about numbers; it’s a look into the innovation and energy that makes the world of digital finance so exciting.
Part 1: What is MYX Finance? A Simple Guide to a Powerful Platform
Before we understand why MYX grew so quickly, we first need to understand what it is. At its heart, MYX Finance is a new type of crypto trading platform designed to be powerful, fair, and easy for everyone to use.
The Best of Both Worlds - A New Kind of Crypto Market
In the crypto world, there are two main types of exchanges. Centralized Exchanges (CEXs) are like big, traditional banks. They are fast and easy to use, but you have to trust them to hold your money safely. Decentralized Exchanges (DEXs) are more like a community market. You always control your own money, but they can sometimes be slower and more complicated. MYX Finance combines the best features of both. It’s a DEX, so you always have control of your funds, but it’s designed to be as fast and easy to use as a CEX. It achieves this with a special system that lets trades happen instantly and with a feature they call “zero-slippage.”
The Magic of "Zero-Slippage"
Imagine you want to buy a crypto token for $100. On many platforms, by the time your order is processed, the price might have changed to $101. That $1 difference is called “slippage.” It can be very frustrating for traders. MYX Finance has built a system to eliminate this problem. Zero-slippage means the price you see when you click “buy” is the exact price you get. This makes trading fairer and more predictable, which is a huge advantage for traders of all levels.
More Than Just Trading - A Multi-Chain Universe
MYX isn't limited to just one blockchain. It operates across more than 20 different chains, including popular ones like Ethereum, BNB Chain, and Arbitrum. This means users can trade a huge variety of tokens without having to move their funds between different platforms, saving them time and money.
Part 2: The Perfect Storm: Four Key Catalysts for Explosive Growth
A 16,532% price increase doesn't happen by accident. It takes a “perfect storm” of technology, timing, and community excitement. For MYX, four main factors came together to create this incredible rally.
Excitement for the V2 Upgrade: Before the big price surge, there was a lot of positive talk in the MYX community about a major platform upgrade called V2. This upgrade promised to make the platform even better, faster, and more powerful, creating a strong foundation of positive sentiment.
Major Exchange Listings: The real explosion began when the MYX token was listed on popular crypto exchanges, especially Binance Alpha. This exposed the token to millions of new potential buyers. In one day, trading volume surged by 710%, reaching an incredible $354 million.
The "Short Squeeze": When the price started to rise, traders who had bet against the token (shorting) were forced to buy it back to cover their losses. This created a rapid buying frenzy called a “short squeeze.” In just 24 hours, over $14.6 million in these short positions were liquidated, adding even more fuel to the rally.
Industry Recognition and Awards: Finally, MYX Finance received a prestigious award from the BNB Chain, one of the biggest networks in crypto. They were named a “Volume Powerhouse,” which served as a powerful endorsement and gave new buyers more confidence in the project.
Part 3: The Big Picture - Why This Matters for Crypto
The story of MYX Finance is more than just one token's success; it shows us some important trends in the world of crypto.
Innovation Matters: MYX didn’t just grow because of hype; it grew because it offers a genuinely better trading experience with its zero-slippage feature. This shows that projects with strong technology can achieve incredible things.
The Power of Community: The excitement and support from the MYX community played a huge role in its success. In decentralized finance, a strong community is one of the most valuable assets a project can have.
Opportunity Still Exists: It reminds us that the crypto market is still young and full of opportunity. While there are always risks, stories like MYX show that there is still massive potential for growth.
Conclusion: Your Adventure in the World of Crypto Begins
The incredible 37-day journey of MYX Finance is a powerful reminder of how dynamic and exciting the world of digital assets can be. We’ve seen how a project with innovative technology, strong community support, and perfect timing can capture the attention of the entire market.
As the Founder of ForecastCity and the creator of the 4CastMachine AI software, my mission is to help traders navigate this exciting market with better tools and insights. The crypto world is full of opportunities like this one. To stay ahead of the curve and continue your learning journey, make sure to follow me! Let's explore the future of finance together.
Frequently Asked Questions (FAQs)
What is MYX Finance in one sentence?
MYX Finance is a next-generation decentralized exchange (DEX) that makes trading crypto fast, easy, and fair by offering zero-slippage trading across more than 20 different blockchains.
What does "zero-slippage" mean?
It means the price you see when you make a trade is the exact price you get, which prevents you from losing money to sudden price changes during your transaction.
Why did the MYX token price rise so fast?
It was a "perfect storm" of four main factors: excitement for a major platform upgrade (V2), listings on popular exchanges like Binance, a "short squeeze" that forced rapid buying, and a prestigious award from BNB Chain that boosted confidence.
Is MYX a good investment?
Like all cryptocurrencies, MYX is a high-risk, high-reward asset. Its recent performance has been incredible, but the market is very volatile. This article is for educational purposes, and you should always do your own research (DYOR) and assess your personal risk tolerance before investing.
For ongoing analysis and to discover more exciting projects in the crypto space, don't forget to follow me!
Trade Smart!
Navid Jafarian
Contains image

FLOCKUSDT Cup & Handle Breakout, More Rally LoadingFLOCKUSDT has successfully broken out above the strong cup and handle neckline zone, confirming a bullish continuation structure. The current pullback towards the breakout zone should act as a healthy retest and provide a strong buy-back opportunity.
As long as the neckline zone holds, we anticipate another leg up that could trigger a more aggressive rally towards the projected bullish targets shown on the chart. Failure to hold the neckline zone, however, would invalidate the setup and delay the bullish move.
The plan remains to accumulate from the retest zone and follow the bullish path while keeping risk management in place.

Nifty Analysis EOD – September 10, 2025 – Wednesday🟢 Nifty Analysis EOD – September 10, 2025 – Wednesday 🔴
📌 Doji at Resistance – Market in Consolidation Grip
🗞 Nifty Summary
Nifty opened with a 114-point gap-up, well above the previous day’s high and right in the middle of the strong resistance zone of 24,975 ~ 25,004. Initially, the index attempted to stabilize and hold above 25,000, but couldn’t sustain the level. It gradually lost ground, broke the VWAP and day’s low, marking a low of 24,915.
A recovery of 75 points from the low brought Nifty back to 24,977.5 at close, resulting in a Doji candle formed near the middle of the resistance zone.
Such large gap-ups or gap-downs are not favorable for intraday players, and positional BTST option buyers were left vulnerable, as the first-minute slip wiped out initial gains.
🛡 5 Min Intraday Chart with Levels
📉 Daily Time Frame Chart with Intraday Levels
🕯 Daily Candle Breakdown
Open: 24,991.00
High: 25,035.70
Low: 24,915.05
Close: 24,973.10
Change: +104.50 (+0.42%)
🏗️ Structure Breakdown
Red candle (Close < Open).
Body: 17.90 points → small.
Upper wick: 44.70 points.
Lower wick: 58.05 points.
This forms a Spinning Top-type candle with long shadows on both sides → indicative of intraday tug-of-war.
📚 Interpretation
Market opened near 25,000, briefly touched 25,035, but sellers rejected higher levels.
Buyers defended 24,915, as seen from the long lower wick.
Closing slightly below open signals mild bearish pressure despite overall gains compared to the previous close.
This is a classic indecision candle, with bulls managing to hold ground but failing to assert dominance.
🕯Candle Type
Spinning Top / Indecision Candle with balanced pressure leaning slightly bearish (due to red close).
📉📈 Short-Term View – September 11, 2025
Support: 24,910 – 24,915 (defended today).
Resistance: 25,030 – 25,050 (strong supply zone with multiple rejections).
👉 Key Insight:
Bulls are trying to protect 24,900 but facing strong resistance near 25,030–25,050.
Market is consolidating and coiling tighter between 24,900–25,050.
A breakout above 25,050 may trigger fresh momentum towards 25,160, while a dip below 24,900 opens risk toward 24,750.
🛡 5 Min Intraday Chart
⚔️ Gladiator Strategy Update
ATR: 193.36
IB Range: 59.3 → Small
Market Structure: Balanced
Trade Highlights:
10:30 AM – Long Trigger → SL Hit
13:20 PM – Short Trigger → SL Hit
📌 Support & Resistance Levels
Resistance Zones:
24,975 ~ 25,004
25,035 ~ 25,140
25,160
Support Zones:
24,915 ~ 24,895
24,845 ~ 24,835
24,785
💡 Final Thoughts
Today’s indecisive spinning top reflects a market stuck in consolidation, caught between supply and demand. Until a decisive breakout occurs, avoid large positional bets and remain focused on intraday tactical trades.
📖 “Patience in consolidation builds the strongest trends later.”
✏️ Disclaimer
This is just my personal viewpoint. Always consult your financial advisor before taking any action.

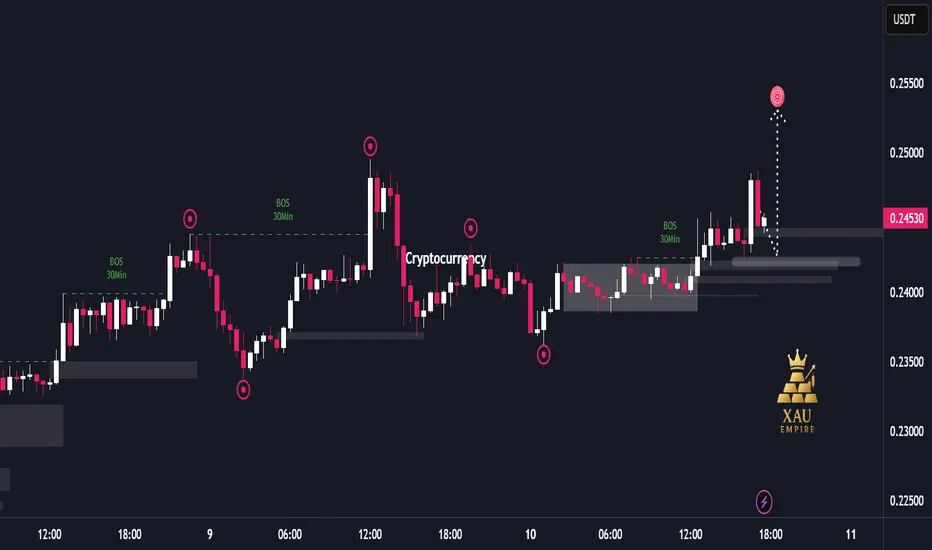
Institutional Flow Driving DOGE Upside Liquidity Hunt📊 Report-Based Analysis
Market Structure:
The chart shows multiple “Break of Structure (BOS)” events, indicating that institutional orders are driving the market direction. Frequent upside BOS suggests that the bullish trend is currently dominant.
Liquidity Movements:
Price has repeatedly hunted liquidity around major highs and lows (sharp wicks and sudden moves triggering stop losses) before returning to its intended direction. This behavior reflects strong institutional control over market flow.
Price Action Dynamics:
First, the market expanded upward with strong bullish momentum.
A sharp correction followed, creating volatility.
Afterwards, price entered a consolidation phase, which later broke to the upside.
Despite a recent rejection, the bullish structure remains intact.
Current Situation:
Price is trading around the 0.245 area. A large bullish candle was followed by a quick rejection, but the broader structure continues to lean bullish. Projections on the chart suggest a potential push higher as liquidity targets remain above.
Market Bias:
Short-term bias remains bullish. The consistent BOS and formation of higher lows show that the market is more likely to continue seeking upside liquidity in the near term.
PROMPTUSDT Accumulation Leading to Major BreakoutPROMPTUSDT has been consolidating within a clear accumulation zone, and the recent breakout from the descending falling wedge structure signals the possibility of a strong bullish reversal.
The accumulation zone offers a good buying opportunity with invalidation clearly defined below the zone. As long as this level continues to hold, the bullish plan remains valid.
Immediate profit targets are placed around $0.3983, while the extended move points towards $0.8036, with the final setup target projected near $1.4404. A rally of this magnitude would confirm the completion of the accumulation phase and open the door for a new bullish cycle.
Failure of the accumulation zone to hold, however, could trigger further downside risk making risk management key at this stage.
What’s your outlook on PROMPT do you believe this accumulation will fuel the next major breakout?

Comeback for Constellation Energy?Constellation Energy has been powering down for the last month, but now some traders may think the electricity stock is ready for a comeback.
The first pattern on today’s chart is the weekly close of $297.49 on May 23. CEG tested and held that zone several times in early June. Prices returned to that level last week and are now bouncing. That may suggest old support remains in effect.
Second, the 100-day simple moving average is rising through the same area on the chart. That may confirm a longer-term uptrend.
Third, stochastics are turning up from an oversold condition.
Next, CEG has pushed back against a falling trendline and the 21-day exponential moving average. That could reflect more bullishness in the short term.
Finally, investors may refocus on big-picture points. First, there are hopes of rate cuts after producer price inflation was lower than expected. Second is the ongoing AI buildout (with all the associated demand for electricity) following Oracle’s NYSE:ORCL strong guidance last night.
TradeStation has, for decades, advanced the trading industry, providing access to stocks, options and futures. If you're born to trade, we could be for you. See our Overview for more.
Past performance, whether actual or indicated by historical tests of strategies, is no guarantee of future performance or success. There is a possibility that you may sustain a loss equal to or greater than your entire investment regardless of which asset class you trade (equities, options or futures); therefore, you should not invest or risk money that you cannot afford to lose. Online trading is not suitable for all investors. View the document titled Characteristics and Risks of Standardized Options at www.TradeStation.com . Before trading any asset class, customers must read the relevant risk disclosure statements on www.TradeStation.com . System access and trade placement and execution may be delayed or fail due to market volatility and volume, quote delays, system and software errors, Internet traffic, outages and other factors.
Securities and futures trading is offered to self-directed customers by TradeStation Securities, Inc., a broker-dealer registered with the Securities and Exchange Commission and a futures commission merchant licensed with the Commodity Futures Trading Commission). TradeStation Securities is a member of the Financial Industry Regulatory Authority, the National Futures Association, and a number of exchanges.
TradeStation Securities, Inc. and TradeStation Technologies, Inc. are each wholly owned subsidiaries of TradeStation Group, Inc., both operating, and providing products and services, under the TradeStation brand and trademark. When applying for, or purchasing, accounts, subscriptions, products and services, it is important that you know which company you will be dealing with. Visit www.TradeStation.com for further important information explaining what this means.

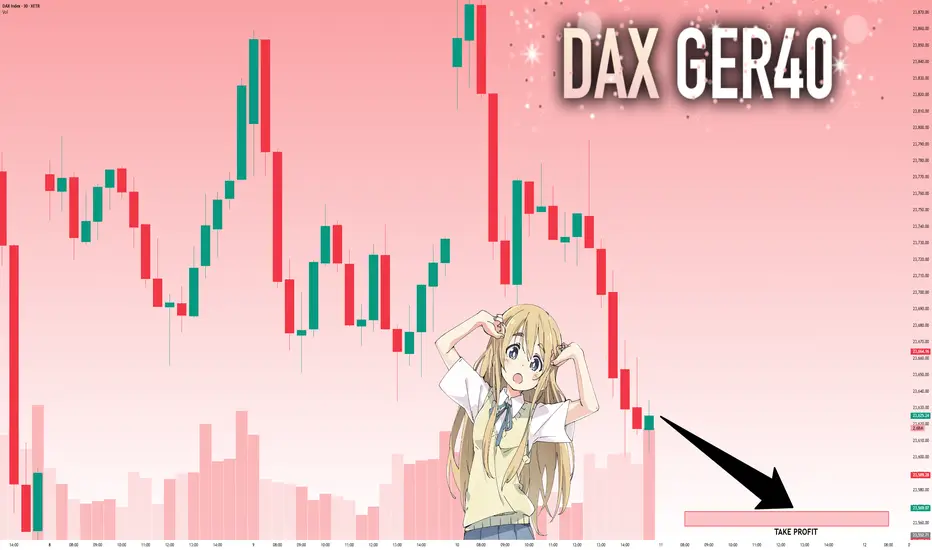
DAX: Absolute Price Collapse Ahead! Short!
My dear friends,
Today we will analyse DAX together☺️
The recent price action suggests a shift in mid-term momentum. A break below the current local range around 23,625.24 will confirm the new direction downwards with the target being the next key level of 23,566.97 and a reconvened placement of a stop-loss beyond the range.
❤️Sending you lots of Love and Hugs❤️
AUD_JPY BULLISH BREAKOUT|LONG|
✅AUD_JPY is going up
Now and the pair made a bullish
Breakout of the key horizontal
Level of 97.400 and the breakout
Is confirmed so we are bullish
Biased and we will be expecting
A further bullish move up
LONG🚀
✅Like and subscribe to never miss a new idea!✅

GBP-CAD Will Keep Growing! Buy!
Hello,Traders!
GBP-CAD is trading in an
Uptrend and the pair broke
The key horizontal level
Of 1.8723 so we are
Bullish biased and we
Will be expecting a
Further bullish move up
Buy!
Comment and subscribe to help us grow!
Check out other forecasts below too!
Disclosure: I am part of Trade Nation's Influencer program and receive a monthly fee for using their TradingView charts in my analysis.

SILVER: Will Go Up! Long!
My dear friends,
Today we will analyse SILVER together☺️
The in-trend continuation seems likely as the current long-term trend appears to be strong, and price is holding above a key level of 41.198 So a bullish continuation seems plausible, targeting the next high. We should enter on confirmation, and place a stop-loss beyond the recent swing level.
❤️Sending you lots of Love and Hugs❤️

EURUSD → Breakthrough of consolidation resistance. Rally?FX:EURUSD ends correction with a breakout of consolidation resistance. The market is waiting for a positive driver in the form of economic news that could support the growth of the euro...
A breakout of the correction (consolidation) resistance has formed. However, the momentum is being replaced by a correction aimed at consolidating in the bullish plane, which could trigger continued growth in the medium term.
The dollar looks weak, and expectations of interest rate cuts are supporting the euro. If the bulls keep the price above 1.17 - 1.172 within the current correction, the price may start to rally to highs...
Support levels: 1.173, 1.1703
Resistance levels: 1.178, 1.183, 1.190
Before continuing to grow, liquidity may be captured relative to the previously broken consolidation resistance. A false breakdown of support at 1.173-1.170 could trigger a resumption of growth towards 1.190.
Best regards, R. Linda!

GOLD: The Market Is Looking Down! Short!
My dear friends,
Today we will analyse GOLD together☺️
The market is at an inflection zone and price has now reached an area around 3,647.80 where previous reversals or breakouts have occurred.And a price reaction that we are seeing on multiple timeframes here could signal the next move down so we can enter on confirmation, and target the next key level of 3,634.87.Stop-loss is recommended beyond the inflection zone.
❤️Sending you lots of Love and Hugs❤️

EUR_AUD SUPPORT BELOW|LONG|
✅EUR_AUD is going down now
But a strong support level is ahead at 1.7650
Thus I am expecting a rebound
And a move up towards the target of 1.7709
LONG🚀
✅Like and subscribe to never miss a new idea!✅

EUR-GBP Will Go UP! Buy!
Hello,Traders!
EUR-GBP made a retest
Of the horizontal support level
Of 0.8640 from where we
Are already seeing a bullish
Reaction so we are locally
Bullish biased and we will
Be expecting a further
Bullish move up
Buy!
Comment and subscribe to help us grow!
Check out other forecasts below too!
Disclosure: I am part of Trade Nation's Influencer program and receive a monthly fee for using their TradingView charts in my analysis.

HAEL – TECHNICAL BUY CALL | 10 Sept 2025 HAEL – TECHNICAL BUY CALL | 10 Sept 2025
The stock pulled back after marking a high of Rs. 35.5 and is now expected to move upwards after retesting a key level.

EURUSD: Strong Bullish Sentiment! Long!
My dear friends,
Today we will analyse EURUSD together☺️
The price is near a wide key level
and the pair is approaching a significant decision level of 1.17209 Therefore, a strong bullish reaction here could determine the next move up.We will watch for a confirmation candle, and then target the next key level of 1.17391.Recommend Stop-loss is beyond the current level.
❤️Sending you lots of Love and Hugs❤️

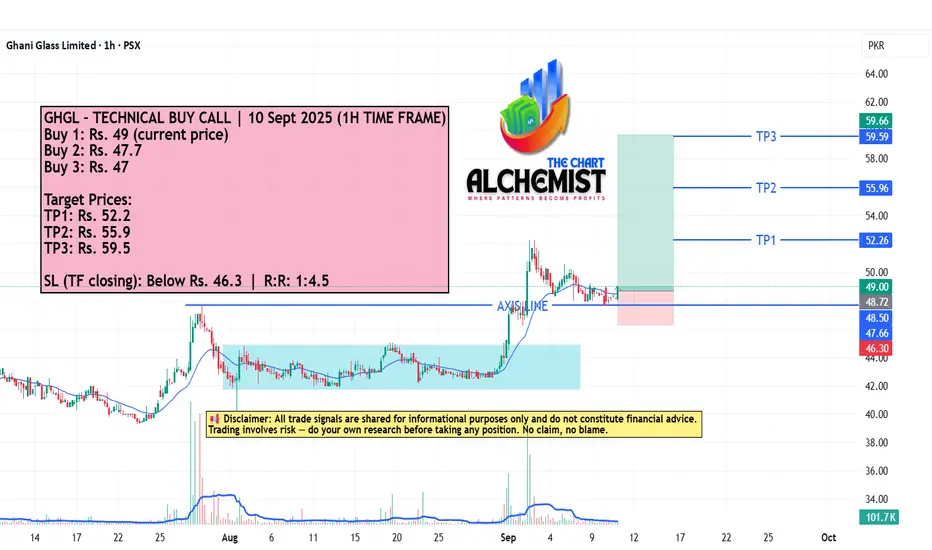
GHGL – TECHNICAL BUY CALL | 10 Sept 2025 (1H TIME FRAME) GHGL – TECHNICAL BUY CALL | 10 Sept 2025 (1H TIME FRAME)
The stock broke out of a trading range, posted a high of Rs. 52.3, and is now expected to move upwards after a pullback.
FML – TECHNICAL BUY CALL | 10 Sept 2025 FML – TECHNICAL BUY CALL | 10 Sept 2025
The stock accumulated in a trending range and recently gave a spike, creating a bullish structure.

DOL – TECHNICAL BUY CALL | 10 Sept 2025 DOL – TECHNICAL BUY CALL | 10 Sept 2025 (1D TIME FRAME)
The stock completed a Wyckoff reaccumulation phase, broke out, retested, and is now breaking out of a second consolidation area.

LIVEN – TECHNICAL BUY CALL | 10 Sept 2025 (1H TIME FRAME)LIVEN – TECHNICAL BUY CALL | 10 Sept 2025 (1H TIME FRAME)
The stock reversed upwards after marking a low of Rs. 50.3, achieved a high of Rs. 80.6, and is now expected to rise after a pullback.

BAHL – TECHNICAL BUY CALL | 10 Sept 2025 (1H TIME FRAME)BAHL – TECHNICAL BUY CALL | 10 Sept 2025 (1H TIME FRAME)
The stock broke out of a reaccumulation phase and is now expected to move upwards after a pullback, forming a powerful double-bottom bull flag pattern.

Double Bottom + Bullish Divergence.2070 Saudi Pharmaceutical
Closed at 27.74 (10-09-2025)
Double Bottom + Bullish Divergence.
Very Important Support level around 26 - 26.70
Sustaining this level may lead it towards 30 & then 33.
However, it should not break 21 now.

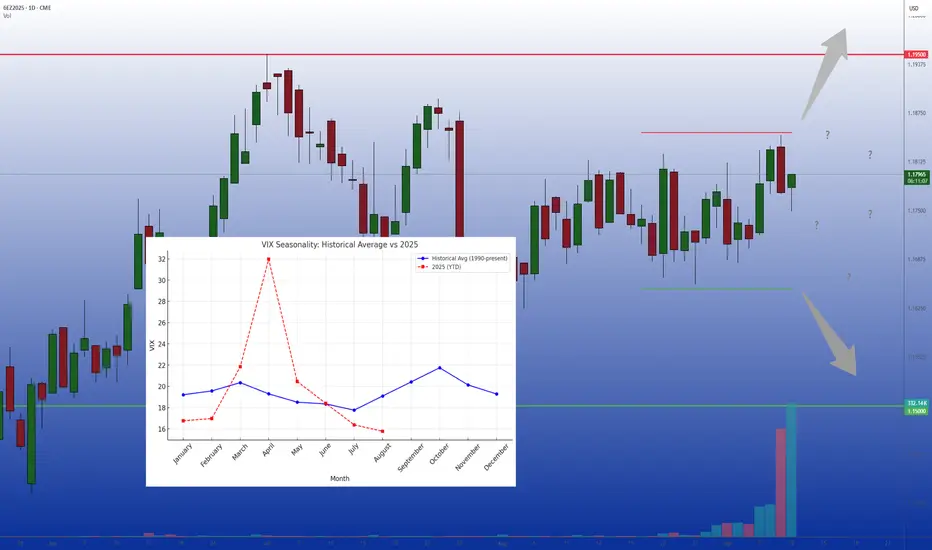
Volatility at rock bottom: is a straddle the right move?Markets often fall into a familiar seasonal pattern. As summer advances, trading volumes thin out, implied volatility fades, and investors drift into a sense of calm. Yet history shows that this period of tranquility rarely lasts. September and October have traditionally been months of renewed turbulence, often catching complacent investors off guard.
With implied volatility currently trading at depressed levels, option premiums are effectively “on sale.” This creates an attractive window for strategies that do not rely on predicting direction but instead position for the return of volatility. Chief among them is the straddle.
What exactly is a straddle?
A straddle is one of the simplest volatility strategies in options markets. It involves buying both a call and a put option with the same strike price and expiration date. The payoff structure is straightforward:
If the underlying asset rises sharply, the call option gains.
If the underlying falls, the put option benefits.
If the market stagnates, the loss is limited to the combined premium.
This makes the straddle an efficient way of “buying volatility.” The key appeal is that it does not require choosing a direction, only anticipating that the market will eventually move.
The calm before the storm
History provides a strong case for seasonality in volatility. Since 1990, the VIX has tended to bottom in June and July before rebounding in September and peaking in October.
The year 2025 has so far mirrored this cycle. After a turbulent spring, summer brought an unusually long stretch of calm. By July, implied volatility had retreated to some of the lowest comfort levels in years. But if history is any guide, such stability is more a pause than a new equilibrium.
Foreign exchange markets show a similar pattern. The CVOL G5 FX index, tracking implied volatility on Euro, Pound, Yen, Australian Dollar, and Canadian Dollar futures, often displays sharp bursts of activity around macro or geopolitical shocks, followed by prolonged lulls. The current quiet looks very much like another such lull.
Why low IV matters
Implied volatility is the primary input in option pricing. When IV is low, option premiums fall; when IV rises, those same contracts become far more expensive. This makes timing important.
An August straddle is usually cheaper than one initiated in September. Buying optional exposure now means paying a “discounted” premium while retaining the potential to benefit from a rebound in volatility during the fall.
No need for directional bets
One of the main attractions of the straddle is that it removes the need to guess direction.
For example, an investor might think: “I am unsure whether the euro will rise or fall against the dollar, but I doubt that the summer calm will last.” In such a scenario, a straddle is more appropriate than a directional trade. It captures volatility regardless of the outcome and provides insurance against unexpected moves.
FX as a natural playground
Equity markets tend to see volatility spikes alongside price declines, but in FX, volatility is far more symmetric. Currency pairs often experience sharp swings in either direction, sometimes triggered by small catalysts such as a central banker’s remark or a surprise data print.
Let’s take the Euro FX contract, December expiry. The price has remained close to 1.175 throughout the summer, but several catalysts could easily break the range in the fall: diverging central bank policies, U.S. protectionist measures, or geopolitical events. Any of these could quickly shift the balance between currencies and force institutional rebalancing.
Because FX markets often move from extended ranges to sudden breakouts, they provide fertile ground for straddle strategies. The investor is not required to predict the breakout direction, only to position for its likelihood.
Another important consideration: listed FX options, such as those traded on CME, generally offer more transparency, standardization, and often lower costs compared with over-the-counter (OTC) FX options. Exchange-traded contracts provide clearer pricing and robust clearing, which makes them particularly well-suited for volatility strategies where premium efficiency matters.
Lessons from seasonality
Volatility is cyclical. Calm phases almost always give way to periods of agitation, sometimes even panic. Over the past 35 years, September has consistently marked a turning point, as investors return from summer breaks and refocus on economic data, central bank policy, and geopolitical events.
The summer of 2025 is no exception. Option premiums are unusually cheap, reflecting a market that assumes the calm will last. But history suggests otherwise. For those who believe turbulence will return, strategies like the straddle offer a simple and cost-efficient way to prepare.
Final thoughts
Complacency is one of the market’s most dangerous traps. While quiet markets encourage investors to lower their guard, volatility rarely stays low for long. With option premiums currently discounted, the coming weeks present an attractive window to position for a return of market movement.
By emphasizing magnitude over direction and by favoring listed options for their transparency and efficiency, the straddle remains one of the most compelling ways to approach the seasonal shift.
---
When charting futures, the data provided could be delayed. Traders working with the ticker symbols discussed in this idea may prefer to use CME Group real-time data plan on TradingView: tradingview.com/cme/ .
This consideration is particularly important for shorter-term traders, whereas it may be less critical for those focused on longer-term trading strategies.
General Disclaimer:
The trade ideas presented herein are solely for illustrative purposes forming a part of a case study intended to demonstrate key principles in risk management within the context of the specific market scenarios discussed. These ideas are not to be interpreted as investment recommendations or financial advice. They do not endorse or promote any specific trading strategies, financial products, or services. The information provided is based on data believed to be reliable; however, its accuracy or completeness cannot be guaranteed. Trading in financial markets involves risks, including the potential loss of principal. Each individual should conduct their own research and consult with professional financial advisors before making any investment decisions. The author or publisher of this content bears no responsibility for any actions taken based on the information provided or for any resultant financial or other losses.