Breaking: Enlivex Therapeutics (NASDAQ :ENLV) Spike 44% Today Enlivex Therapeutics Ltd. (ENLV) Spike 44% albeit market dip. The asset broke through the $0.85 support point to reclaim the $1 resistant.
With the RSI at 72, the asset is poised for a bullish continuation pattern should the share price break though the $1.30 resistant setting the pace to reclaim the $2 resistance point.
In another news, Enlivex Therapeutics Ltd. (NASDAQ: ENLV) today announced the appointment of Mr. Matteo Renzi, former Prime Minister of Italy, to the board of directors at Enlivex, effective November 24th. 2025.
Similarly, Enlivex Announces $212,000,000 Private Placement to Initiate World’s First Prediction Markets Digital Asset Treasury Strategy, via RAIN token Accumulation.
Analyst Summary
According to 2 analysts, the average rating for ENLV stock is "Buy." The 12-month stock price target is $7.0, which is an increase of 442.64% from the latest price.
About ENLV
Enlivex Therapeutics Ltd., together with its subsidiaries, operates as a clinical-stage macrophage reprogramming immunotherapy company in Israel. Its product pipeline is the Allocetra (ENX-CL-02-002), which is in phase II clinical trial for the treatment of organ dysfunction and failure caused by sepsis; and Allocetra (ENX-CL-05-001), which is in phase I/II clinical trial to treat moderate knee osteoarthritis.
Contains image

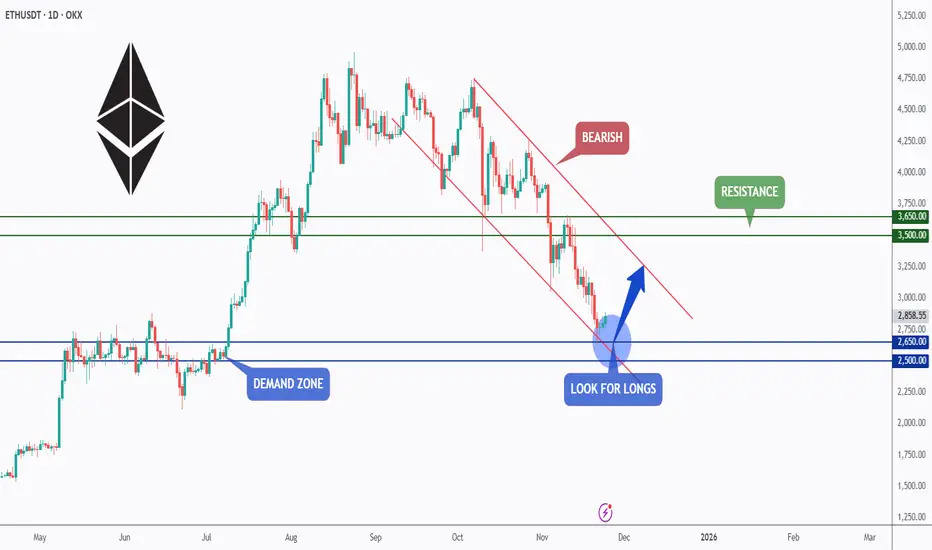
ETH - Demand Zone Meets Channel Support… Correction Loading?⚔️ETH is currently trading around a major demand zone, which lines up perfectly with the lower bound of the falling channel. This intersection forms a strong confluence area where buyers typically step in to absorb the selling pressure.
🏹As long as ETH holds above the $2,500–$2,650 zone, we will be looking for long setups, anticipating a big corrective move toward the upper bound of the falling channel. This would align with the natural rhythm of impulse → correction inside a bearish channel.
If the bulls manage to defend this area, the next targets sit around $3,500–$3,650, which represent the next key resistance levels. However, a break below the demand zone would invalidate the bullish correction setup and open the door for further downside.
ETH is now at a decisive point… will the demand zone trigger the next corrective leg upward? 🤔
⚠️ Disclaimer: This is not financial advice. Always do your own research and manage risk properly.
📚 Stick to your trading plan regarding entries, risk, and management.
Good luck! 🍀
All Strategies Are Good; If Managed Properly!
~Richard Nasr
DXY LOCAL SHORT|
✅DXY is stalling inside higher-timeframe supply after sweeping buy-side liquidity, hinting at distribution. If rejection holds, expect a move toward the downside imbalance and sell-side liquidity below.Time Frame 6H.
SHORT🔥
✅Like and subscribe to never miss a new idea!✅

GOLD Bullish Bias! Buy!
Hello,Traders!
GOLD has already rebounded from the rising trendline after clearing internal liquidity, showing renewed bullish order-flow. Expect continuation toward the horizontal buy-side liquidity above.Time Frame 5H.
Sell!
Comment and subscribe to help us grow!
Check out other forecasts below too!
Disclosure: I am part of Trade Nation's Influencer program and receive a monthly fee for using their TradingView charts in my analysis.

HAUTO: TP NOK 141,- Generous dividends (+25%) [Pink: HOEGF]Some say Car-carrier (PCTC ) trade macro is challenging in, others claim this comes to pass late '26 or '27. All the while generous dividends are an insurance. Short term movements may meet resistance, must hold +100-ish, looking to medio jan 2025 for more upside.
Conensus TP : NOK 141

Bitcoin is falling via the Descending channel As observed in typical market behavior, a descending channel often emerges as a corrective structure following significant upward movements—precisely the pattern currently visible on the Bitcoin chart. This channel reflects a near-term consolidation phase, allowing the market to absorb previous gains and establish a new equilibrium.
A decisive breakout above the upper boundary of this channel, particularly when supported by increasing volume, would signal the resumption of the primary bullish trend. In such a scenario, a renewal of upward momentum could propel the market toward new all-time highs, aligning with the broader bullish market structure.
DISCLAIMER: ((trade based on your own decision))
<<press like👍 if you enjoy💚

ETHUSDT Last support zones now are touching As previously outlined in our technical analysis, the price zone between $2,400 and $2,500 represents the final major support level for the current market structure. A decisive breakdown below this critical support confluence would signal a transition into a confirmed bear market, potentially triggering an additional decline of 40% or more.
Conversely, a strong defensive reaction at this level—preferably with bullish reversal patterns and increasing volume—could initiate a sustained recovery. The key confirmation for a bullish scenario would be a reclaim of the $4,000 level, which would indicate a restoration of underlying demand and potentially mark the resumption of the primary uptrend.
DISCLAIMER: ((trade based on your own decision))
<<press like👍 if you enjoy💚

DOGEUSDT is near weekly support and can pump +200% nowThe market has undergone a severe correctional phase, with declines exceeding 70% from previous highs—a movement that technically qualifies as a bear market cycle rather than a simple pullback. At these oversold levels, we may anticipate a potential technical rebound or relief rally. However, such upward movements should initially be viewed as corrective within the larger bearish structure unless key resistance levels are reclaimed with strong volume and sustained momentum.
Traders should monitor for signs of market stabilization and potential reversal patterns forming on higher timeframes, while remaining cautious of false breakouts or bear market rallies—often referred to as 'dead cat bounces'—that may temporarily lift prices before the primary downtrend resumes.
DISCLAIMER: ((trade based on your own decision))
<<press like👍 if you enjoy💚

XRPUSDT is near channel support zone As observed on the chart, XRP has initiated a corrective phase within a defined descending channel, experiencing significant downward momentum. The price is now testing the channel's lower support boundary for a potential reversal. A strong reaction at this level, followed by a bullish reversal candle with supporting volume, could signal the start of an upward move toward the channel's upper resistance.
A decisive breakout above the channel, especially with increasing volume, would indicate a shift in market structure and likely activate further bullish momentum. In such a scenario, initial technical projections suggest a measured move toward the $4.00 level, which aligns with the pattern's implied volatility and previous key resistance zones.
DISCLAIMER: ((trade based on your own decision))
<<press like👍 if you enjoy💚

PEPEUSDT is near major weekly support also trendline retest herePEPEUSDT appears to be concluding its bearish phase, with price action having breached a significant daily support level. The asset is now undergoing a critical retest of the broken trendline a common technical phenomenon where former Resistance(Red trendline) transforms into support . A successful rejection from this level could catalyze a robust bullish reversal. Based on the magnitude of the preceding decline and the strength of this support zone, we project a potential upward movement with an estimated appreciation target of 200% upon confirmed breakout confirmation.
DISCLAIMER: ((trade based on your own decision))
<<press like👍 if you enjoy💚

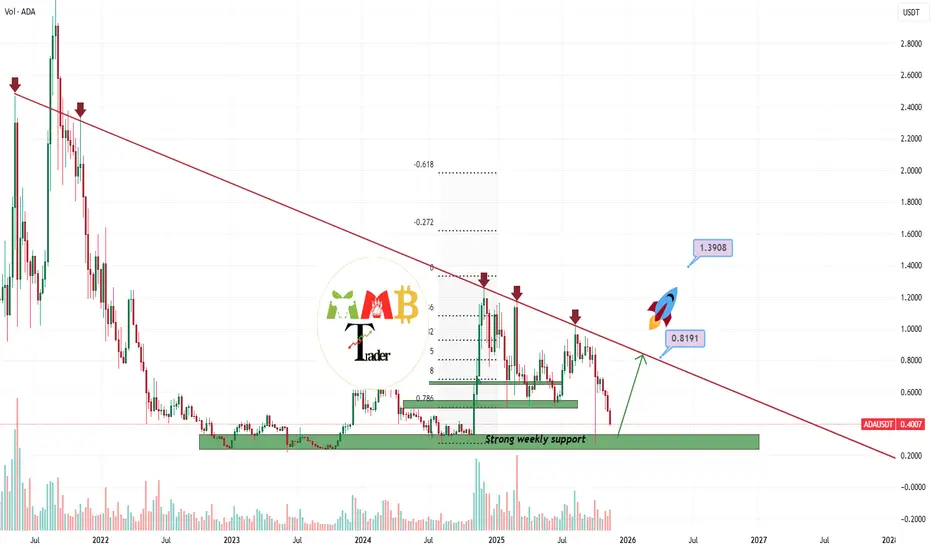
ADAUSDT first target to hit is now +100% (0.80$)ADAUSDT is currently trading within a bearish market structure, experiencing significant downward pressure. However, it's crucial to note that the asset is approaching a major weekly support level. From a technical perspective, the current price zone around $0.40 could present a potential accumulation opportunity with favorable risk-reward characteristics.
The primary scenario envisions a technical rebound toward the $0.80 level, which coincides with a key descending trendline resistance. A decisive breakout above this resistance zone with confirmed volume would be necessary to validate any sustained bullish reversal and potentially initiate further upward momentum.
DISCLAIMER: ((trade based on your own decision))
<<press like👍 if you enjoy💚
CRYPTO market see that bottom go for long The total cryptocurrency market capitalization is now testing a critical technical confluence, positioned at both a multi-week channel support and a significant historical demand zone. Following the recent market correction, this level represents a pivotal area where buyer interest has traditionally emerged. Should this support level hold, we anticipate a potential market-wide recovery that would likely catalyze upward momentum across major assets, with Bitcoin expected to lead this bullish reversal. The current price action suggests this zone may serve as the foundation for the next sustainable advance.
DISCLAIMER: ((trade based on your own decision))
<<press like👍 if you enjoy💚

EURCHF SHORT FROM SUPPLY AREA|
✅EURCHF is tapping the higher-timeframe supply after sweeping buy-side liquidity. A corrective drop into the imbalance is likely as algos rebalance before targeting downside liquidity.
Time Frame 6H.
SHORT🔥
✅Like and subscribe to never miss a new idea!✅

Exivara24: Bitcoin Weakens – Liquidity Drains, Demand ReversesBitcoin continues to face heavy pressure. Over the past two weeks, the market has experienced a sharp liquidity outflow and a simultaneous reversal of all the major capital inflow channels that were previously pushing price upward. At Exivara24, we are detecting an alarming synchronization of three key factors that is now dictating sentiment for both retail traders and institutions.
The three main demand engines are reversing at the same time
ETF outflow pressure stronger than expected
Spot Bitcoin ETFs (especially U.S. and European) have been recording consistent selling for the third straight week. Net outflows over the last 10 days exceeded $1.18 billion – the largest figure since May 2025. When ETFs shrink their balances, they directly pull capital out of the market, reducing order-book depth and amplifying volatility.
Sharp decline in DAT (Daily Active Transfers) activity
The number of daily active transfers on the Bitcoin network has fallen 34 % compared to October averages. This is a direct indicator of real network usage: fewer transfers = less capital rotation = weakening organic demand.
Stablecoin liquidity squeeze
The total volume of USDT and USDC held on exchanges (the primary source of “fast money”) has dropped by $2.4 billion in 14 days. Shrinking stablecoin reserves is a classic precursor to deeper and sharper price moves, as most margin buying is funded from these reserves.
Why this matters right now
When all three demand drivers reverse simultaneously, the market shifts into “thin liquidity” mode.
Any additional pressure (ETF outflows, whale selling, or macro-negative news) now triggers much stronger and faster price reactions than during periods of high liquidity.
What Exivara24 internal analytics show
Order-book depth on the top 5 exchanges is down 38–42 % versus October
Average BTC/USDT spread has widened from 0.008 % to 0.024 %
4-hour candle volatility has increased 61 % – every move is now “stretched”
Short-term scenarios from Exivara24
Base scenario (58 % probability)
Continued liquidity squeeze → test of $80,000 – $82,000 in the next 7–12 days → gradual stabilization and return above $90,000 after the holidays.
Bearish scenario (31 % probability)
Accelerated ETF outflows + continued DAT decline → break of $80,000 and fast move toward $72,000–75,000 (March 2025 lows).
Bullish scenario (11 % probability)
Unexpected major inflow (e.g., new large institutional buyer announcement or Fed dovish shift) → rapid reclaim above $95,000 as early as this week.
Exivara24 recommendations right now
Reduce or completely close leveraged long positions / move to spot or stablecoins
Prepare dry powder for entries in the $80,000–84,000 range – the most probable accumulation zone
Hard stops below $79,000 (weekly close) are mandatory
Watch ETF inflows and DAT dynamics – these two metrics will give the first reversal confirmation
Final take from Exivara24 – what this means for you right now
We see a clear picture: Bitcoin has entered a thin-liquidity stress phase, with the three key demand sources – ETFs, network activity, and stablecoins – all weakening at once.
This is not just a correction; it is structural compression that makes every price move sharper and more unpredictable.
Until these three trends reverse, downward pressure will remain dominant.
Yes, an unexpected catalyst (major institutional buyer, Fed softening, positive regulatory news) could flip the market in hours – but the current probability of that is only 11 %.
This is not the end of the bull cycle and not a “sell everything” signal.
It is a signal that easy money is gone.
The market has shifted into professional mode, where only those who:
strictly follow risk management
avoid unhedged leveraged longs
keep cash ready for buys at $80,000–84,000
are prepared for ±10–15 % swings in either direction within a day
…will survive and profit.
For us at Exivara24, this is not a crisis – it’s our normal working environment.
Our internal models switched to “liquidity stress” mode 10 days ago: we cut long exposure, strengthened hedging, and prepared client portfolios for the current conditions.
Result: average drawdown across all accounts in November is under 4.1 %, even on the worst days.
We don’t panic and we don’t get euphoric.
We just do our job: read capital flows, measure liquidity, and give you clear levels and actions.
If you want to get through this period calmly, with minimal losses (and ideally with profit on rebounds), now is the perfect time to join our real-time updates.
Full December protection & accumulation plan
Precise entry/exit levels and 24/7 alerts
Access to the private channel and morning/evening briefings

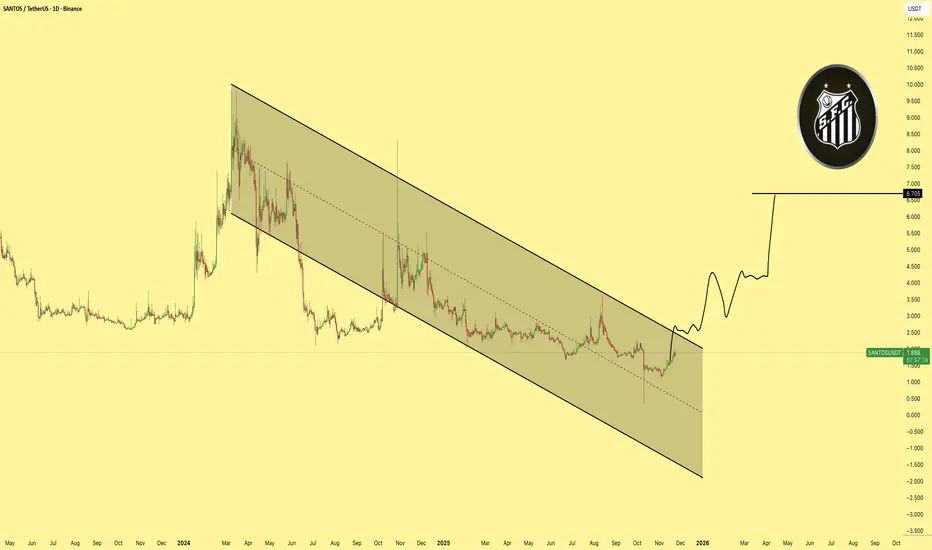
SANTOSCRYPTOCAP:SANTOS is looking strong as price presses against the channel resistance. Momentum is building and the structure suggests a breakout is close. Once it triggers, the move can accelerate quickly.
USD-JPY Local Short! Sell!
Hello,Traders!
USDJPY is tapping the horizontal supply after a sweep of internal liquidity, signaling distribution. If rejection confirms, expect a drop toward the next sell-side liquidity zone.
Time Frame 1H.
Sell!
Comment and subscribe to help us grow!
Check out other forecasts below too!
Disclosure: I am part of Trade Nation's Influencer program and receive a monthly fee for using their TradingView charts in my analysis.

QUICK$QUICK is heavily oversold and sitting right on the support level of its channel. This is a strong reversal zone and the setup supports a potential 190 percent move from the current price once momentum kicks in.

LINKBIST:LINK is holding support extremely well and the structure looks strong. If an ETF gets approved, it will be the catalyst that sends price breaking out and reaching the target with ease. Momentum is building and the chart is primed for expansion.

Bitcoin Pension Interest Grows as Inflation Pressures RiseBitcoin draws pension fund interest as inflation rises, offering a potential hedge while funds weigh volatility, regulations, and security.
Pension funds are known for being very careful with money. They focus on safety and long-term growth. But today, many of them face new challenges. Inflation is rising in many countries, and global tensions continue to affect markets. Because of this, several pension funds are now looking at Bitcoin again and asking if it can help protect value over time.
Why Pension Funds Are Paying Attention
Inflation has reduced the power of traditional investments and bonds do not always give strong returns. Gold, which many people trust, has also moved up and down in ways that worry long-term investors. As a result, some pension fund managers want new options.
Furthermore, Bitcoin offers a fixed supply of 21 million coins. This limited number interests investors who want assets that cannot be created or changed by governments. Many funds now see Bitcoin as something worth studying, even if they do not buy it yet.
Geopolitical events are also a factor. Conflicts, high interest rates, and global trade issues push investors to find assets that can survive uncertain times. Bitcoin’s global nature makes it a possible choice for these situations.
The Big Questions Pension Funds Ask
Pension funds still move slowly, and they must answer many questions before investing. One of the main concerns is volatility. Bitcoin prices go up and down very quickly. Moreover, funds want steady growth, not sudden jumps.
Regulations also matter, and different countries treat Bitcoin in different ways. Some offer clear rules while others change rules often. Pension funds prefer stable environments because they handle retirement savings.
Security is another important area. In the past, it was hard to store Bitcoin safely. Today, large banks and trusted financial companies offer secure storage. This gives investors more confidence, but some still want more time before making large commitments.
Small Steps Are Already Happening
A few pension funds in the United States, Canada and Australia have made small investments in Bitcoin-related products. These investments are small compared to the size of their portfolios, but they show growing interest. These early moves help other funds study how Bitcoin might behave during market stress.
What Comes Next?
Most pension funds will not jump into Bitcoin quickly. But the discussion has already begun. Many managers believe they must explore new ideas as the financial world changes. Bitcoin may not replace traditional assets, but it may become a small part of long-term strategies.
For now, pension funds continue to watch Bitcoin closely. As inflation and global risks grow, their interest in digital assets is likely to increase.

Bitcoin MA Breakout Setup: What Traders Should Watch Now📈 BTC/USDT – “BITCOIN VS TETHER” | Crypto Market Opportunity Blueprint (Day Trade)
🔥 Bullish Breakout Roadmap for Active Day Traders
🧭 PLAN:
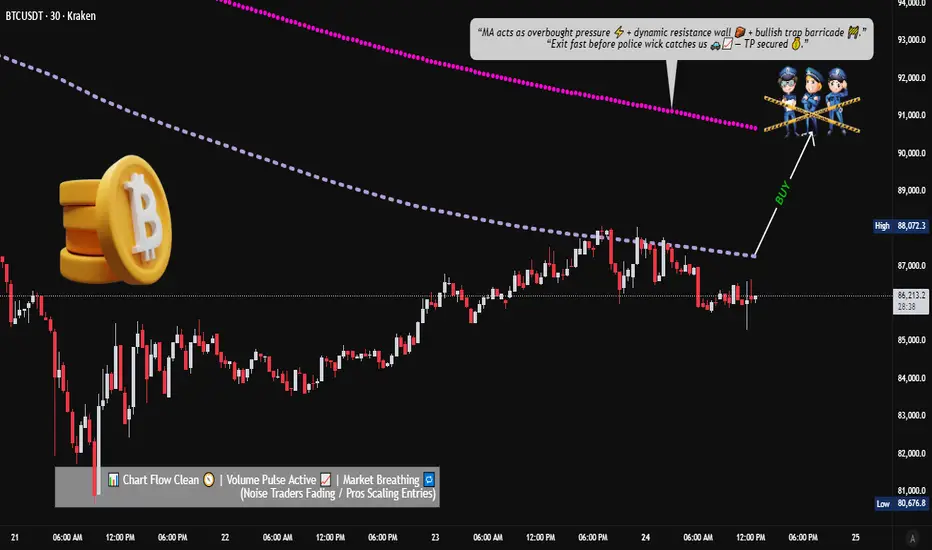
Price is attempting a bullish breakout above key moving averages. Once price clears $88,000, momentum buyers may step in and drive a continuation leg upward.
🎯 ENTRY (Breakout Confirmation):
▶ Enter at any price level AFTER a clean moving-average breakout above $88,000.
Look for strong candle closes + volume expansion.
🛑 STOP–LOSS (Risk Management First):
⚠️ This is MY thief-style SL: $84,000
Dear Ladies & Gentlemen (Thief OG’s) — manage your own risk according to your playbook.
This is only my SL, not a rule. You’re free to adjust based on your own risk appetite.
💰 TARGET:
Moving averages align as a dynamic resistance zone, combined with overbought conditions and potential bull-trap signals.
Secure profits responsibly.
▶ Target: $90,800
Again — Dear Ladies & Gentlemen (Thief OG’s), this TP is MY personal level.
Book profits your own way, at your own risk.
🔍 Related Crypto Pairs to Watch (Correlation + Key Notes)
1️⃣ ETH/USDT (Ethereum)
Highly correlated with BTC in bullish phases
Strong ETH movement often front-runs or confirms BTC breakouts
Watch for ETH strength → may add confidence to BTC breakout trades
2️⃣ BTC.D (Bitcoin Dominance)
Rising BTC dominance = Capital flowing into Bitcoin → Supports bullish continuation
Falling dominance = Altcoins gaining share → BTC breakouts may weaken or turn choppy
3️⃣ TOTAL / TOTAL2 (Crypto Market Cap Charts)
Confirms whether capital is entering the entire crypto market
TOTAL rising with BTC strength = broad market confidence
TOTAL flat/dropping during BTC’s rise = possible bull trap
4️⃣ SOL/USDT (Solana)
Solana often moves aggressively when BTC breaks out
Sharp SOL rallies can signal strong risk-on momentum across majors
5️⃣ USDT.D (USDT Dominance)
When USDT dominance drops → Traders moving out of stablecoins → Bullish risk appetite
When it spikes → Smart money hedging → BTC breakout may fail
6️⃣ BTC/USDT Perp Funding Rate
Positive & increasing funding = heavy long side → Potential squeeze
Neutral funding = healthy breakout
Negative funding = breakout might be fueled by short covering
📊 Market Tone:
BTC continues to show strong buyer interest, but resistance pockets remain.
Trade mechanically. Don’t chase candles. Let structure confirm itself.
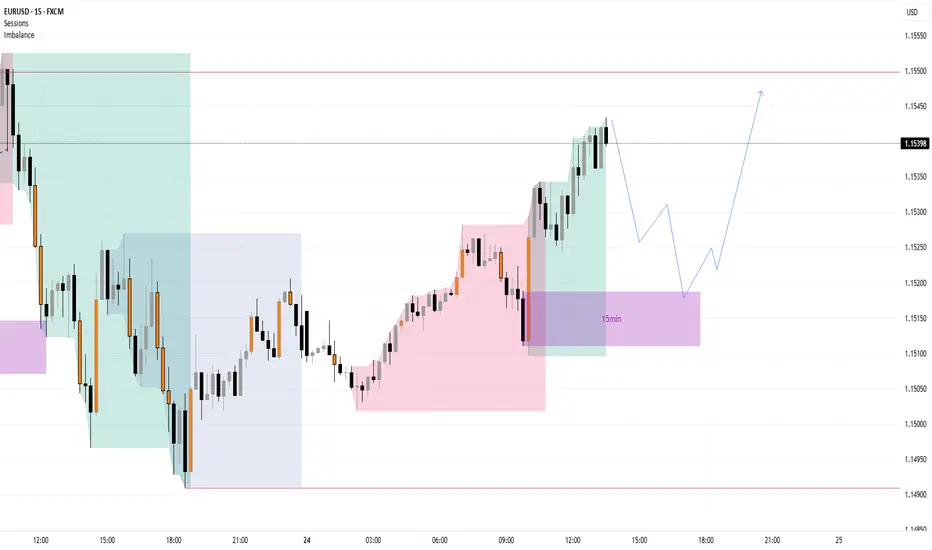
EURUSD Pullback Into 15min Orderblock Before Targeting LiquidityQuick Summary
EURUSD is expected to pull back into the 1.15191 15 Min orderblock, where a bullish reaction may form. If confirmed with a candle close and rejection signal, price may reverse upward toward the 1.15528 liquidity target on the H1 timeframe.
Full Analysis
Continuing the previous EURUSD outlook on the H4 timeframe, the pair is now approaching a notable orderblock around 1.15191. This zone has structural significance, as it aligns with the recent corrective leg and represents an area where institutional buying may reappear.
From a market-structure perspective, the movement toward this level appears corrective, suggesting that sellers may only be gathering liquidity before the next impulsive move higher. The market has a clear pool of targeted liquidity at 1.15528 on the H1 timeframe, making it a logical upside target if bullish orderflow resumes.
The preferred entry approach is a reaction from the 1.15191 orderblock, but only if the market provides proper confirmation. This includes a clear 15-minute candle close inside the zone, combined with a strong rejection signal, indicating that buyers are defending the level and absorbing sell-side liquidity.
If these confirmations align, the setup offers a clean continuation opportunity toward 1.15528, where liquidity rests above previous highs.
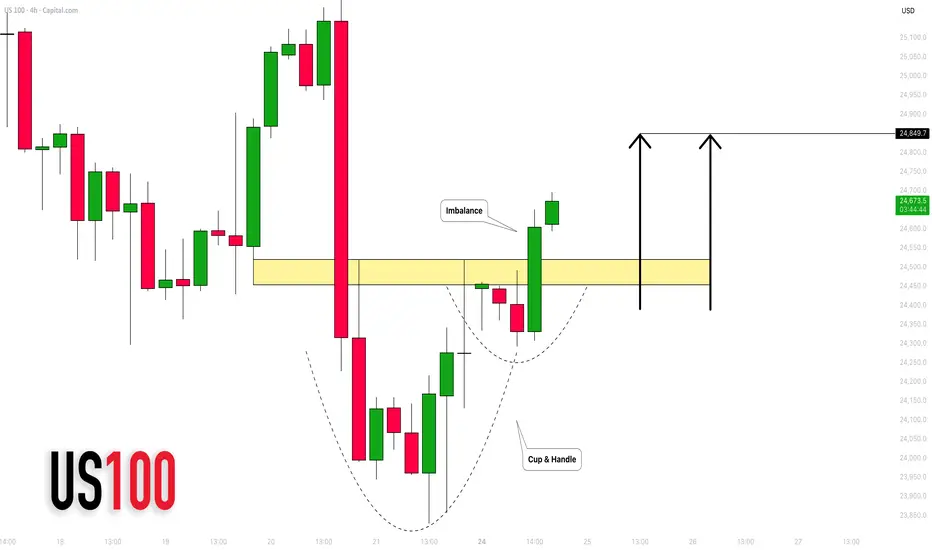
NASDAQ INDEX (US100): Strong Bullish Pattern
There is a high chance that US100 will rise
after a formation of a cup & handle pattern on a 4h time frame
with a breakout of its neckline with a bullish imbalance.
Expect a rise at least to 24850
❤️Please, support my work with like, thank you!❤️
I am part of Trade Nation's Influencer program and receive a monthly fee for using their TradingView charts in my analysis.
THE KOG REPORTTHE KOG REPORT:
In last week’s KOG Report we gave the potential path as well as the red box defence to look for any reaction in price. We managed to support the lower red box defence giving us a nice long to start the week then resulting in the higher defence holding and giving us an extremely decent short. It was only during the later part of the week we faced some choppy and whipsawing ranging which we decided wasn’t worth committing too much into, so we returned to scalping the red boxes only for the remainder of the week.
A decent week in Camelot, not only on Gold but the numerous other pairs we trade and analyse.
So, what can we expect in the week ahead?
It’s likely to be another week of choppy price action and potential for a range to develop even smaller than we’ve seen in previous sessions. We have the key level of support below again at 4040 while resistance above sits at key level of 4104. Economic news on Tuesday should bring volume and we would expect one of these levels to break open and the range to have accumulated enough to then move us into a clear direction.
We have added the red box defence up and down, ideally wanting a test of that low, so price going up on the open could represent opportunities to attempt the short unless defence is breached. Otherwise, we’ll look to take this into that 4000-3980 levels before we look for any RIPs.
RED BOXES:
Break below 4060 for 4055, 4050, 4041, 4033 and 4010 in extension of the move
Break above 4081 for 4095, 4103, 4120 and 4130 in extension of the move
Please do support us by hitting the like button, leaving a comment, and giving us a follow. We’ve been doing this for a long time now providing traders with in-depth free analysis on Gold, so your likes and comments are very much appreciated.
As always, trade safe.
KOG
