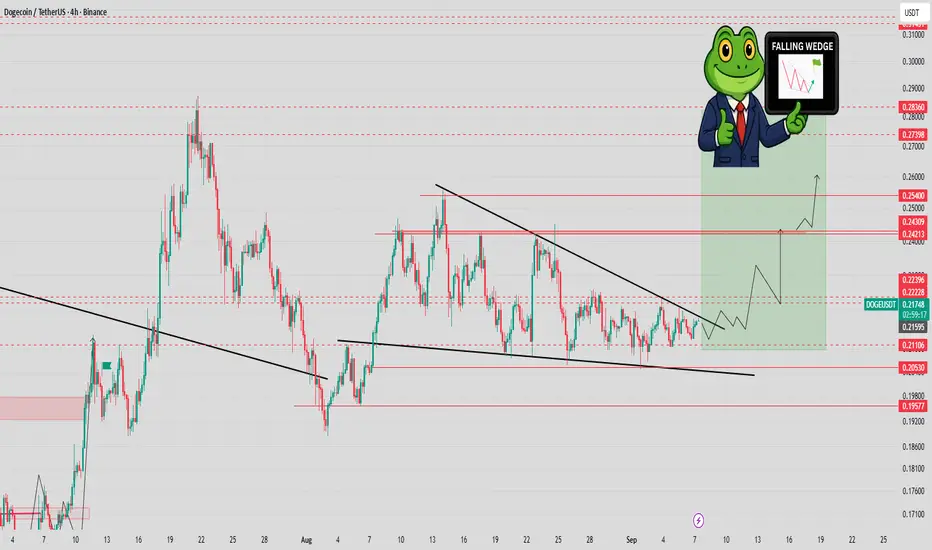
DOGE first ever ETF could launch in US next week!! 🚨 BREAKING NEWS: CRYPTOCAP:DOGE first-ever ETF could launch in the US next week!
Technicals also look bullish here 📈
Currently in a solid medium-term accumulation phase.
I’m expecting a 15%+ firework move soon, likely next week! 🎆
Long-term support:
$0.20500 - $0.20700
Are you ready for the next #DOGE rally?
Contains image
Babydoge - 1 Month+ falling wedge breakout#Babydoge - 1Month+ falling wedge brekout ✅
Bullish setup with a pump potential > 20% here 📈
A bullish consolidation & retest of the 0.0xx1220 - 0.xx1200$ would be pretty bullish for the next!

GOLD 1H CHART ROUTE MAP UPDATE & TRADING PLAN FOR THE WEEKHey Everyone,
Please see our updated 1h chart levels and targets for the coming week.
We are seeing price play between two weighted levels with a gap above at 3593 and a gap below at 3562. We will need to see ema5 cross and lock on either weighted level to determine the next range.
We will see levels tested side by side until one of the weighted levels break and lock to confirm direction for the next range.
We will keep the above in mind when taking buys from dips. Our updated levels and weighted levels will allow us to track the movement down and then catch bounces up.
We will continue to buy dips using our support levels taking 20 to 40 pips. As stated before each of our level structures give 20 to 40 pip bounces, which is enough for a nice entry and exit. If you back test the levels we shared every week for the past 24 months, you can see how effectively they were used to trade with or against short/mid term swings and trends.
The swing range give bigger bounces then our weighted levels that's the difference between weighted levels and swing ranges.
BULLISH TARGET
3593
EMA5 CROSS AND LOCK ABOVE 3593 WILL OPEN THE FOLLOWING BULLISH TARGETS
3613
EMA5 CROSS AND LOCK ABOVE 3613 WILL OPEN THE FOLLOWING BULLISH TARGET
3638
EMA5 CROSS AND LOCK ABOVE 3638 WILL OPEN THE FOLLOWING BULLISH TARGET
3658
BEARISH TARGETS
3562
EMA5 CROSS AND LOCK BELOW 3562 WILL OPEN THE FOLLOWING BEARISH TARGET
3528
EMA5 CROSS AND LOCK BELOW 3528 WILL OPEN THE SWING RANGE
3492
3470
EMA5 CROSS AND LOCK BELOW 3470 WILL OPEN THE SECONDARY SWING RANGE
3438
3408
As always, we will keep you all updated with regular updates throughout the week and how we manage the active ideas and setups. Thank you all for your likes, comments and follows, we really appreciate it!
Mr Gold
GoldViewFX

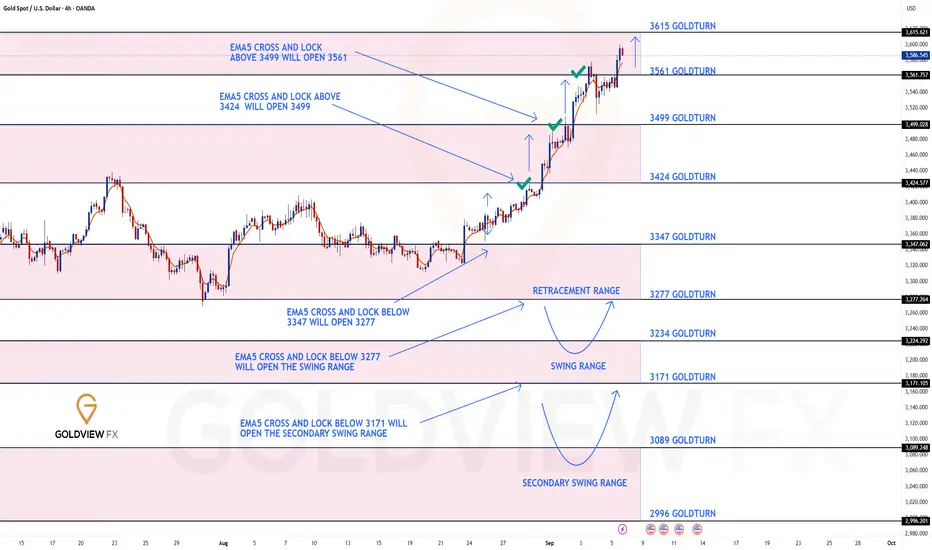
GOLD 4H CHART ROUTE MAP UPDATE & TRADING PLAN FOR THE WEEKHey Everyone,
This is still a follow up update on our 4chart idea which is still valid and in play with the final gap still in range.
Previously we had our Bullish target 3424 and finished off with ema5 cross and lock above this level opening 3499. This gap was filled last week just like we analysed followed with another cross and lock above 3499 opening 3561, which was also hit.
We now finished off last week with a cross and lock above 3561 leaving 3615 open. Failure to test this final target will see lower Goldturns tested for support and bounce.
We will keep the above in mind when taking buys from dips. Our updated levels and weighted levels will allow us to track the movement down and then catch bounces up.
We will continue to buy dips using our support levels taking 20 to 40 pips. As stated before each of our level structures give 20 to 40 pip bounces, which is enough for a nice entry and exit. If you back test the levels we shared every week for the past 24 months, you can see how effectively they were used to trade with or against short/mid term swings and trends.
The swing range give bigger bounces then our weighted levels that's the difference between weighted levels and swing ranges.
BULLISH TARGET
3424 - DONE
EMA5 CROSS AND LOCK ABOVE 3424 WILL OPEN THE FOLLOWING BULLISH TARGETS
3499 - DONE
EMA5 CROSS AND LOCK ABOVE 3499 WILL OPEN THE FOLLOWING BULLISH TARGET
3561 - DONE
EMA5 CROSS AND LOCK ABOVE 3561 WILL OPEN THE FOLLOWING BULLISH TARGET
2615 -
BEARISH TARGETS
3347
EMA5 CROSS AND LOCK BELOW 3347 WILL OPEN THE FOLLOWING BEARISH TARGET
3277
EMA5 CROSS AND LOCK BELOW 3277 WILL OPEN THE SWING RANGE
3234
3171
EMA5 CROSS AND LOCK BELOW 3171 WILL OPEN THE SECONDARY SWING RANGE
3089
2996
As always, we will keep you all updated with regular updates throughout the week and how we manage the active ideas and setups. Thank you all for your likes, comments and follows, we really appreciate it!
Mr Gold
GoldViewFX
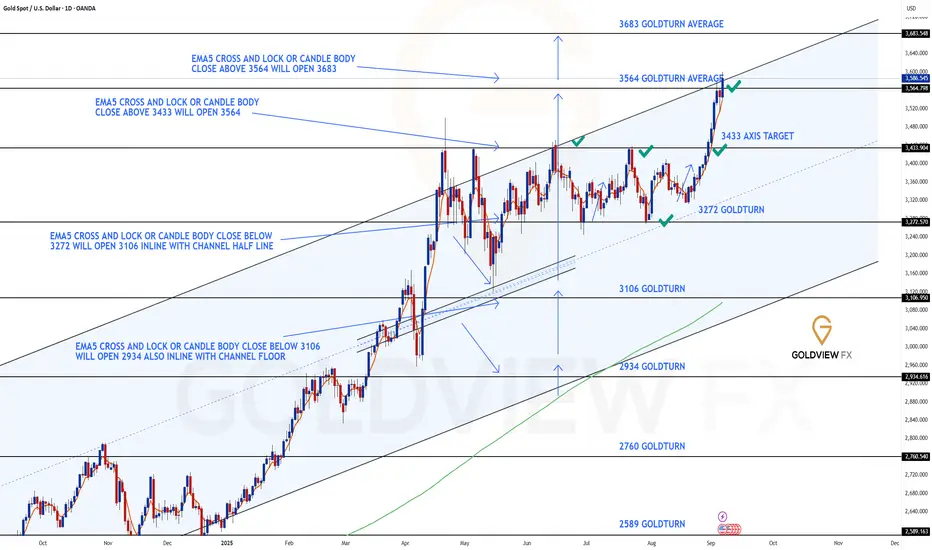
GOLD DAILY CHART ROUTE MAPDaily Chart Update
Range Break, Gap Confirmation & Next Target Achieved
As anticipated in our previous update, price finally pushed through for a test of 3433, confirming the strength of the upside momentum we discussed. This test produced a candle body close gap open for 3564, which has now been successfully achieved just as projected.
The close above 3564 further unlocks 3683 as the next long-term upside target. An EMA5 lock will serve as added confirmation for continuation toward this zone. Meanwhile, both 3564 and 3433 now transition into key support levels for this chart idea.
Current Outlook
🔹 3564 Target Reached
Our gap target has now been completed with a decisive candle body close above. This confirms bullish continuation and shifts focus to the next zone.
🔹 Next Objective – 3683
The successful 3564 break opens a fresh long-term target at 3683. EMA5 lock confirmation will strengthen the case for this move.
Updated Key Levels
📉 Support – 3272 (pivotal floor)
📉 Short Term Supports – 3433 & 3564
📈 Resistance / Next Upside Objective – 3683
Thanks as always for your continued support,
Mr Gold
GoldViewFX
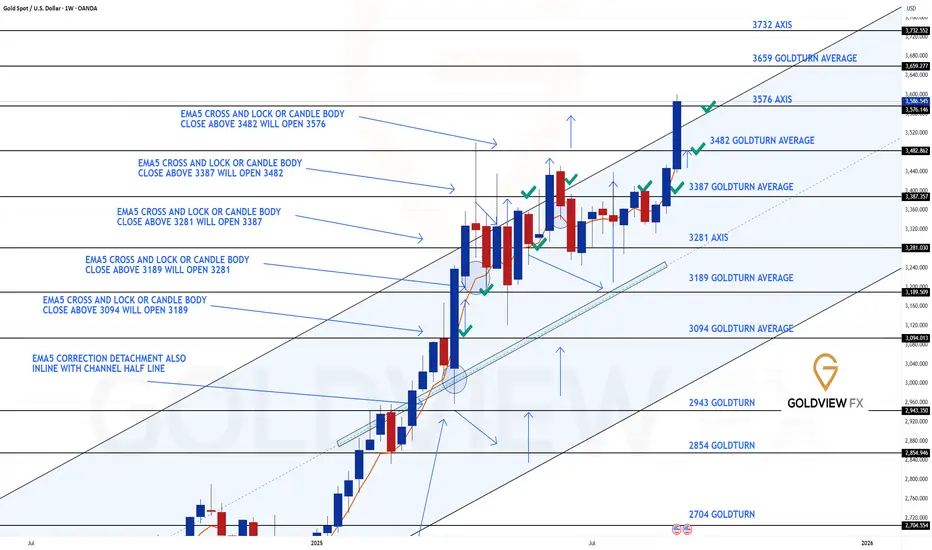
GOLD WEEKLY CHART MID/LONG TERM ROUTE MAPWeekly Chart Update
As anticipated, we got the 3482 gap target hit just as projected. Momentum carried further into the final channel top target at 3576, completing the upper channel move.
Current Outlook
🔹 Gap Targets Achieved
Both 3482 and 3576 have now been met. Price action delivered cleanly into these objectives, validating the prior bullish structure.
🔹 Candle Body Close Above 3576
The weekly body close above the channel top at 3576 has now opened the door to the larger 3659 long-term gap target. EMA5 would provide further confirmation if momentum sustains.
🔹 Channel Top Now Key Test
We need to see 3576 - 3482 (channel top) hold as support to confirm the new range zone play. If it holds, the 3659 - 3732 range becomes the next bullish zone. Failure to provide support above 3482 - 3576 will mean the breakout is short-lived, with risk of a swift correction back down.
🔹 Range Support Levels
3576 and 3482 now act as layered support levels to keep the bullish case intact within this range.
Updated Levels to Watch
📉 Support – 3482 & 3576
Key supports for this new range. Holding above 3576 strengthens the case for continuation toward 3659. A failure back below 3576 puts 3482 into play as the next defensive level.
📈 Resistance – 3659
The newly opened long-term gap target. This becomes the next upside objective if structure holds above 3576.
Plan
With 3482 and 3576 achieved, focus shifts to the 3659 gap. The bullish continuation depends on 3576 holding as support. If buyers defend it, the range extends upward into new territory. If not, expect a sharp corrective move back into the prior range.
Thanks as always for your support,
Mr Gold
GoldViewFX
BTC - Bullish continuation in the makingMarket Context
BTC has recently broken out of a long-standing descending trendline, marking a significant shift in sentiment. This breakout signals the end of the controlled downtrend and sets the stage for a possible bullish continuation. At the same time, the chart shows a clear sweep of sell-side liquidity at the lows, which often serves as the fuel for a reversal.
Trendline Breakout & Liquidity Sweep
The bullish breakout of the old upper trendline is an important technical event. Combined with the earlier sell-side liquidity sweep, this suggests that downside liquidity has been cleared and that the path of least resistance could now be higher. Such a combination often marks the start of a new leg in the trend.
Market Structure Shift Retest
Following the breakout, price has pushed higher and printed a market structure shift (MSS). The current retest of this MSS zone will be key — if it holds, it provides the ideal spot for bulls to reload positions. This retest acts as confirmation that the breakout is valid, not just a short-lived deviation.
Next Liquidity Grab & Upside Targets
Above the current range sits a clear buy-side liquidity pool. The next logical move would be a grab of that liquidity, which could extend into a more aggressive bullish expansion toward higher levels. The structure suggests a stair-step move higher: liquidity grab, retest, and then continuation toward 115k–117k zones.
Final Thoughts
The sell-side liquidity sweep, trendline breakout, and market structure shift all point to a bullish shift in momentum. The key lies in how price reacts to the retest — hold it, and the next liquidity levels are likely to be taken.
If this breakdown helped clarify the setup, a like is much appreciated — and let me know in the comments: are you playing the retest, or waiting for the liquidity grab above?

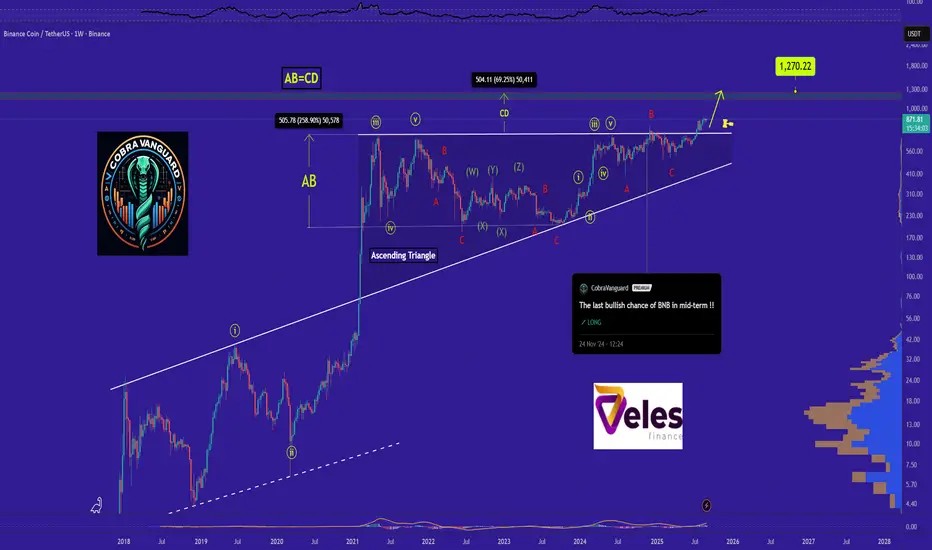
BNB is bullish now and many Traders don't see it !!As I said, BNB broke the triangle, it could surge to $1000 , and you still think I'm joking!!
The price is currently supported well, which can increase the price.
Stay Awesome , CobraVanguard
Previous analysis
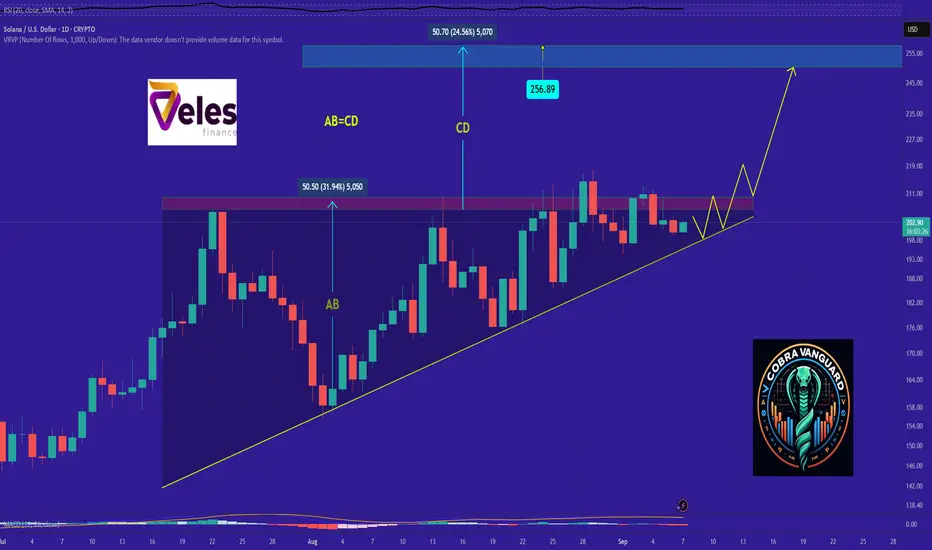
SOL analysis.Give me some energy !!!The price on the daily timeframe is within an ascending triangle, which can be promising. If the price breaks this pattern with bullish candles, it could easily rise by the distance of AB=CD .
Best regards CobraVanguard.💚
HOW TO USE GANN FAN AS BEST TRADING TOOLLook for a high or low point in the security's price action — this point will be the starting point for drawing the Gann fan. Draw a line from the starting point to the current price action — this first line is called the “1×1 line” and is drawn at an angle 45 degree.
The most important angle is 45 degree or 1/1 line.
45 degree angle and 4 other angles below:-
1X8 82.5°
1X4 75°
1X3 71.25°
1X2 63.75°
1X1 45°
2X1 26.25°
3X1 18.75°
4X1 15°
8X1 7.5°

BTC's Situation, A Comprehensive Analysis !!!As you can see, after breaking the bearish wedge, the price dropped sharply. The question is, how far will this price decline continue? In my opinion, the price could remain bearish until the PRZ (Potential Reversal Zone), which is around the 107500 level. After that, an increase in buying pressure could lead to a price rise to higher levels.

EURUSDEURUSD 4H SELL
The market is not used to a straight path, so it moves with parallax.
We need a price correction before further upside

Gold Retreats After $3597 ATH🔎Gold Outlook (Post-NFP)
• Main Trend: Gold remains in a strong uptrend, supported by weak NFP data → weaker USD → almost certain Fed rate cut in September.
• Short-term Support: $3,573 (tested and bounced 1–2 times). If broken, the next supports are at $3,560 and deeper at $3,545.
• Near-term Resistance: $3,590 – $3,600 (ATH). A breakout here could target $3,620–$3,630.
• EMA & Momentum: Price is still above the EMA9 & EMA21 on H1/H4, indicating the bullish trend remains intact, though momentum has slowed after hitting ATH.
• Market Sentiment: After a sharp rally, the market is pausing for consolidation — a healthy sign in a broader uptrend.
📌 Conclusion : In the short term, gold may consolidate between $3,573–$3,590 before choosing direction. Holding above $3,573 increases the chance of retesting $3,600 and higher. A break below $3,573 could trigger a deeper pullback toward $3,560–$3,545.

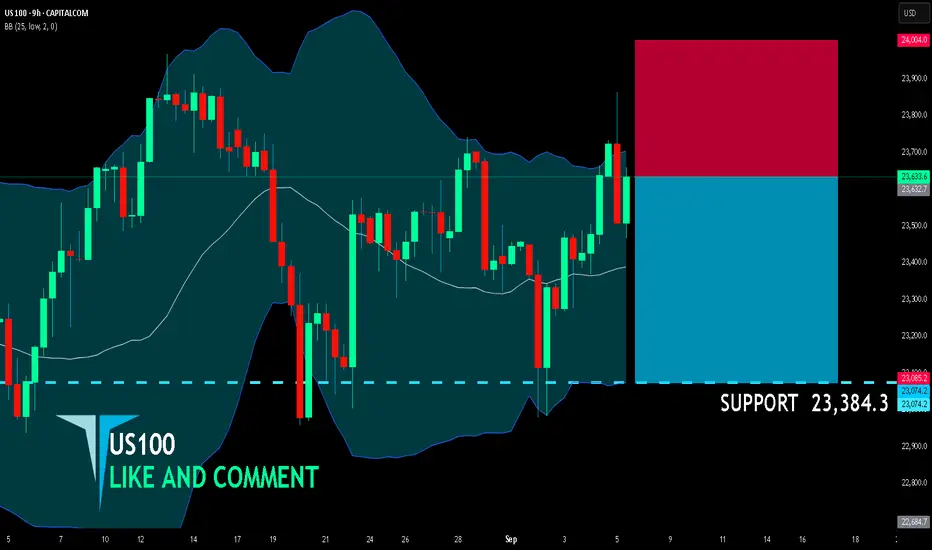
US100 SHORT FROM RESISTANCE
US100 SIGNAL
Trade Direction: short
Entry Level: 23,632.7
Target Level: 23,384.3
Stop Loss: 24,004.0
RISK PROFILE
Risk level: medium
Suggested risk: 1%
Timeframe: 9h
Disclosure: I am part of Trade Nation's Influencer program and receive a monthly fee for using their TradingView charts in my analysis.
✅LIKE AND COMMENT MY IDEAS✅
GBP/AUD BEARS WILL DOMINATE THE MARKET|SHORT
Hello, Friends!
Previous week’s green candle means that for us the GBP/AUD pair is in the uptrend. And the current movement leg was also up but the resistance line will be hit soon and upper BB band proximity will signal an overbought condition so we will go for a counter-trend short trade with the target being at 2.047.
Disclosure: I am part of Trade Nation's Influencer program and receive a monthly fee for using their TradingView charts in my analysis.
✅LIKE AND COMMENT MY IDEAS✅

EUR/CHF BEARS ARE GAINING STRENGTH|SHORT
Hello, Friends!
EUR/CHF is making a bullish rebound on the 17H TF and is nearing the resistance line above while we are generally bearish biased on the pair due to our previous 1W candle analysis, thus making a trend-following short a good option for us with the target being the 0.934 level.
Disclosure: I am part of Trade Nation's Influencer program and receive a monthly fee for using their TradingView charts in my analysis.
✅LIKE AND COMMENT MY IDEAS✅

GBP/CHF SENDS CLEAR BEARISH SIGNALS|SHORT
Hello, Friends!
We are going short on the GBP/CHF with the target of 1.076 level, because the pair is overbought and will soon hit the resistance line above. We deduced the overbought condition from the price being near to the upper BB band. However, we should use low risk here because the 1W TF is green and gives us a counter-signal.
Disclosure: I am part of Trade Nation's Influencer program and receive a monthly fee for using their TradingView charts in my analysis.
✅LIKE AND COMMENT MY IDEAS✅

NZD/JPY BULLS ARE GAINING STRENGTH|LONG
Hello, Friends!
NZD-JPY downtrend evident from the last 1W red candle makes longs trades more risky, but the current set-up targeting 87.632 area still presents a good opportunity for us to buy the pair because the support line is nearby and the BB lower band is close which indicates the oversold state of the NZD/JPY pair.
Disclosure: I am part of Trade Nation's Influencer program and receive a monthly fee for using their TradingView charts in my analysis.
✅LIKE AND COMMENT MY IDEAS✅

CAD/JPY BULLISH BIAS RIGHT NOW| LONG
CAD/JPY SIGNAL
Trade Direction: short
Entry Level: 106.355
Target Level: 107.547
Stop Loss: 105.559
RISK PROFILE
Risk level: medium
Suggested risk: 1%
Timeframe: 9h
Disclosure: I am part of Trade Nation's Influencer program and receive a monthly fee for using their TradingView charts in my analysis.
✅LIKE AND COMMENT MY IDEAS✅

NZD/CAD LONG FROM SUPPORT
NZD/CAD SIGNAL
Trade Direction: long
Entry Level: 0.807
Target Level: 0.814
Stop Loss: 0.803
RISK PROFILE
Risk level: medium
Suggested risk: 1%
Timeframe: 12h
Disclosure: I am part of Trade Nation's Influencer program and receive a monthly fee for using their TradingView charts in my analysis.
✅LIKE AND COMMENT MY IDEAS✅

GBP/NZD BULLS WILL DOMINATE THE MARKET|LONG
Hello, Friends!
GBP/NZD pair is trading in a local uptrend which know by looking at the previous 1W candle which is green. On the 2H timeframe the pair is going down. The pair is oversold because the price is close to the lower band of the BB indicator. So we are looking to buy the pair with the lower BB line acting as support. The next target is 2.297 area.
Disclosure: I am part of Trade Nation's Influencer program and receive a monthly fee for using their TradingView charts in my analysis.
✅LIKE AND COMMENT MY IDEAS✅

CAD/CHF BEARS ARE STRONG HERE|SHORT
Hello, Friends!
We are going short on the CAD/CHF with the target of 0.578 level, because the pair is overbought and will soon hit the resistance line above. We deduced the overbought condition from the price being near to the upper BB band. However, we should use low risk here because the 1W TF is green and gives us a counter-signal.
Disclosure: I am part of Trade Nation's Influencer program and receive a monthly fee for using their TradingView charts in my analysis.
✅LIKE AND COMMENT MY IDEAS✅

USD/JPY SELLERS WILL DOMINATE THE MARKET|SHORT
Hello, Friends!
It makes sense for us to go short on USD/JPY right now from the resistance line above with the target of 147.408 because of the confluence of the two strong factors which are the general downtrend on the previous 1W candle and the overbought situation on the lower TF determined by it’s proximity to the upper BB band.
Disclosure: I am part of Trade Nation's Influencer program and receive a monthly fee for using their TradingView charts in my analysis.
✅LIKE AND COMMENT MY IDEAS✅
