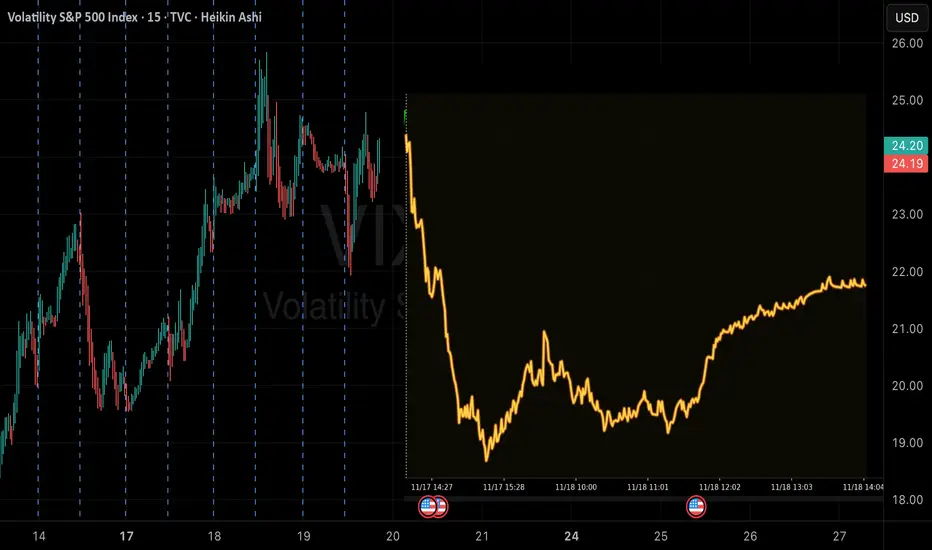
QuantSignals V3: High-Confidence VIX DowntrendVIX QuantSignals Katy 1M Prediction (2025-11-19)
Current Price: $22.40
Trend: Bearish
Confidence: 75%
Volatility: 94.1%
Final Prediction: $20.98 (-6.34%)
30-Min Target: $21.10 (-5.81%)
Trade Signal:
Direction: PUT
Entry: $22.40
Target: $21.26
Stop Loss: $22.74
Expected Move: -6.34%
Summary: 1 trade signal generated from 1 successful analysis.
Contains image
AUD-CAD Bullish Rebound Ahead! Buy!
Hello,Traders!
AUDCAD made a nice bearish stretch but is now hovering above a strong demand level so as the bullish pressure builds, we might see a move up towards the inefficiency above.Time Frame 5H.
Sell!
Comment and subscribe to help us grow!
Check out other forecasts below too!
Disclosure: I am part of Trade Nation's Influencer program and receive a monthly fee for using their TradingView charts in my analysis.

WMT Earnings: Neutral AI + Bearish Flow = No-Trade ZoneMT QuantSignals V3 — Earnings (2025-11-19)
Signal: NEUTRAL (NO TRADE)
Confidence: 50% | Low Conviction
📈 Price & Volatility
Last Price: $100.41
24h Move: –2.47%
Implied Move: $5.21 (5.2%)
Support: $99.68
Resistance: $103.34
Volume: 0.8× average (light participation)
📊 Signal Breakdown
Katy AI:
Neutral forecast
Predicted range: $100.09 – $100.82 (very tight, no directional edge)
Expected volatility: 0.0%
Technical Indicators:
RSI: 44.9 (neutral)
MACD: –0.2619 (weak bearish)
Momentum: Flat / low conviction
Options Flow:
PCR: 1.62 (bearish → heavy puts)
Unusual flow: $110 puts (institutional hedging)
News Sentiment:
Mixed
Acquisition news (long-term bullish)
Near-term earnings uncertainty → no clear direction
⚠️ Risk Summary
High volatility expected (5.2% implied move)
No edge from AI, technicals, or flow
VIX elevated → earnings risk amplified
🚫 Trade Decision
NO TRADE — Insufficient directional conviction (<55%)
Wait for post-earnings movement or a stronger signal.

AUDJPY Massive Short! SELL!
My dear followers,
This is my opinion on the AUDJPY next move:
The asset is approaching an important pivot point 101.34
Bias - Bearish
Technical Indicators: Supper Trend generates a clear short signal while Pivot Point HL is currently determining the overall Bearish trend of the market.
Goal - 100.96
About Used Indicators:
For more efficient signals, super-trend is used in combination with other indicators like Pivot Points.
Disclosure: I am part of Trade Nation's Influencer program and receive a monthly fee for using their TradingView charts in my analysis.
———————————
WISH YOU ALL LUCK

NVDA Earnings Play: Bullish Calls Despite Katy Neutral BiasNVDA QuantSignals V3 — Earnings Play (2025-11-19)
Direction: BUY CALLS
Confidence: 68% (Medium Conviction)
Risk Level: Moderate
🎯 Trade Setup
Strike: $180
Expiry: 2025-11-21
Entry Range: $9.30 – $9.40
Target 1: $18.60
Target 2: $27.90
Stop Loss: $4.65
Position Size: 3%
📈 Key Metrics
Current Price: $185.06
Implied Move: $13.15 (7.1%)
PCR: 0.46 (Bullish)
24h Move: +0.48%
RSI: 31.3
Support: $180.52
🧠 Analysis Snapshot
Katy AI Prediction: Neutral → slight bearish drift toward $183.56–184.20
Technical Indicators: Mixed (MACD bullish, ROC bearish)
News Sentiment: Strongly Bullish
$100B AI infra deal w/ Brookfield
Presidential endorsement
AI chip testing breakthroughs
Options Flow: Heavy call activity; institutional size at higher strikes
Volatility: VIX 23.25 — elevated
⚡ Why This Trade Works
Bullish news + strong call flow overpowers Katy’s neutral/slightly bearish modeling
Earnings volatility + catalysts create a favorable upside skew
0.63 delta strike gives balanced risk/reward
⚠️ Notes
Moderate confidence → consider smaller sizing
Expect heavy volatility due to 7.1% implied earnings move
Low pre-earnings volume → scale entries if possible

AUDUSD What Next? BUY!
My dear friends,
AUDUSD looks like it will make a good move, and here are the details:
The market is trading on 0.6461 pivot level.
Bias - Bullish
Technical Indicators: Supper Trend generates a clear long signal while Pivot Point HL is currently determining the overall Bullish trend of the market.
Goal - 0.6485
Recommended Stop Loss - 0.6451
About Used Indicators:
Pivot points are a great way to identify areas of support and resistance, but they work best when combined with other kinds of technical analysis
Disclosure: I am part of Trade Nation's Influencer program and receive a monthly fee for using their TradingView charts in my analysis.
———————————
WISH YOU ALL LUCK

Gold 30-Min — Volume Buy Reversal Triggered⚡Base : Hanzo Trading Alpha Algorithm
The algorithm calculates volatility displacement vs liquidity recovery, identifying where probability meets imbalance.
It trades only where precision, volume, and manipulation intersect —only logic.
✈️ Technical Reasons
/ Direction — LONG / Reversal 4068 Area
☄️Bullish momentum confirmed through strong candle body.
☄️Structure shifted with higher-low near key demand base.
☄️Volume expanding confirms order-flow alignment upward.
☄️Buyers reclaimed imbalance with sustained clean break.
☄️Algorithm detects rising momentum under low liquidity.
⚙️ Hanzo Alpha Trading Protocol
The Alpha Candle defines the day’s real control zone — the first battle of momentum.
From this origin, the Volume Window reveals where the next precision strike begins.
⚙️ Hanzo Volume Window / Map
Window tracked from 10:30 — mapping true market behavior.
POC alignment exposes institutional bias and breakout potential zones.
⚙️ Hanzo Delta Window / Pulse
Delta window monitors real buying vs. selling power behind each move.
Tracks volume aggression to expose who controls the candle — buyers or sellers.
When Delta aligns with Volume Map, momentum becomes undeniable.

$BTC Correction 3 in Progress – Exactly on Script!KUCOIN:BTCUSDT CRYPTOCAP:BTC Correction 3 in Progress – Exactly on Script! 📉🚨
Altcoin Pioneers! ⚡ Bitcoin is following the historical fractal to the dot:
- Correction 1: -34% ✅
- Correction 2: -32% ✅
- Correction 3: currently -29.5% and counting (price ~89,130)
We’re now deep into the scariest phase of every bull market – the one that shakes out weak hands before the real parabolic run. This weekly candle is testing the 0.618 Fib + previous cycle highs zone (~84–88k).
What happens next:
- Hold 84k → final capitulation wick → explosive markup to 150k+
- Lose 84k decisively → extended correction toward 70–74k (less likely)
Indicators: Weekly RSI at 58 (still healthy), no bearish divergence yet, volume rising on panic = perfect washout setup.
Bias: This is the ultimate buy-the-fear moment as long as we stay above 84k. History says the biggest gains come right after Correction 3. Stay strong! 🐂💎
#Bitcoin #BTCFractal #BullMarket

THE KOG REPORT - UpdateEnd of day update from us here at KOG:
Not a bad day at all on the markets with our plan working well getting the long from defence into the red box defence, completing our red box targets upside before the rejection and the opportunity to short it back into where we are now.
Now, we have support at the 4065 level and resistance at the 4095 region which is where we have place the arrows. We'll have to wait for a reaction at either level, however, we have a tiny gap downside which price may come back for and give us another undercut low over the Asian session. Due to it being an extremely successful week so far, we'll wait for the market to close and then have a look with a fresh mind tomorrow.
As always, trade safe.
KOG

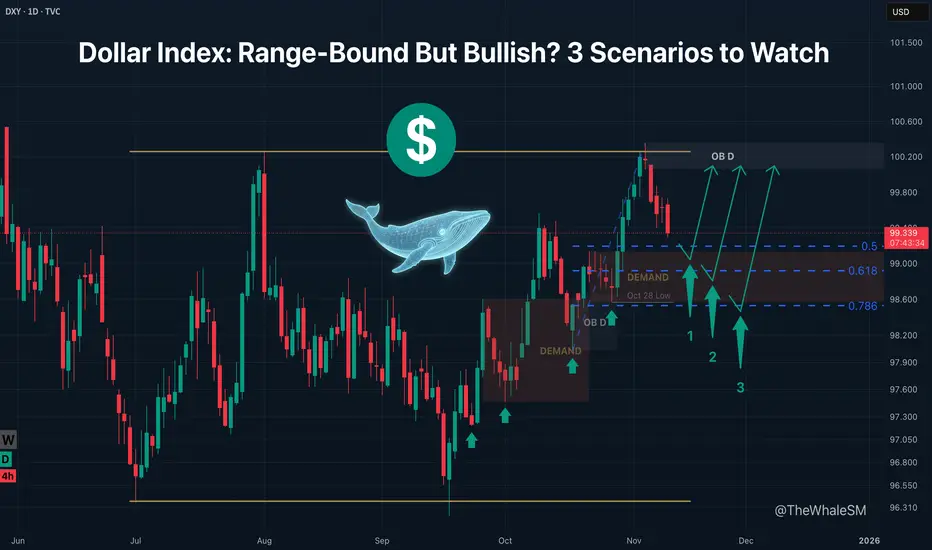
Dollar Index: Range-Bound But Bullish? 3 Scenarios to WatchThe Dollar Index ( TVC:DXY ) is in a global range, within which there is a bullish daily order flow. This flow is manifesting as a sequential mitigation of, and reversal from, imbalances and manipulation zones.
On November 5th, a deviation above the global range occurred, sweeping external liquidity. This was engineered by a manipulation in the form of a Daily Order Block . Following this, the index began a corrective decline and is now approaching a POI (Demand Zone) and potential Fibonacci reversal levels.
Long positions can be considered from one of these levels, targeting the upper boundary of the range (the mitigation of the Daily OB).
SCENARIO 1: Requires price to find acceptance above the 50% level upon reaching it and mitigating the Demand Zone.
SCENARIO 2: If this level is broken, the next 61.8% level (also inside the Demand Zone) may act as support.
SCENARIO 3: If this level is also broken, a liquidity sweep of the Oct 28 low is highly probable, which would be accompanied by a test of the 78.6% Fib level .
The entry condition for a long setup from each level is confirmed acceptance above it and the beginning of a bullish order flow on a lower timeframe .
~~~~~~~~~~~~~~~~~~~~~~~~~~~~~~~~~~~~~~~~~~~~~~~~~~~~~~~~~~~~~~~~~
The principles and conditions for forming the manipulation zones I show in this trade idea are detailed in my educational publication, which was chosen by TradingView for the "Editor's Picks" category and received a huge amount of positive feedback from this insightful trading community. To better understand the logic I've used here and the general principles of price movement in most markets from the perspective of institutional capital, I highly recommend checking out this guide if you haven't already. 👇
P.S. This is not a prediction of the exact price direction. It is a description of high-probability setups that become valid only if specific conditions are met when the price reaches the marked POI. If the conditions are not met, the setups are invalid. No setup has a 100% success rate, so if you decide to use this trade idea, always apply a stop-loss and proper risk management. Trade smart.
~~~~~~~~~~~~~~~~~~~~~~~~~~~~~~~~~~~~~~~~~~~~~~~~~~~~~~~~~~~~~~~~~
If you found this analysis helpful, support it with a Boost! 🚀
Have a question or your own view on this idea? Share it in the comments. 💬
► Follow me on TradingView for timely updates on THIS idea (entry, targets & live trade management) and not to miss my next detailed breakdown.
~~~~~~~~~~~~~~~~~~~~~~~~~~~~~~~~~~~~~~~~~~~~~~~~~~~~~~~~~~~~~~~~~
GOLD 1H CHART ROUTE MAP UPDATE & TRADING PLAN FOR THE WEEKHey Everyone,
Please see our updated 1h chart levels and targets for the coming week.
We are seeing price play between two weighted levels with a gap above at 4114 and a gap below at 4057. We will need to see ema5 cross and lock on either weighted level to determine the next range.
We will see levels tested side by side until one of the weighted levels break and lock to confirm direction for the next range.
We will keep the above in mind when taking buys from dips. Our updated levels and weighted levels will allow us to track the movement down and then catch bounces up.
We will continue to buy dips using our support levels taking 20 to 40 pips. As stated before each of our level structures give 20 to 40 pip bounces, which is enough for a nice entry and exit. If you back test the levels we shared every week for the past 24 months, you can see how effectively they were used to trade with or against short/mid term swings and trends.
The swing range give bigger bounces then our weighted levels that's the difference between weighted levels and swing ranges.
BULLISH TARGET
4114
EMA5 CROSS AND LOCK ABOVE 4114 WILL OPEN THE FOLLOWING BULLISH TARGETS
4175
EMA5 CROSS AND LOCK ABOVE 4175 WILL OPEN THE FOLLOWING BULLISH TARGET
4232
EMA5 CROSS AND LOCK ABOVE 4232 WILL OPEN THE FOLLOWING BULLISH TARGET
4289
EMA5 CROSS AND LOCK ABOVE 4289 WILL OPEN THE FOLLOWING BULLISH TARGET
4361
BEARISH TARGETS
4057
EMA5 CROSS AND LOCK BELOW 4057 WILL OPEN THE FOLLOWING BEARISH TARGET
4006
EMA5 CROSS AND LOCK BELOW 4006 WILL OPEN THE FOLLOWING BEARISH TARGET
3965
EMA5 CROSS AND LOCK BELOW 3965 WILL OPEN THE SWING RANGE
3923
3861
As always, we will keep you all updated with regular updates throughout the week and how we manage the active ideas and setups. Thank you all for your likes, comments and follows, we really appreciate it!
Mr Gold
GoldViewFX

Bitcoin W1 (Wave Analysis) Scenario 3 - Update 19/11/2025Bitcoin W1 (Wave Analysis) Scenario 3 - Update 19/11/2025
Chart movement is behaviour.
Regards,

Bitcoin W1 (Wave Analysis) Scenario 2 - Update 19/11/2025Bitcoin W1 (Wave Analysis) Scenario 2 - Update 19/11/2025
chart has Language

Bitcoin W1 (Wave Analysis) Scenario 1 - Update 19/11/2025Bitcoin W1 (Wave Analysis) Scenario 1 - Update 19/11/2025
you can red the chart
Regards,

BTC.D Something In The Pipeline For AltcoinsBTC.D
Bitcoin looking very scary again hanging around $89K, but Bitcoin Dominance signalling there is something yet for altcoins.
Notice that it is moving up today, but within a downtrend and structure is not broken.
That said Bitcoin is close to breaking structure, so they can of course tumble with Bitcoin if it doesn't hold the Golden Window ratio 🧐.
This analysis is shared for educational purposes only and does not constitute financial advice. Please conduct your own research before making any trading decisions.

Triple Combo GU HSC PL WLGU is touching last week's low support, DXY is lingering in 100.00 PL zone, betting on a quick DXY reversal, will monitor before FOMC meeting news release

GBPUSD A Fall Expected! SELL!
My dear friends,
GBPUSD looks like it will make a good move, and here are the details:
The market is trading on 1.3181 pivot level.
Bias - Bearish
Technical Indicators: Supper Trend generates a clear short signal while Pivot Point HL is currently determining the overall Bearish trend of the market.
Goal - 1.3152
About Used Indicators:
Pivot points are a great way to identify areas of support and resistance, but they work best when combined with other kinds of technical analysis
Disclosure: I am part of Trade Nation's Influencer program and receive a monthly fee for using their TradingView charts in my analysis.
———————————
WISH YOU ALL LUCK

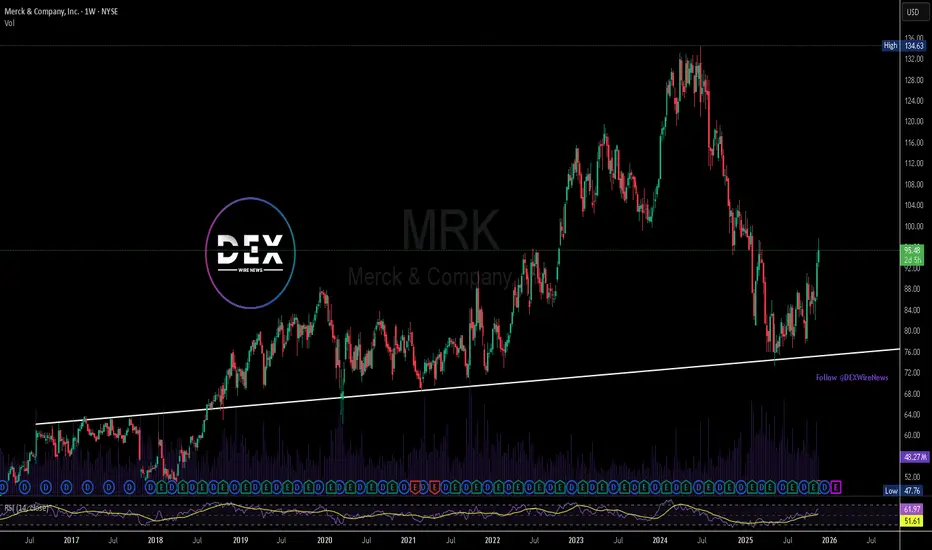
Merck (NYSE: $MRK) Wins EU Approval for Subcutaneous KeytrudaMerck (NYSE: NYSE:MRK ) has secured a major regulatory milestone after the European Commission approved a new subcutaneous version of Keytruda, the company’s flagship cancer therapy. This marks a significant expansion for one of the world’s best-selling immunotherapy drugs, previously only administered intravenously. The new formulation allows injections under the skin, giving patients faster, more convenient access to treatment while reducing strain on hospital infusion facilities.
The approval applies to all adult indications for which Keytruda is already authorized in the European Union. Keytruda works by activating the body’s immune system to identify and attack cancer cells, and it remains a cornerstone therapy across multiple cancer types. Merck reported more than $23.3 billion in Keytruda sales during the first nine months of the year, underscoring the drug’s central role in the company’s revenue base. The new delivery method may further strengthen market demand, especially in regions prioritizing efficiency and patient comfort.
From a technical standpoint, Merck’s stock continues to trade in a bullish structure. Price action remains firmly above a long-standing ascending support trendline that has held since 2019. As long as this structure remains intact, the next major long-term upside target sits at the $134 level, a zone supported by higher-timeframe momentum. A temporary pullback is possible, and any retracement could provide a retest of the ascending support before buyers attempt another continuation.
Overall, Merck’s regulatory win adds fundamental strength to an already constructive technical outlook. With Keytruda’s expanded accessibility and consistent revenue performance, long-term sentiment appears supportive. Bulls will want price to stay above the structural trendline to maintain the pathway toward the $134 target.
FX Futures: Dollar Strength Prevails Amidst Shifting Global TideOver the past two weeks, the FX futures landscape has been largely dominated by a resurgent U.S. Dollar, creating distinct trends across major currency pairs. The Dollar Index futures have shown a clear upward trajectory, fueled by a hawkish tone from the Federal Reserve, robust U.S. economic data, and a persistent belief that interest rates will remain higher for longer. This Dollar strength has put significant pressure on its counterparts. Euro futures struggled to maintain ground, testing key support levels as eurozone economic indicators hinted at a potential slowdown, making the ECB's less hawkish stance more pronounced. Similarly, British Pound futures faced headwinds, reflecting ongoing concerns about inflation and growth in the UK.
Beyond the majors, Japanese Yen futures continued their multi-week slide, extending losses as the Bank of Japan remained steadfast in its ultra-loose monetary policy, creating a widening interest rate differential with the U.S. On the other hand, Canadian Dollar futures showed a bit more resilience, benefiting from a relatively stable oil market and domestic economic data that provided some support. Traders across the board are keenly watching central bank commentary and upcoming inflation prints, as these will likely dictate whether the Dollar's reign continues unchallenged or if other currencies can find a catalyst for a reversal in the weeks ahead.
*CME Group futures are not suitable for all investors and involve the risk of loss. Copyright © 2023 CME Group Inc.
**All examples in this report are hypothetical interpretations of situations and are used for explanation purposes only. The views in this report reflect solely those of the author and not necessarily those of CME Group or its affiliated institutions. This report and the information herein should not be considered investment advice or the results of actual market experience.

EURAUD Technical Analysis! SELL!
My dear followers,
I analysed this chart on EURAUD and concluded the following:
The market is trading on 1.7853 pivot level.
Bias - Bearish
Technical Indicators: Both Super Trend & Pivot HL indicate a highly probable Bearish continuation.
Target - 1.7776
About Used Indicators:
A super-trend indicator is plotted on either above or below the closing price to signal a buy or sell. The indicator changes color, based on whether or not you should be buying. If the super-trend indicator moves below the closing price, the indicator turns green, and it signals an entry point or points to buy.
Disclosure: I am part of Trade Nation's Influencer program and receive a monthly fee for using their TradingView charts in my analysis.
———————————
WISH YOU ALL LUCK

Gold Breaks Higher to 4,105 – New Bullish Momentum Confirmed📊 Market Overview
Gold has surged strongly from the 4,084 zone and decisively broke through the 4,102–4,104 resistance area, now trading around 4,105 USD/oz. The rally is supported by a slightly weaker USD, steady U.S. yields, and strong technical buying after the breakout. Buyers are clearly in control.
📉 Technical Analysis
• Nearest Resistance: ~ 4,110 USD/oz
• Additional Resistance: ~ 4,120 USD/oz
• Extended Resistance: ~ 4,135 USD/oz — target if bullish momentum continues.
• Nearest Support: ~ 4,102 USD/oz — fresh breakout zone.
• Additional Support: ~ 4,095 USD/oz — safe pullback level.
• Extended Support: ~ 4,084 USD/oz — key pivot before the rally.
• EMA09: Price is trading well above EMA09, confirming a short-term uptrend.
• Candles & Momentum:
• Strong bullish candles with solid volume → momentum remains strong.
• No significant rejection candles yet → trend remains intact.
📌 Outlook
Gold shows clear bullish momentum after the breakout.
• Holding above 4,102 may lead price toward 4,110 → 4,120, and potentially 4,135 next.
• Only a drop below 4,095 would signal risk of a deeper pullback toward 4,084.
💡 Trade Strategy Suggestions
🔺 BUY XAU/USD
Entry: 4,102 – 4,105 (post-breakout pullback)
🎯 TP: 40 / 80 / 200 pips
❌ SL: 4,098
🔻 SELL XAU/USD (Only with clear rejection)
Entry: 4,118 – 4,121
🎯 TP: 40 / 80 / 200 pips
❌ SL: 4,125

SILVER (XAGUSD): Bullish Continuation After Pullback
There is a high chance that Silver will go up from the underlined support.
A bullish breakout if a neckline of an inverted head & shoulders pattern
provides a strong confirmation.
Expect a rise to 53.2 level.
❤️Please, support my work with like, thank you!❤️
I am part of Trade Nation's Influencer program and receive a monthly fee for using their TradingView charts in my analysis.

EURUSD My Opinion! BUY!
My dear friends,
Please, find my technical outlook for EURUSD below:
The instrument tests an important psychological level 1.1546
Bias - Bullish
Technical Indicators: Supper Trend gives a precise Bullish signal, while Pivot Point HL predicts price changes and potential reversals in the market.
Target - 1.1579
About Used Indicators:
Super-trend indicator is more useful in trending markets where there are clear uptrends and downtrends in price.
Disclosure: I am part of Trade Nation's Influencer program and receive a monthly fee for using their TradingView charts in my analysis.
———————————
WISH YOU ALL LUCK
