USDCAD: Buying After the Trap 🇺🇸🇨🇦
Quick update for the yesterday's post for USDCAD.
I finally see some strength of the buyers after a test
of the underlined intraday support.
A buying imbalance after a trap suggests a highly probable growth.
Expect a rise at least to 1.4013
❤️Please, support my work with like, thank you!❤️
I am part of Trade Nation's Influencer program and receive a monthly fee for using their TradingView charts in my analysis.
Contains image

GLENMARK is ready keep am eyesGLENMARK is good stock this is good understanding how market react on good level

Gold still in it's year-end range, good scalping opportunitiesThis year's high is in, the same forecast as last year if you watched with me this time last December.
We can expect that the new year candle will target the previous high quickly and swiftly as always, but until then we scalp this year-end wick range using LTF OB/FVGs for minimal pip TPs

Hellena | GBP/USD (4H): SHORT to min wave "4" area 1.30100.Colleagues, I haven't reviewed the pound for a long time and now I finally did it)
The wave layout shows that the downward movement is not over yet. I think that wave “4” will soon complete its development and the impulse in wave ‘5’ will start, which will complete the big correction “C”. The minimum target is the support area at 1.30103.
Further we will observe the activity in this area.
Manage your capital correctly and competently! Only enter trades based on reliable patterns!

TradeCityPro | LDO Support Zone: Is a Trend Reversal Coming?👋 Welcome to TradeCityPro!
In this analysis, I want to review the LDO coin for you, one of the DeFi projects with a $634 million market cap, currently ranked 87th on CoinMarketCap.
⏳ 4-Hour Timeframe
On the 4-hour timeframe, this coin is sitting on a very important support level, which has already been tested twice.
✔️ Overall, a downtrend is visible on the LDO chart, and breaking this support zone could allow the price to continue moving within this bearish structure.
⭐ If this support breaks, we can open a short position.The next support zone the price may head toward is 0.6229.
💥 If the coin gets supported at this level instead, the first long trigger will be the 0.7840 level.A stabilization above this level will be the first sign of bullish momentum returning.
💡 The main trend-reversal triggers are 0.8962 and 1.0209.For spot buying, we can wait for a breakout of these levels.
🛒 However, for spot entries, besides these triggers, I also wait for confirmation from macro indicators such as Others.D and BTC.D.I do not enter based solely on price confirmation.
📝 Final Thoughts
Stay calm, trade wisely, and let's capture the market's best opportunities!
This analysis reflects our opinions and is not financial advice.
Share your thoughts in the comments, and don’t forget to share this analysis with your friends! ❤️

EURUSD – Liquidity Grab Signals Possible Upside ExpansionEURUSD Analysis – Wednesday, November 19
Welcome traders! 👋
I’m glad to have you here — we’re all learning and growing together in this amazing trading journey.
Let’s dive into today’s analysis on EURUSD 👇
Higher-Timeframe Overview
weekly timeframe:
EURUSD remains bearish, with the broader structure still pointing downward. The pair continues trading inside a long-term bearish leg, and no major shift has occurred on this timeframe.
Daily timeframe:
Price has taken out sell-side liquidity, creating a short-term bullish reaction. This gives the market the potential for a corrective move upward toward premium areas or unmitigated supply.
4H timeframe:
Similar to the daily, the 4H chart also swept sell-side liquidity, creating a bullish reaction and opening the door for a short-term upward leg.
A clear POI and Order Block (OB) above price are identified as potential targets.
Scenarios for November 19
Scenario 1 – Preferred Path
Price takes out the Asia session high liquidity.
After sweeping liquidity, EURUSD retraces toward the primary POI, which is located at the 50% of the wick of the 4H candle.
If the POI provides confirmation (reaction, BOS on LTF, displacement), there is long potential toward the OB target above.
Invalidation:
If this wick (the POI) gets broken cleanly, the structure turns bearish again and the higher-timeframe trend resumes downward.
Scenario 2
The price may sweep the Asia session high liquidity, and in this case, EURUSD could continue upward toward the Order Block (OB), then from the OB move toward the POI, and finally continue its bullish expansion.
Important Notes
• The market is never 100%, so require confirmation before entering.
• Manage risk carefully and stay alert to high-impact news events, as volatility may invalidate setups or create false breaks.
• Comment below and share your bias.
📘 Educational Note:
This analysis is for educational and illustrative purposes only.
Always follow your own plan, confirm with your strategy, and manage risk carefully.
Success in trading comes from discipline, patience, and consistency.
🚀 Empowering traders through clarity, confidence & clean charts.
Follow 👉 parisa_tl for more SMC setups and weekly insights 💙.
#EURUSD #ForexAnalysis #SmartMoneyConcepts #LiquiditySweep #OrderBlock #POI #ForexTrader #FXMarket #DayTrading #PriceAction #SMCTrading #TechnicalAnalysis #ForexSetups #EuroDollar #TradingView #parisa_tl

I came back stronger and more powerful than ever.
Prepare yourself for big drops as the uptrend is weaker and the weakness in the trend is quite evident.

EURGBP FRGNT Daily Forecast -Q4 | W47| D19 | Y25 |📅 Q4 | W47| D19 | Y25 |
📊 EURGBP FRGNT Daily Forecast
🔍 Analysis Approach:
I’m applying Smart Money Concepts, focusing on:
Identifying Points of Interest on the Higher Time Frames (HTFs) 🕰️
Using those POIs to define a clear trading range 📐
Refining those zones on Lower Time Frames (LTFs) 🔎
Waiting for a Break of Structure (BoS) for confirmation ✅
This method allows me to stay precise, disciplined, and aligned with the market narrative, rather than chasing price.
💡 My Motto:
"Capital management, discipline, and consistency in your trading edge."
A positive risk-to-reward ratio, paired with a high win rate, is the backbone of any solid trading plan 📈🔐
⚠️ Losses?
They’re part of the mathematical game of trading 🎲
They don’t define you — they’re necessary, they happen, and we move forward 📊➡️
🙏 I appreciate you taking the time to review my Daily Forecast.
Stay sharp, stay consistent, and protect your capital
— FRNGT 🚀
FX:EURGBP

GBPCHF → Countertrend correction. Retest of resistance FX:GBPCHF is testing key resistance at 1.0515 as part of a countertrend correction. Bears are behaving quite aggressively in the current market...
The global trend is downward. After retesting the local bottom, the currency pair is forming a correction to the previously broken consolidation border.
The key area of interest is 1.0515, and bears are trying to hold it. The battle for the zone has been going on for several hours. In extreme cases, a retest of 1.054 is possible before a decline.
A false breakout of resistance (consolidation border) is forming as part of a countertrend movement...
Resistance levels: 1.0515, 1.0542
Support levels: 1.0486, 1.0443
If the bears keep the price below 1.0515, completing the reversal pattern, this could trigger a further decline. Otherwise, the currency pair may form a short squeeze and test 1.0542 before declining...
Best regards, R. Linda!

DXY FRGNT Daily Forecast -Q4 | W47| D19 | Y25 |📅 Q4 | W47| D19 | Y25 |
📊 DXY FRGNT Daily Forecast
🔍 Analysis Approach:
I’m applying Smart Money Concepts, focusing on:
Identifying Points of Interest on the Higher Time Frames (HTFs) 🕰️
Using those POIs to define a clear trading range 📐
Refining those zones on Lower Time Frames (LTFs) 🔎
Waiting for a Break of Structure (BoS) for confirmation ✅
This method allows me to stay precise, disciplined, and aligned with the market narrative, rather than chasing price.
💡 My Motto:
"Capital management, discipline, and consistency in your trading edge."
A positive risk-to-reward ratio, paired with a high win rate, is the backbone of any solid trading plan 📈🔐
⚠️ Losses?
They’re part of the mathematical game of trading 🎲
They don’t define you — they’re necessary, they happen, and we move forward 📊➡️
🙏 I appreciate you taking the time to review my Daily Forecast.
Stay sharp, stay consistent, and protect your capital
— FRNGT 🚀
TVC:DXY

My Expectation19/11/2025... will see how it goes. Not a financial advise, this is just my personal view.

USOIL ANALYSIS SETUP READ THE CAPTIONUSOIL is consolidating above a strong support zone while forming higher lows, indicating bullish pressure building. Price is currently testing the trendline resistance, and a clean breakout could open the way toward the upper target zone. As long as price stays above support, the bullish scenario remains valid.
Please Support with Boost and comments

Gold Short-Term Rally – Potential to Continue Upside📊 Market Update:
Gold is currently trading around USD 4,078/oz, up from the 4,072 support zone due to short-term buying and weaker USD. Recent US economic news hasn’t been strong enough to halt the short-term uptrend.
📉 Technical Analysis:
• Key resistance: USD 4,085 4.088
• Additional resistance: USD 4.095
• Nearest support: USD 4.072 4.074
• Additional support: USD 4.065
• EMA 09: Price is above EMA 09 → short-term bullish bias continues.
• Candlestick/momentum: Strong bullish candle with high volume → confirms buying pressure dominance.
📌 Outlook:
Gold may continue rising in the next few hours if support at 4,072 4.074 holds. Conversely, if a rejection candle forms at resistance 4,085 4,088 or 4.095, a short-term pullback to 4,065 4,072 is possible.
💡 Short-Term Trading Strategy:
• SELL XAU/USD at: 4,084 4.088
🎯 TP: 40/80/200 pips
❌ SL: 4,092
• BUY XAU/USD: 4.065-4062
🎯 TP: 40/80/200 pips
❌ SL: 4,059

Is this the end? Very possible or very close.Hello Traders,
Some possible bad news. After watching bitcoin lose support and plow thru a massive buy wall at 90 and seeing the SPX close below the 50DMA I think we are about to enter a correction in the markets. Also when I checked fib levels they are very extended from the 2022 correction ..close to the 2.618 fib. Also checked the April dip and we are almost at the 1.618 fib. Tomorrow we have Nvidia earnings. To me this whole market is riding on the hope Nvidia kills it but even so I'm not sure that will be enough will all the negativity right now including the very extended markets and bitcoin crashing. A few more tidbits. Last year same date Nvidia earnings they beat but that began NVidias downtrend which lasted till April this year. Which just so happened on VIXEX and guess what tomorrow is also VIXEX. Then tomorrow is also a New "Bear" Moon. Plus we went into mercury retrograde on November 9, 2025 which will end on November 29, 2025. So combine all this together and I think the odds are good that a correction is due. The only strange things is this is November... a normally strong month. It is possible we have one more sneaky up move... or some incredible news besides Nvidia earnings that give this market a second wind... I just don't see it. I went from 90 in the market to about 30% today.. So I have a lot of cash and depending what happens this week I can sell even more. Well lets see what happens.
Old Ship Fleet: uncertainty and risk.In the old days, buying a trading ship posed risks due to natural disasters. Later on, people could have option to buy lets say a 10% share in a fleet of 10 trading ships. When one ship goes down, it doesn't ruin your "portfolio".
I think the concept about not putting all eggs in one basket fits well into risk taking.
Then you have some investors claim, you put all your eggs into one basket - and guard the basket.
The ship fleet works as a syllogism about uncertainty. Math (probability of disaster on statistical basis). And risk taking.
Eggs in one basket is a syllogism about losing everything. But not uncertainty or risk-taking per se.
-> In competitive spaces, with only few or one winner. With exponential, explosive returns -- diversifying or putting eggs in separate baskets make no sense. "Fortune favors the bald" is a better way to describe it.
but it says nothing about mathematical side of uncertainty or risk taking. Hence the "old ship fleet".
$BTC BOTTOM IN - Dragonfly Doji Reversal CandleBOTTOM IS IN
⚠️ Need to reclaim ~$95k within the next couple days to confirm, but I’m confident.
🐉 Printed a Dragonfly Doji Reversal candlestick with a Volume breakout to accompany.
🐉 RSI also sitting at lowest since Liberation Day.
🐉 Death Cross historically marks bottoms.
🐉 This 29% correction lines up perfectly with prior ones before next impulsive move up.

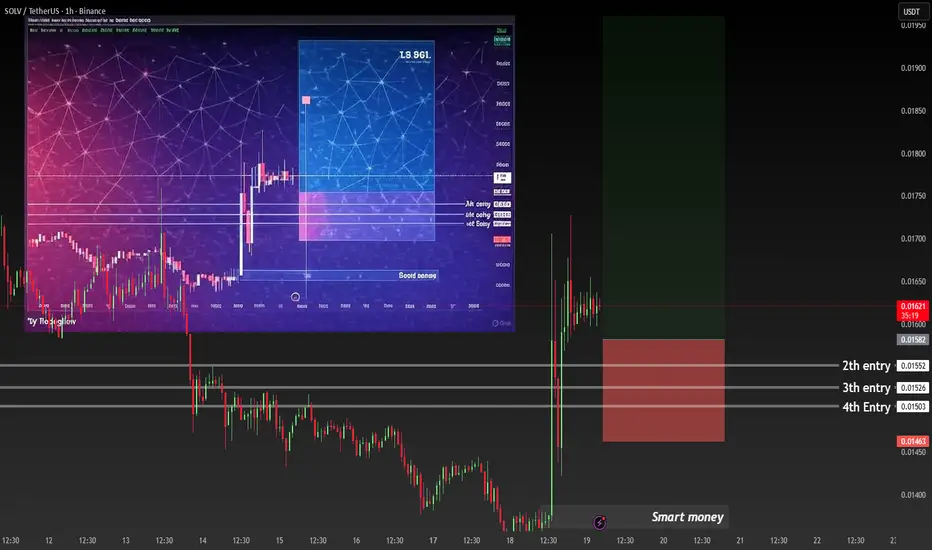
SOLV about to 10x–100x from here | Smart Money quietly loading tThis is NOT Solana ( CRYPTOCAP:SOL ) – this is NYSE:SOLV (Solana VM chain) sitting at the EXACT bottom that printed the +28,000% pump last cycle.
What you’re seeing right now:
- Yearly support held perfectly for 18 months
- Final deviation + reclaim (smart money’s favorite setup)
- 4 layered buy zones I’m filling aggressively: 0.01503 → 0.01526 → 0.01552 → 0.01623
- Volume drying up = calm before the most violent leg up
Last time this level was touched → price went from $0.008 → $2.35 in 4 months.
If you miss this dip, you’ll be buying my bags at $0.50–$1.50 screaming “why didn’t I listen”.
This is the literal “before” picture everyone screenshots in 3 months saying “I was here”.
Not financial advice – just showing you where the rocket fuel is.
#SOLV #100xGem #LowCapSeason #Crypto #Altseason
Screenshot this chart. Thank me in January.
Projecting Interest Rates Beyond the Current Fed RegimeCBOT: 10-Year T-Notes Futures ( CBOT:ZN1! )
Since hitting an all-time high (ATH) of 48,431 on November 12th, the Dow Jones Industrial Average lost 1,841 points, or -3.8%, to 46,590 on Monday.
Meanwhile, the Nasdaq Composite has lost over 1,300 points, or -5.5%, from its ATH of 24,020. The S&P 500 is down 250 points, or -3.6%, from 6,920. Both the Nasdaq and the S&P reached their ATH on October 29th.
Cryptocurrencies have been harder hit than stocks. Today, Bitcoin prices dropped below $90,000, a whopping 29% drawdown since the King of Crypto hit ATH of $126,080. An entire year of gains has been erased.
Two key market forces are driving the US stock market downtrend.
Firstly, Wall Street grew worried about the AI bubble bursting. Earlier this month, “Big Short” investor Michael Burry grabbed headlines after his Scion Investment’s 13F filing showed bearish bets on Nvidia (NVDA) and Palantir (PLTR). Last week, Softbank offloaded all 32.1 million shares of NVDA it held. This is followed by Peter Thiel’s hedge fund, which sold off all 537,742 shares of NVDA on Monday.
On my October 27th commentary, I discussed that heavy exposure in High Tech stocks (64%) made Nasdaq very venerable. The Dow could weather the downturn better with a lower weight (21%). The recent market trend resonates with my theory.
Secondly, the Federal Reserve has turned hawkish on monetary policy. The Fed made the last rate cut on October 29th, without the aid of updated economic data due to US government shutdown. Fed officials have warned that further rate cuts are not a sure thing if new data does not support policy easing.
On October 27th, the odds for a December cut were 98.5%, according to data from the CME FedWatch tool. Today, it went down sharply to just 57%. Not cutting has the same effect as raising expected interest rates, which tends to drive down stock valuation.
www.cmegroup.com
The Future is Less Uncertain than the Present
In my view, the market obsession with what the Fed Chair says day by day is overblown. Anybody remember a quote from Alan Greenspan? While modeling short-term decisions into long-term trends, we risk overlooking the impact from changing of guards at the Fed.
The current Fed Chair’s term will end in May 2026. Between now and then, there are four FOMC rate-setting meetings: December 9-10, 2025, January 27-28, March 17-18 and April 28-29 in 2026. What could possibly happen in four meetings:
• If the Fed is hawkish and refuses to cut rates, the policy Fed Funds rate could stay at the current 375-400 bp range.
• If the Fed turns dovish and cut 25bp every time, Fed Funds could be at 275-300 bp.
In recent meetings, the Fed no longer had consensus in its policy votes. Each decision is like a toss-up. If we only focus on the short term, trading results could be very volatile.
The next Fed Chair will be nominated by President Trump and confirmed by the Senate. We know for a fact that the President favors aggressive rate cuts to support the economy. Only someone who is 100% in agreement with the President could get nominated.
Latest news indicates that five candidates have made it to the final list to be considered for a Fed Chair nomination. They are Michelle Bowman, Christopher Waller, Kevin Warsh, Kevin Hassett and Rick Rieder.
If the Senate confirmation gets delayed, the President could pick a current Fed governor as Acting Chair. Whoever that may be, he or she will have to align with the President in terms of the direction of monetary policy. Gone with the independent central bank.
Even though we have no idea what happens next month, we could still form a good estimate of what the Fed will do in the next 2-1/2 years, starting in June 2026.
In my opinion, the expected policy rate will eventually go down to 1.0-1.5%, or even lower. This is not what the Fed currently says. Instead, I am forming an opinion based on a new Fed regime with a new Chair and multiple Fed governors supporting rate cuts.
With that in mind, we can now discuss trade strategies going beyond the next Fed meeting. We don’t have to wait a long time for everything to move in places. Once a new Fed Chair candidate is announced, the market will start pricing a different interest rate trajectory. Latest news suggests that the President may be meeting with three candidates after the Thanksgiving holiday.
Trading with 10 Year T-Notes Futures
As I mentioned earlier, US stocks have the risk of AI bubble bursting. We could wait a while to see how things play out. My trade idea today is a pure play on interest rates.
We know that Treasury prices are negatively correlated with interest rates. When rates go down, prices will likely go up. Our major chart illustrates this relationship.
CBOT 10-Year Treasury Notes Futures have a face value of $100,000 at maturity. The March 2026 contract (ZNH6) is currently quoting 112'240, equivalent to $112.75. Buying or selling one contract requires an initial margin of $1,875.
The 10Y futures are one of the most liquid futures contracts in the world. According to CME Group data, trade volume on November 17th was 1,779,688 contracts. Open Interest (OI) is 5,748,386 contracts at market close. OI is notional term is $574.8 billion.
In the next three FOMC meeting cycles, the contract prices could go either way depending on how the Fed votes. However, as soon as the President nominate his Fed Chair candidate, Treasury prices would get a big boost as the market will price in the new and lowered expected interest rates.
Hypothetically, if ZNH6 moves up 1% to $113.8775, the $1.1275 price gain would translate into $1,127.5 for a long futures position, given each dollar gain in price quotation equals $1,000 per contract. Using the initial margin of $1,875 as a cost base, the trade would produce a theoretical return of 60.1% (=1127.5/1875).
The long futures position will lose money if the Fed puts rate cuts on hold, and the new Fed Chair candidate is not announced in the next three months.
Happy Trading.
Disclaimers
*Trade ideas cited above are for illustration only, as an integral part of a case study to demonstrate the fundamental concepts in risk management under the market scenarios being discussed. They shall not be construed as investment recommendations or advice. Nor are they used to promote any specific products, or services.
CME Real-time Market Data help identify trading set-ups and express my market views. If you have futures in your trading portfolio, you can check out on CME Group data plans available that suit your trading needs www.tradingview.com

GBP/CAD - Triangle Breakout (17.11.2025)🧠 Setup Overview
GBP/CAD has broken below a symmetrical triangle, signaling a potential bearish continuation after repeated rejections from the upper trendline. The pair is now trading under the breakout level, with sellers showing strong control. If bearish momentum continues, the next support zones become key targets.
📊 Trading Plan 🔻 Bearish Scenario (Primary Bias)
Look for a clean breakdown retest and rejection for confirmation
Bearish continuation expected toward the support areas below
🎯 Targets:
1st Support: 1.8335
2nd Support: 1.8287
⚡ Fundamental Outlook — Today (17 Nov 2025)
GBP Sentiment – The Pound remains under pressure as markets expect the Bank of England to stay cautious, given ongoing inflation uncertainty and slowing economic data.
CAD Sentiment – The Canadian dollar stays supported by stable Bank of Canada policy and improving expectations around the energy sector.
– Rising US bond yields indirectly support CAD’s strength through its correlation with risk-on flows.
➡️ Overall: Fundamentals align with the bearish bias on GBP/CAD.
#GBPCAD #Forex #TechnicalAnalysis #TriangleBreakout #PriceAction #CAD #GBP #ChartPatterns #ForexTrader #TradingView #KABHI_TA_TRADING #ChartsDontLieTradersDontQuit #BearishSetup #MarketOutlook #FXMarket
⚠️ Disclaimer
This analysis is for educational purposes only and not intended as financial advice.
Always wait for confirmation and follow your risk management rules.
💬 Support My Work ❤️
If this helped you:
👍 LIKE, 💬 COMMENT, and 🔔 FOLLOW
Your support encourages more clean chart breakdowns & daily setups!

SPY Long From Demand Area! Buy!
Hello,Traders!
SPY tapped the higher-timeframe mitigation block after clearing sell-side liquidity, showing a strong bullish response. If displacement continues, price may rally toward the premium target. Time Frame 5H.
Buy!
Comment and subscribe to help us grow!
Check out other forecasts below too!
Disclosure: I am part of Trade Nation's Influencer program and receive a monthly fee for using their TradingView charts in my analysis.

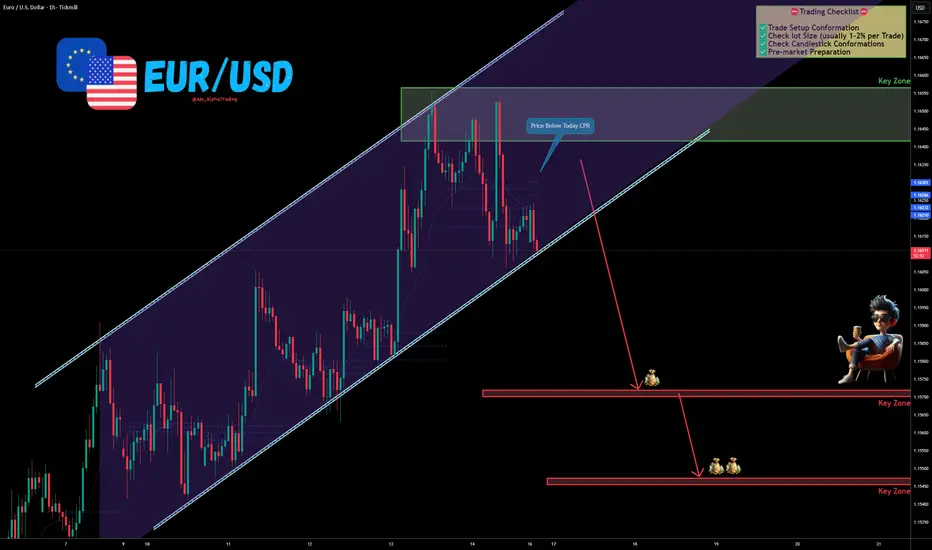
EUR/USD – Channel Breakdown Possibility | CPR Rejection Signals The EUR/USD Pair, Price has been trading within a Channel Pattern on the H1 chart, forming consistent lower highs and lower lows. Price action is now testing the lower boundary of the pattern, signalling a possible breakdown.
✅Market Context:
1️⃣Downward structure building inside the pattern.
2️⃣Sellers are showing strength near support levels.
3️⃣Breakdown below the trendline indicates momentum continuation toward lower zones.
✅Trade Plan:
Entry: Sell after confirmed breakdown below the support (Candle close below trendline or retest of the breakout).
💰Take Profit (TP): At the Key Zone – major support area identified ahead.
🛑Stop Loss (SL): Above the pattern structure / recent swing high.
✅Psychological Discipline:
1️⃣Stick to plan – No Revenge Trades.
2️⃣Accept losing trades as part of the strategy.
3️⃣Risk only 1–2% of your account balance per trade.
✅ Support this analysis with a
LIKE 👍 | COMMENT 💬 | FOLLOW 🔔
It helps a lot & keeps the ideas coming!
⚠️ Disclaimer: This analysis is for educational purposes only and does not constitute financial advice. Forex trading involves high risk. Trade only with capital you can afford to lose and always do your own research.
EURUSD: Bearish-Neutral. Look For Lower Prices vs USDWelcome back to the Weekly Forex Forecast for the week of Nov.17-21st.
The EURUSD is ranging and choppy. But if the US Dollar is to remain strong, and pushes higher this week, expect the EURUSD to slide lower.
Look for the bearish BOS to indicate the pullback is over as a confirmation for shorts.
Enjoy!
May profits be upon you.
Leave any questions or comments in the comment section.
I appreciate any feedback from my viewers!
Like and/or subscribe if you want more accurate analysis.
Thank you so much!
Disclaimer:
I do not provide personal investment advice and I am not a qualified licensed investment advisor.
All information found here, including any ideas, opinions, views, predictions, forecasts, commentaries, suggestions, expressed or implied herein, are for informational, entertainment or educational purposes only and should not be construed as personal investment advice. While the information provided is believed to be accurate, it may include errors or inaccuracies.
I will not and cannot be held liable for any actions you take as a result of anything you read here.
Conduct your own due diligence, or consult a licensed financial advisor or broker before making any and all investment decisions. Any investments, trades, speculations, or decisions made on the basis of any information found on this channel, expressed or implied herein, are committed at your own risk, financial or otherwise.

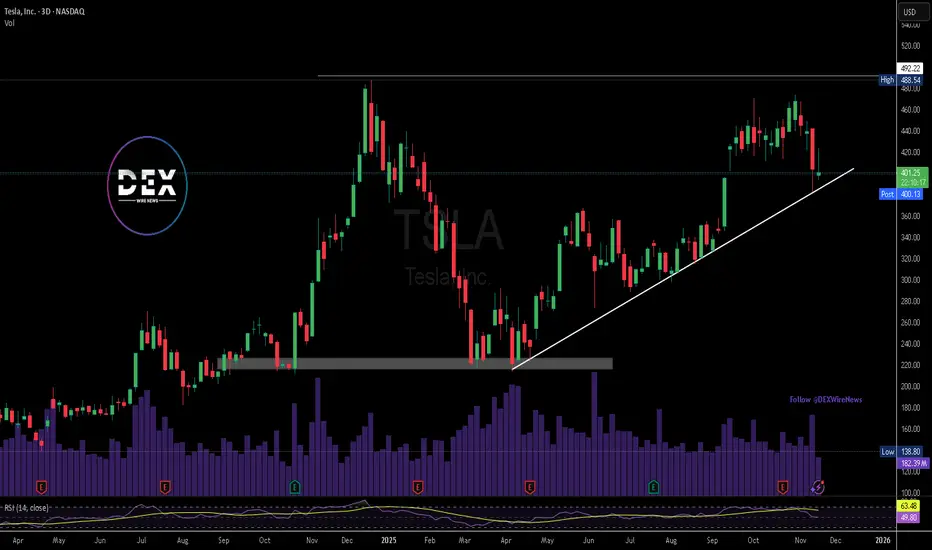
Tesla at Key Support Level & Wins Ride-Hailing Permit in ArizonaTesla has secured a Transportation Network Company (TNC) permit in Arizona, marking another strategic step toward launching its robotaxi service. While the permit does not authorize Tesla to operate a fully driverless ride-hailing network, it grants the company legal approval to function as a ride-hailing operator under state regulations. This follows Tesla’s earlier approval in September to test autonomous vehicles with a safety driver on Arizona roads.
According to the Arizona Department of Transportation, Tesla applied for the permit on November 13 and met all regulatory requirements, receiving approval on November 17. The TNC license positions Tesla to begin laying operational groundwork for its robotaxi ambitions, fleet structure, service protocols, pricing models, and state compliance, while it continues advancing autonomous capabilities through its Full Self-Driving (FSD) platform.
Arizona has long been considered one of the most autonomous-friendly states, hosting early deployments from Waymo, Cruise, and other AV developers. Tesla’s entry expands the competitive landscape and brings its robotaxi vision closer to reality, though safety-driver supervision remains mandatory for now. The new permit reinforces Tesla’s strategic push into transportation services, signaling that regulatory pathways for FSD-enabled ride-hailing are steadily opening.
Technical Outlook
Tesla’s chart shows price pulling back into a key ascending trendline that has supported the uptrend since April. The current zone around $401 is a strong demand area, aligning with trendline support
A bounce from this level sets Tesla up for a potential continuation toward the major resistance at $488. A clean break above that level would confirm a medium-term bullish extension. RSI remains neutral, suggesting room for upside if buyers defend current support.
If the trendline fails, Tesla could retest deeper support near the $330–$345 range. For now, momentum favors a rebound as long as the trendline holds.