Par Gap shorts for the day ZEC - DASH - ZEN - APT - STEEMPar Gap shorts for the day ZEC - DASH - ZEN - APT - STEEM Using mainly the PAR indicator
Contains IO script

HYPE | Technical & Fundamental OutlookDescription:
HYPE shows strong market activity with increasing interest in the crypto sector. On the technical side, the chart highlights key support and resistance levels, potential breakout zones, and momentum shifts that traders are closely monitoring. From a fundamental perspective, HYPE positions itself as an innovative project with growing community attention and expanding ecosystem utility.
This outlook is for educational purposes only and should not be considered financial advice. Always do your own research and manage risk responsibly before making any investment decisions.
#HYPE #Crypto #TechnicalAnalysis #Trading #Blockchain #MarketUpdate #Altcoins #CryptoTrading #PriceAction #ChartAnalysis

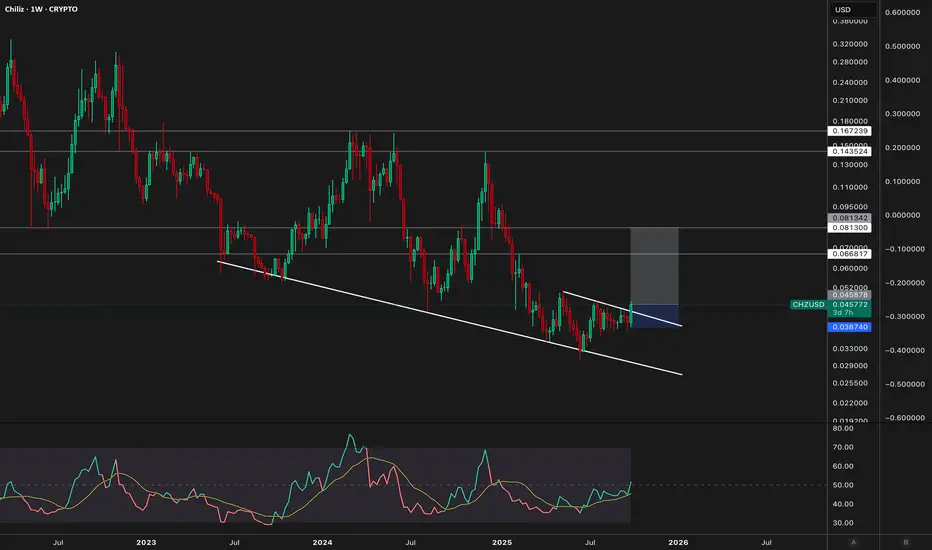
High Probability - Medium Term Swing SetupCHZ has broken out and I believe this trade setup is a high probability opportunity. I am not interested in the fundamentals of the network and am strictly focused on the technicals.
RISK: 0.0387 (LOW OF CURRENT 1W CANDLE)
TGT 1: 0.668 | 3:1 R/R
TGT: 0.0813 | 5:1 R/R
-------------------------------------------------
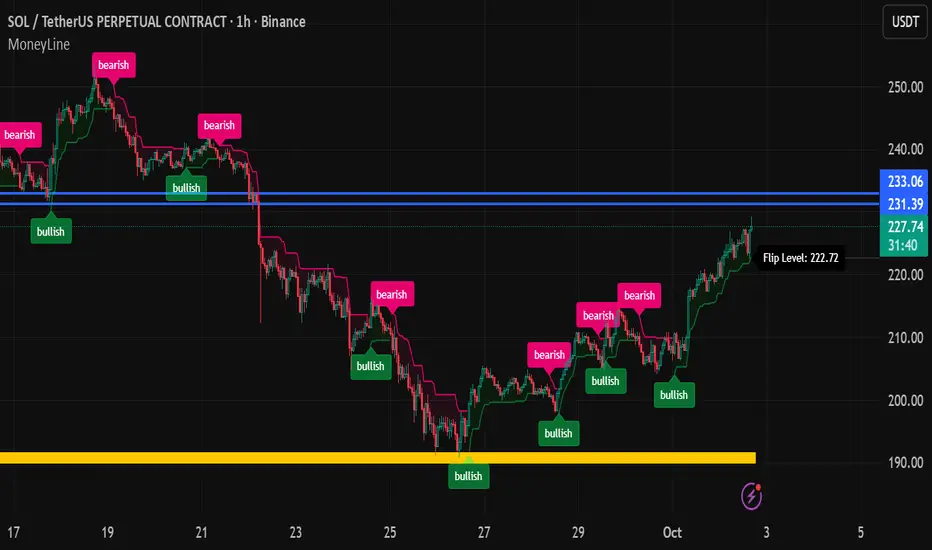
Next Stop for SOLThis is the next area for some consolidation before continuation LOL. Personally not taking profits in this area. That's because of my entry point. (I'm only up 35% at this level) I may pick more up if we can break above $233. Lets go!!
Research Report – USD/INR Technical & Macro OutlookI. Technical Analysis
Chart Pattern:
USD/INR is currently forming a Bullish Flag pattern after completing waves (1) to (4) as per Elliott Wave structure.
The corrective wave (4) has concluded around 88.40 – 88.50 levels, aligning with support from trendline and Bollinger Band lower zone.
Wave Projection (Elliott Wave):
Expected Wave (5) targets are:
0.618 extension: 89.20
1.000 extension: 89.61
1.618 extension: 90.28
This suggests a bullish move towards 89.20 – 90.30 levels in the near term.
Momentum Indicators:
Bollinger Band squeeze signals upcoming volatility expansion.
RSI remains neutral-to-bullish, supporting further upside.
Technical View: Bullish bias as long as USD/INR sustains above 88.40. Upside targets at 89.20 / 89.60 / 90.30.
II. Global Economic Factors
US Dollar Drivers
The US Fed’s monetary stance remains a key driver. Persistently higher US yields and hawkish tone could strengthen USD further.
US economy shows resilience in labor and consumer spending, supporting USD demand.
India-Specific Macro
RBI has intervened intermittently to stabilize INR, but India’s current account deficit pressure (due to higher crude oil imports) adds INR weakness.
Capital inflows through FPI/FDI remain supportive, but outflows on risk-off sentiment could weigh.
Global Risk Factors
Crude Oil Prices: Sustained Brent above $95/bbl adds to India’s import bill, weakening INR.
Geopolitical Uncertainty: Middle East tensions and Asian trade imbalances could fuel safe-haven demand for USD.
China Slowdown: Weak Asian demand environment indirectly pressures EM currencies including INR.
III. Risk Factors
RBI intervention risk near 89.50/90.00 levels.
Sudden reversal in crude oil prices.
Global risk-on flows into emerging markets, strengthening INR unexpectedly.
IV. Analyst View
Short-term traders: Buy on dips towards 88.50 – 88.60, SL: 88.20, Targets: 89.20 / 89.60 / 90.30.
Medium-term investors: Maintain cautious bullish stance; INR may depreciate further if crude oil and US yields remain high.
V. Methodology
Elliott Wave Analysis (Wave Count 1–5).
Bollinger Bands & RSI for momentum confirmation.
Macro drivers: Fed policy, RBI stance, crude oil dynamics, FII flows.
VI. Mandatory Disclosures
Analyst Certification: I/We hereby certify that the views expressed above are based on independent research and information believed to be reliable.
Conflict of Interest: The analyst(s) and entity have no financial interest or actual/beneficial ownership of more than 1% in USD/INR or related instruments.
Regulatory Note: This report has been prepared in compliance with SEBI (Research Analyst) Regulations, 2014 and amendments thereof.
Disclaimer: This is not investment advice. Forex trading carries high risk due to volatility and leverage. Investors should consider their risk appetite before acting on this analysis.

PAYC At Major SupportPaycom is at a major support level (200)
Expecting a bounce.
Entering January calls at 200.

CSP Premium Play-Consolidating just above dark pool support with major resistance at 138.57- TTM Squeeze showing momentum shifting up - Compression building. Volume is the missing fuel- breakout could run hard! This is a great Cash Secure Put candidate while waiting for upside. Premiums are sweet.

$SOL for Long Monthly ChartThis target will complete in next 1000 Days. Long target for SOL.
Cup & Handle Pattern on Monthly.
Short term
target is 900$
Target 2 is 1200$
Let's go.

XRP Fractal ExtendedI took the fractal that I previously posted and just dragged it out to the my timeframe of what I think a top will be for BTC and XRP. Same fractal, just extended for time. This is just speculation.

EURUSD, Finally being nice to me lol.I am still getting turned around on structure but as long as you show up you can catch it in alignment.

Eth to 10kEth looks to have broken out of its consolidation range. I prefer direct exposure and am also in BMNR. I believe this 4 year cycle will be broken and this cycle actually goes on much longer than people think. Eth has real use cases that are metalizing before our very eyes.

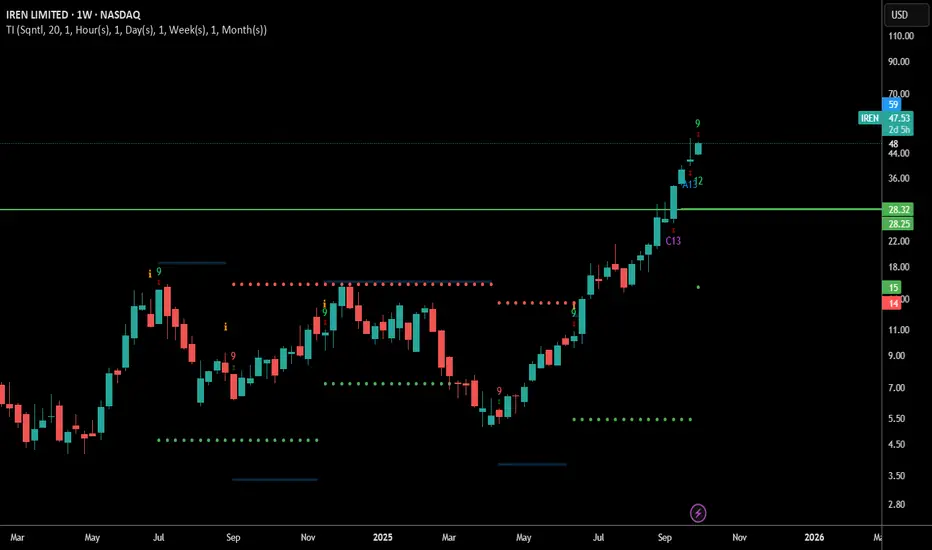
Iren buy areaWhat a beauty! TI sequential signaling a possible correction coming hitting 9 with a S13 coming next week. I expect a bit of a thrust up and then a correction near the IPO high around $28, this will probably get front run and/or bought up quickly. Does this have to happen.. no, absolutely not. But it's important to see the support areas and have a plan in place if a correction happens.
Another view for ALT season TP zoneSimilar to BTC.D but an inverted look and yet a little different..
Crypto season usually ends with an ALT rally. Green box is zone of interest.

PUMP | Technical & Fundamental InsightsDescription:
PUMP has recently shown increased market attention, reflecting growing community interest and speculative momentum. From a fundamental perspective, this asset is highly driven by sentiment, liquidity inflows, and overall market conditions rather than traditional intrinsic value. Monitoring volume spikes and key support/resistance zones is essential for short-term traders.
This analysis highlights both technical structures and underlying catalysts that could influence upcoming price action. Remember that PUMP remains a high-risk asset with strong volatility potential.
⚠️ Disclaimer:
This content is for educational purposes only and does not represent financial advice. Always conduct your own research before making investment decisions.
#PUMP #Crypto #TechnicalAnalysis #Trading #PriceAction #Fundamentals #Altcoins #MarketInsights #RiskManagement

USDT.D: Possible Take Profit zone for AltcoinsI see the green box as a safe zone to sell the altcoins.
so between 3.27% and 2.76%.
Setting an alert on 3.27% is advisable so you can pay attention.

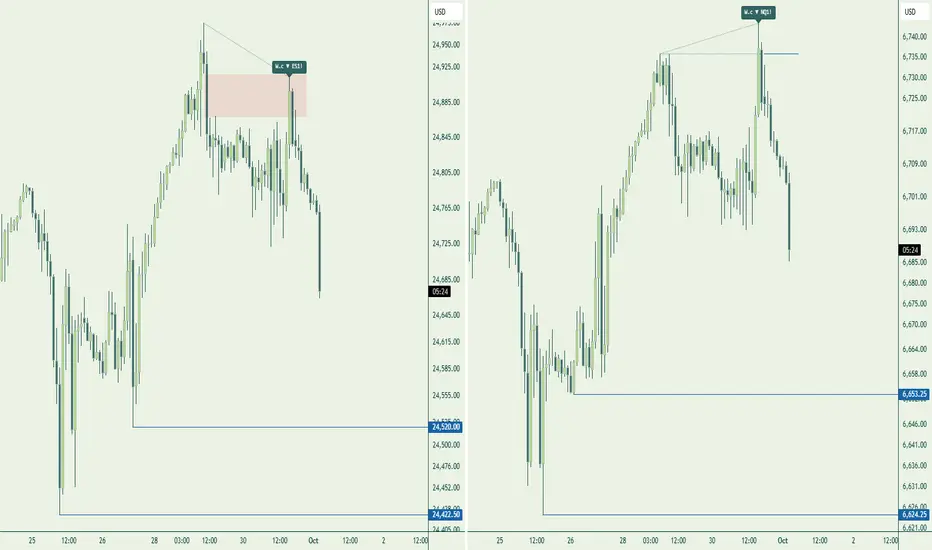
Previous Week's Low in CrosshairsBetter avoid catching the falling knife.
SSMT at Highs with displacement towards Old Liquidity Pools, Bulls are cooked.
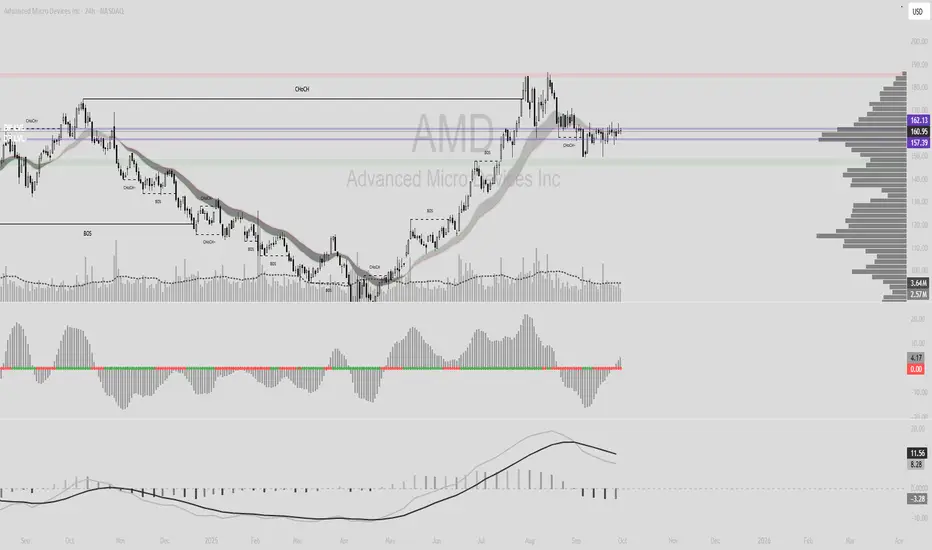
Coiled & Ready for Breakout AMD is coiled between 157 & 162.33 both key dark pool levels. The squeeze plus weekly MACD curl suggest a breakout setup. Heavy 7:1 call flow today adds confluence. Above 162.33, 175 comes into play if 157 continues to hold.
Recap on todays trades using PARRecap on todays trades using PAR - Very simply waiting for the lines to show you the way

I am LONG with LEAPS.Don't get shaken out. Monthly candle looks like a nice bottom to me. I am not worried about Open Ai tick tock app. The sound of doom scrolling nothing but AI generated content makes me want to put my brain in a microwave. I am betting on network effect and users which snap has.

The only trades you need this week!Here you will find a comprehensive breakdown of what BTC has done and what BTC will do next.
Join us as we watch to see if we transition structure on the 4h, and in doing so, open a world of possible trades.
Remember active risk management is the way to go, no gambling, be disciplined, plan your trade and trade your plan.


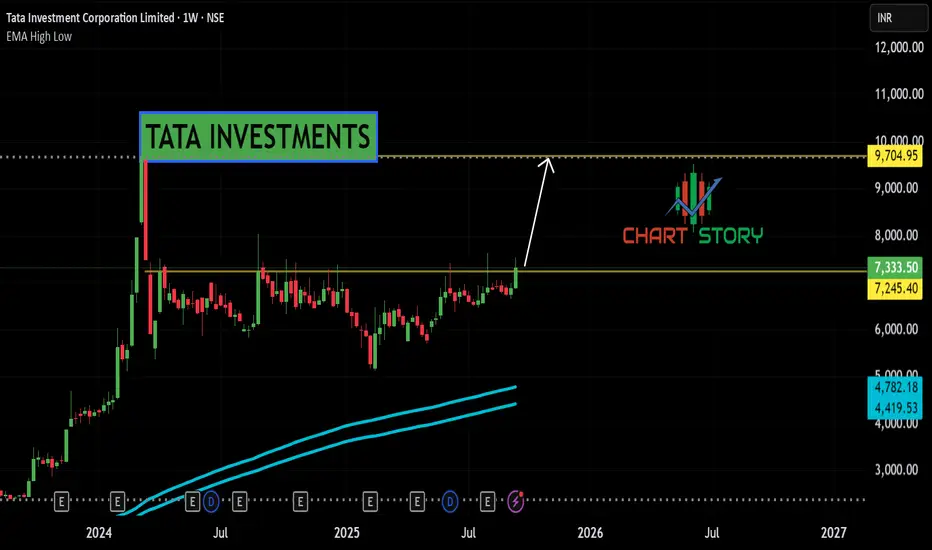
TATA INVESTMENTSNSE:TATAINVEST Weekly range breakout with outperformance. May climb may zoom upto new high soon.
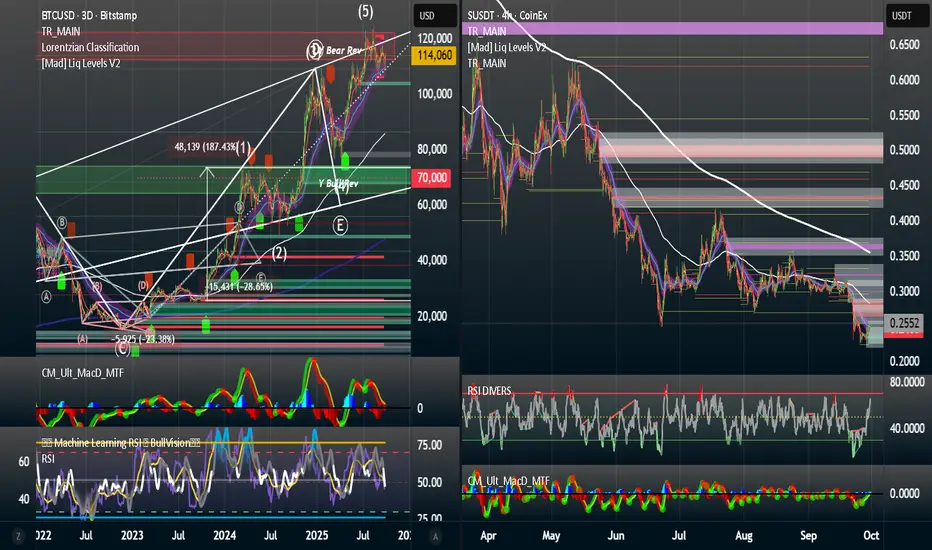
Sonic Price Zones and Macro ContextSonic (SUSDT:COINEX) - Macro + TA
Context:
Macro drivers: USD showing softness, yields stable, equities firm.
Crypto majors holding higher ranges; sentiment neutral.
Key Levels:
Support zones: 0.300–0.305, 0.285, 0.270
Resistance zones: 0.335–0.350, 0.375–0.385, 0.400–0.410, 0.460
2H View:
A 2H close above 0.335 with RSI > 50 would suggest room toward 0.350 / 0.375 / 0.400.
A 2H close below 0.300 could open space toward 0.285 / 0.270 / 0.255.
4H View:
The 200EMA around 0.34–0.35 remains an important zone.
Sustained closes above 0.335–0.340 could leave upside potential to 0.350 / 0.375 / 0.400.
Rejections near 0.350 with momentum slowing may see a move back toward 0.335 / 0.322 / 0.305.
1D View:
Since July, price has ranged 0.30–0.35; supply sits at 0.40–0.46.
Closes around 0.300–0.305 with constructive candles may lead toward 0.335 / 0.350 / 0.375.
A daily close above 0.375 would highlight 0.400 / 0.430 / 0.460.
A daily close under 0.300 would refocus attention on 0.285 / 0.270 / 0.250.
1W Lens:
Market remains under weekly supply 0.40–0.46.
A weekly close above 0.46 would bring 0.50–0.55 into view.
0.30–0.32 may act as an accumulation range while USD stays soft and majors stable; stronger USD or yields could shift focus toward 0.285–0.270.
---
Risk Notes:
Macro events (CPI releases, DXY moves, yield spikes) can shift these dynamics quickly.
TL;DR:
Constructive bias if 0.335 is reclaimed and held.
Losing 0.300 would shift focus to 0.285 / 0.270.
---
*Educational purposes only. Not financial advice. I also warrant that the information created and published here is not prohibited, doesn't constitute investment advice, and isn't created solely for qualified investors.*